
Note: I will be unavailable the entire week of July 4. The Practical Investor will resume July 11, 2022.
3:15 pm
SPX is at its target zone. There is a symmetry in the bounce at 3832.00. Time to be short. Have a great week!
1:56 pm
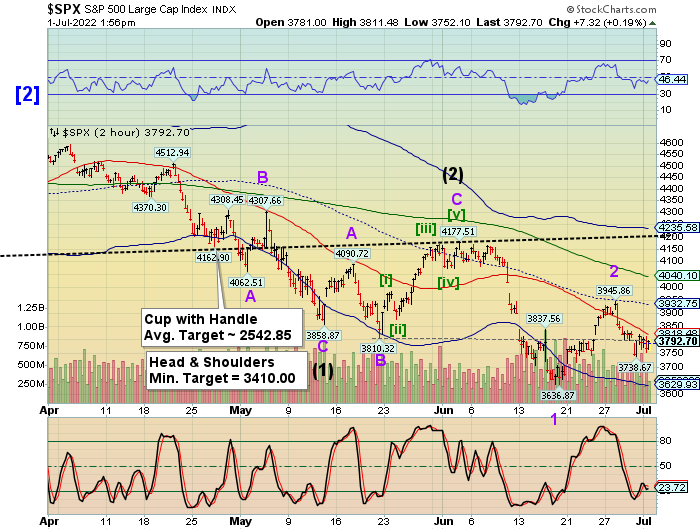
Dealers and hedge funds appear to be motivated to keep SPX above 3800.00 until the close. Max Pain is at 3820.00 while Cycle resistance is 3818.00 to 3825.00. Will the well-oiled options machine break down? Regardless of today’s close, earnings come to the fore next week. The Cycles Model implies trending weakness starting this weekend. What ever happened to those bank stress tests that were to be announce last weekend? Inquiring minds want to know.
10:30 am
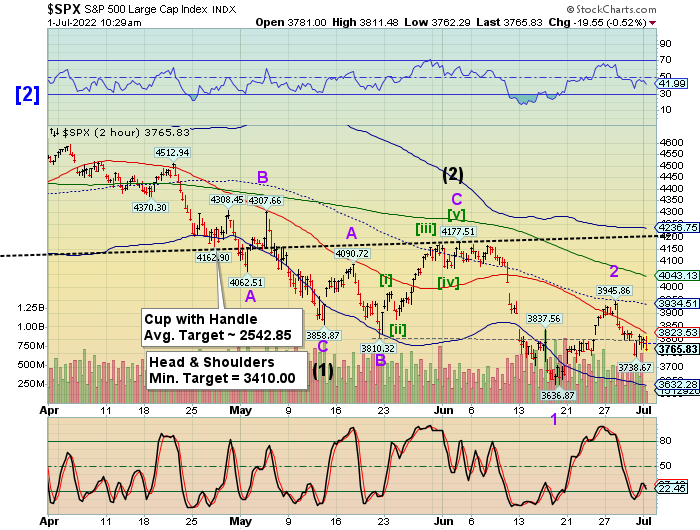
SPX is back down in short gamma. It appears that the dealers and hedge funds attempted an elevation above 3800.00 which failed. Gamma gets even shorter every 25 points beneath 3800.00. This may become a runaway train…
10:26 am
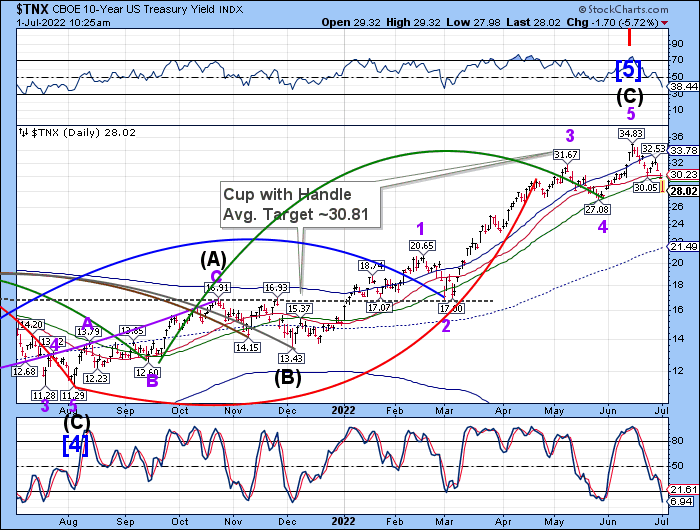
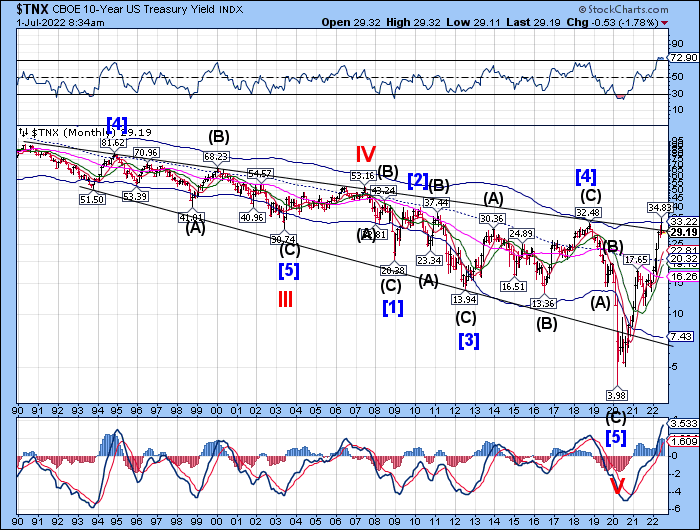
TNX is puking as recession risk soars.
ZeroHedge exclaims, “The 5Y Treasury yield is down 25bps this morning.
Read that again… 25bps!
The entire Treasury curve is re-rating lower as recession risks soar (Manufacturing surveys look ugly this morning)…
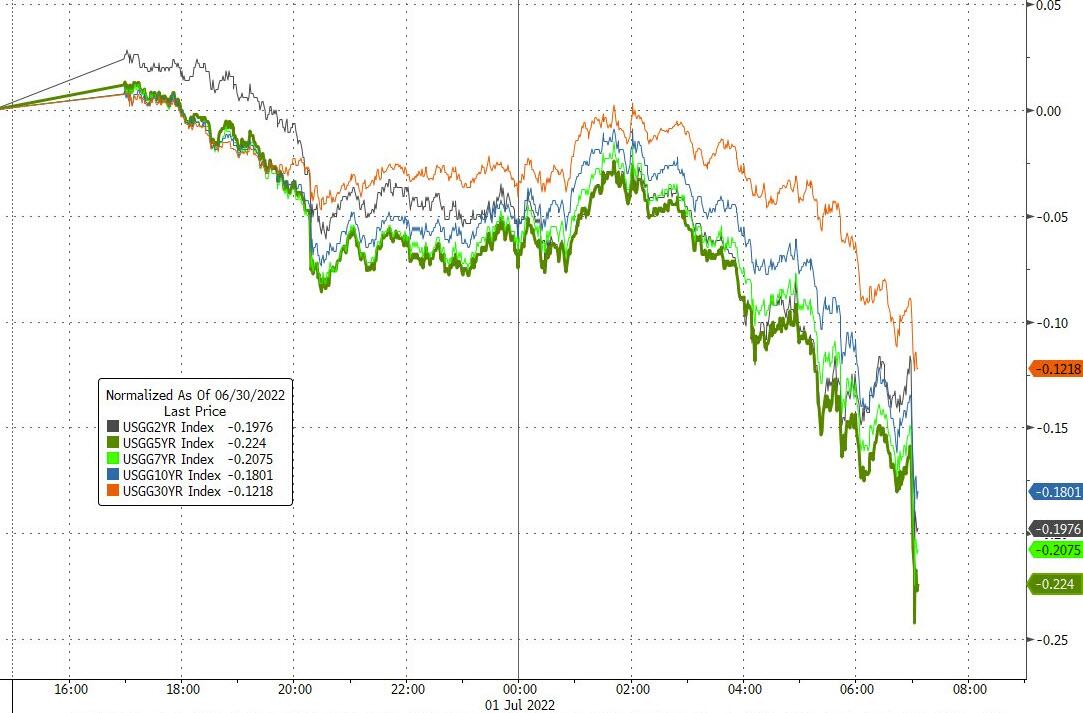
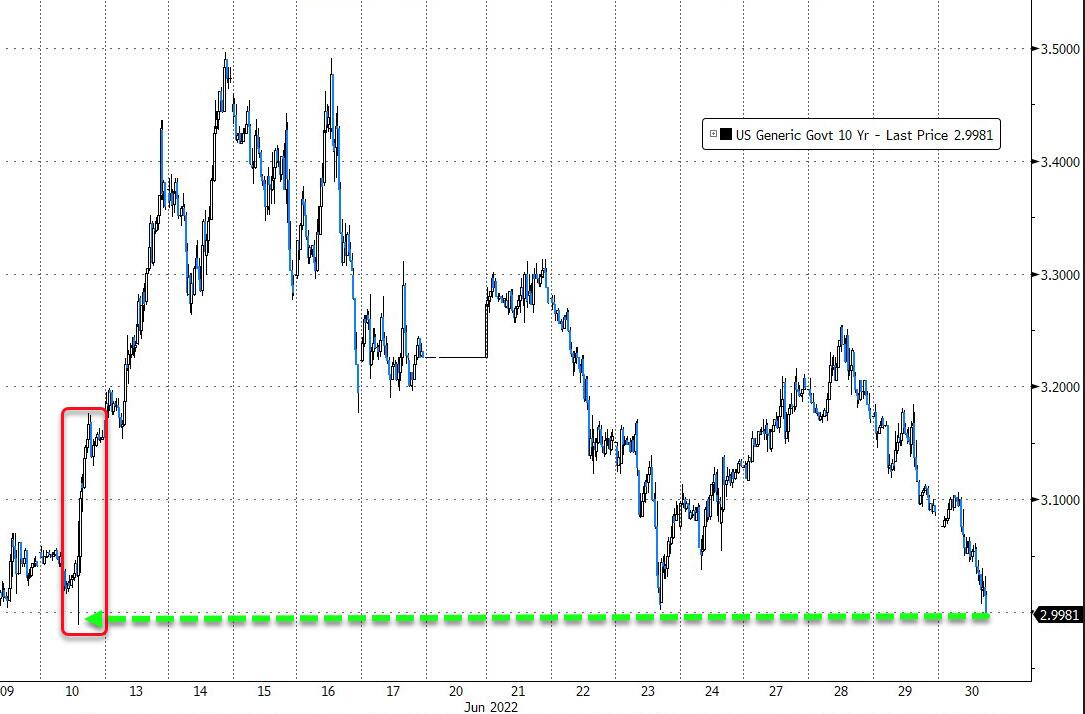
The 10Y yield has plunged below 3.00% – now testing 2.80%… (and 5Y yields are also at 2.80%)
7:35 am
Good Morning!
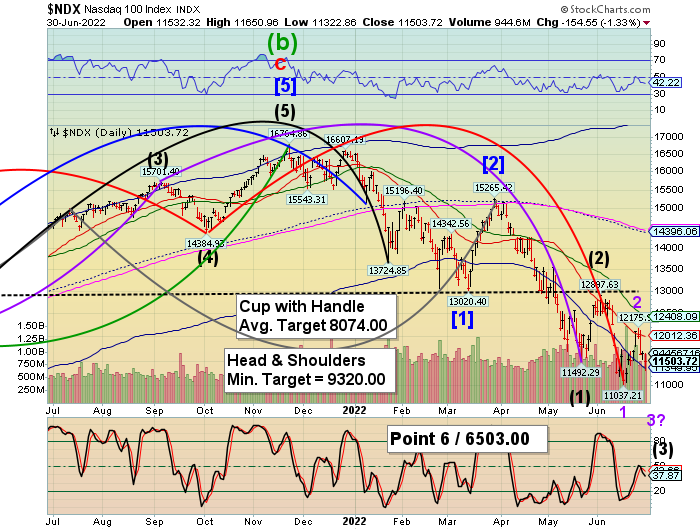
NDX futures declined to 11354.60, testing Cycle Bottom support at 11349.95. It may have started its next Master Cycle decline, aided by short gamma. Today’s op-ex shows options favor calls above 11650.00 while favoring puts beneath 11600.00. While it is difficult to ascertain where short gamma begins due to the light population of puts and calls, it is most certainly short beneath 11500.00.
ZeroHedge (TME) says, “Short gamma pain is back with a vengeance
On Monday we reminded our readers that the dealer positioning with regards to gamma had turned into a sell or sell event (here). Equities have since then sold off sharply and dealers are back into “deep” short gamma territory. This means we are back to the “sell low, buy high” feedback loop, magnifying all moves. Add extremely poor liquidity (here) and you understand p/l pain is back…”

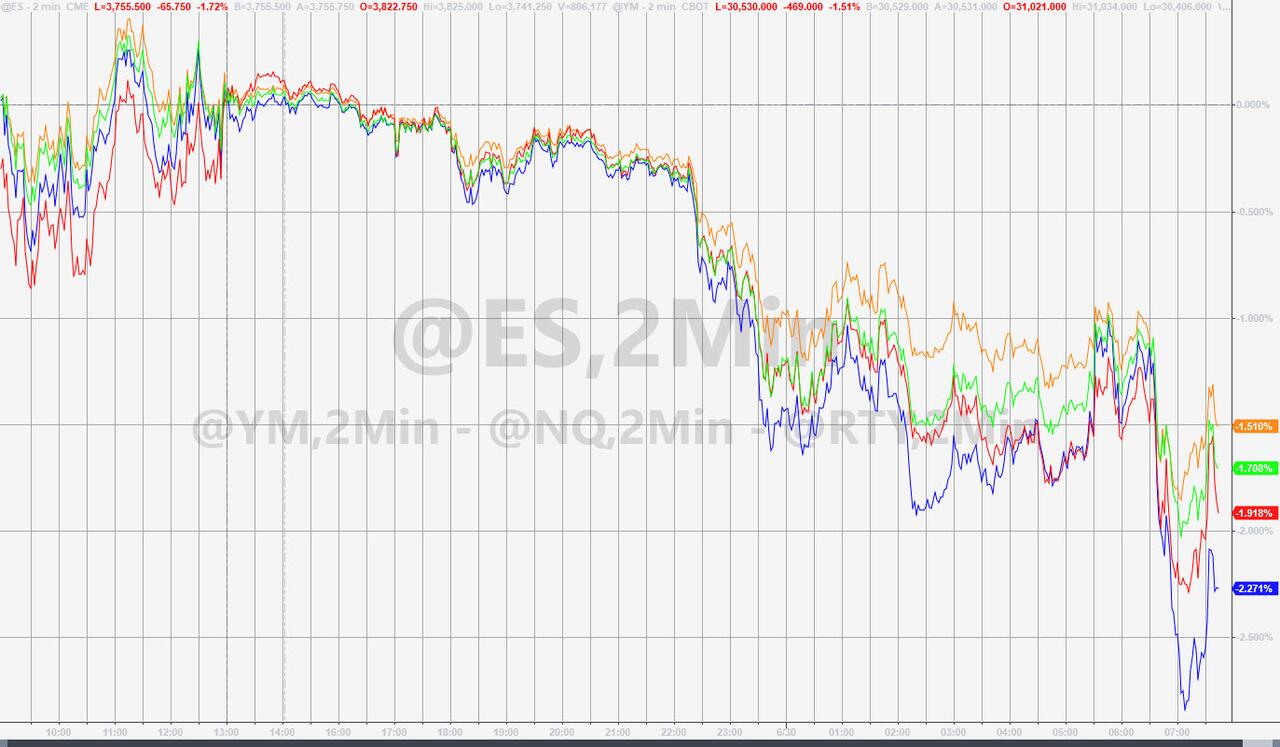
SPX futures declined to 3742.40 thus far, beneath both the 3800.00 resistance line and the Cycle Bottom resistance at 3835.13. It is on a confirmed sell signal beneath the Cycle Bottom. While it may be possible to rally, trending strength points down starting today. The next Master Cycle low appears to be scheduled for the second week of August with a particularly nasty bottom due on the July op-ex (Wave 3?).
In today’s op-ex Max Pain is at 3820.00 with calls dominant above 3825.00. Puts rule beneath 3815.00 with short gamma possible beneath 3800.00. This is forcing dealers to sell low and, should a short squeeze develop, buy high. A nasty conundrum.
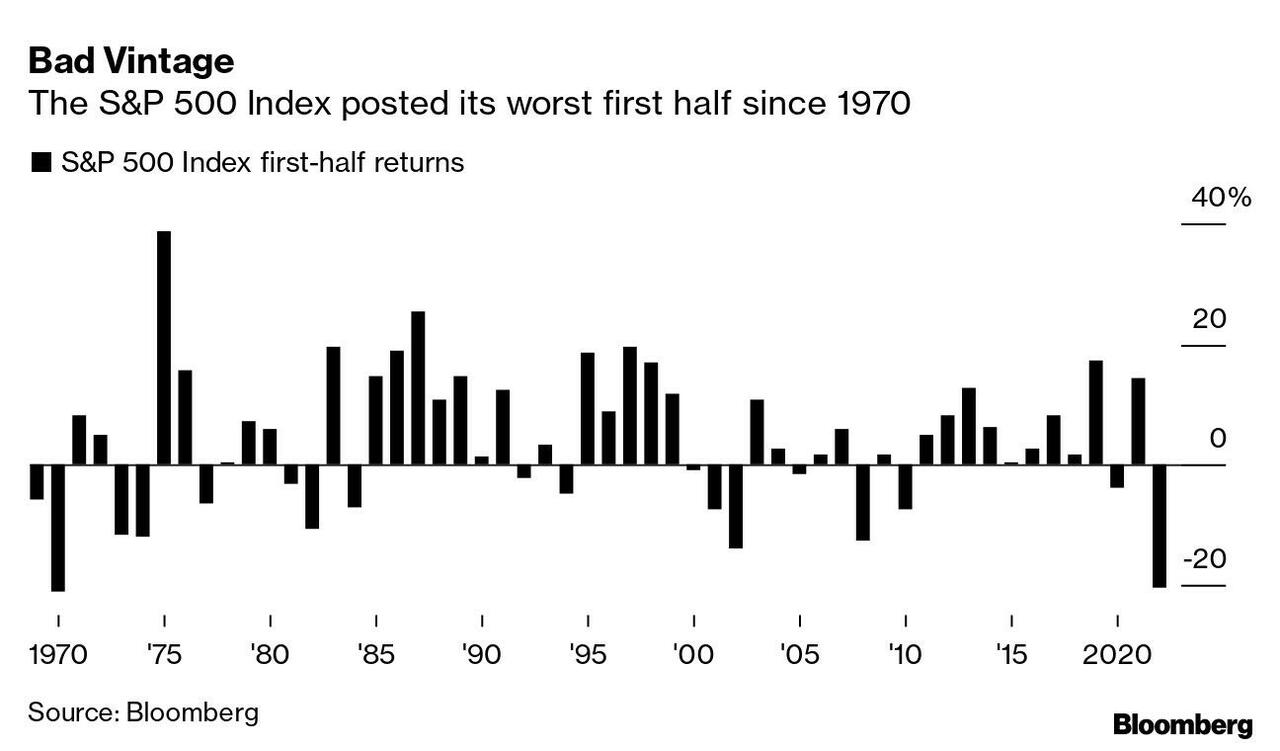
ZeroHedge reports, “As DB’s Jim Reid puts it “if you want the good news this morning it’s that H1 is now finally over. If you want the bad news it’s that there’s not much good news around as we start H2 and US equity futures are already down around a percent in the first few hours of the new half year. ”
Indeed, just when you thoughts stocks couldn’t possibly slide any more after just concluding the worst first half in 52 years…
… and with investor and consumer sentiment at record lows, you’d be shocked to learn that futures and stocks started the new month and quarter by plumbing fresh lows as fears of soaring inflation and tumbling earnings boosted concerns about an imminent recession, and the resulting risk aversion lifted bonds and havens and sent risk sliding. The “Big Short” Michael Burry said we may only be about halfway through the market’s decline…

VIX futures are hovering near the 50-day Moving Average at 28.70. VIX has been herded in a Triangle formation while SPX has been in decline. Whether it is due from investor uncertainty (looking for reasons to buy the dip) or outright dealer manipulation is uncertain. What the Cycles Model is telling us is that trending strength has started on June 29 (its reversal out of the low) and is growing over the next two weeks. In addition, the next Master Cycle low isn’t due until mid-August.
The NYSE Hi-Lo Index has made a new Cycle low at -330.00 yesterday.

TNX has plunged beneath the 50-day Moving Average at 29.90 as a Wave 3 decline in stocks is developing. The Cycles Model shows the decline in TNX gathering strength over the next 1-2 weeks, in sync with SPX. That relationship may develop even more as equities decline over the next several months.
Zerohedge remarks, ” Just when investors were hoping for a month- and quarter-end rebalancing uptick in stocks after the carnage of the last few months, US equity markets are ending the first half of the year on an ugly note with Nasdaq leading the charge lower…
And recession fears have sent the 10Y Yield back below 3.00% for the first time since June 10th’s CPI print…
I just thought you would like to know…
It appears that Cycle Wave I is complete with a breakout above the trading channel in place since before 1990. The initial decline may go to the mid-Cycle support at 20.32. The full retracement may have begun which may occur over the next six months. The 50% retracement value is 19.40. The 61.8% retracement may go to 15.77. If correct, the Fed may reverse course as early as August.
However, should a shallow decline take place (above 21.50), there is a potential that TNX may rise above 53.00 in the fall before the full retracement is underway.