January 10, 2024

12:02 pm

SPX has a potential of one more probe higher, but has possible structural limitations at 4781.00.  Currently the 1987 trendline is near 4763.00-4765.00.  The daily Cycle Top resistance is at 4769.67, imposing its own limitations on the rally.  SPX may have the ability to send one more probe higher today, completing the retracement.

Note:  The 10-year Treasury Note Auction is being held today and the 30-year bond auction will be offered tomorrow.

ZeroHedge observes, “One day after a stellar 3Y auction launched the coupon Treasury issuance for 2024, moments ago we got the sale of the first benchmark piece of paper for the new year, when some $37BN in a 9-Year 10-Month reopening were sold to the public in a generally strong auction.

The auction priced at a high yield of 4.024%, which was a sharp drop from December’s 4.2960 and was the lowest yield since the 3.999% August auction. More notably, the high yield tailed the When Issued 4.019 by 0.5bps. This was the 4th consecutive tailing 10Y auction, and the 11th non-stop through auction in a row (September was on the screws). More remarkably, there have been only 3 stop-through 10Y auction in the past 27 months!”


10:00 am

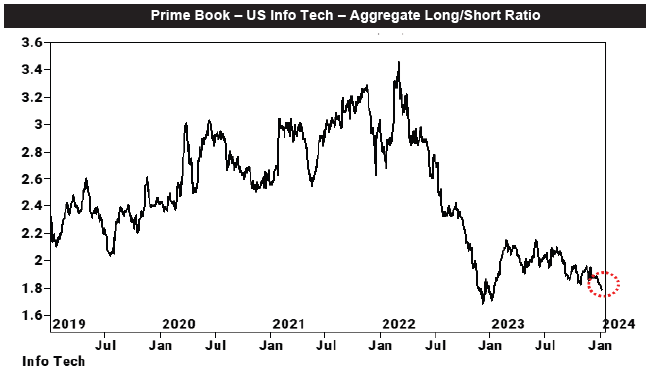
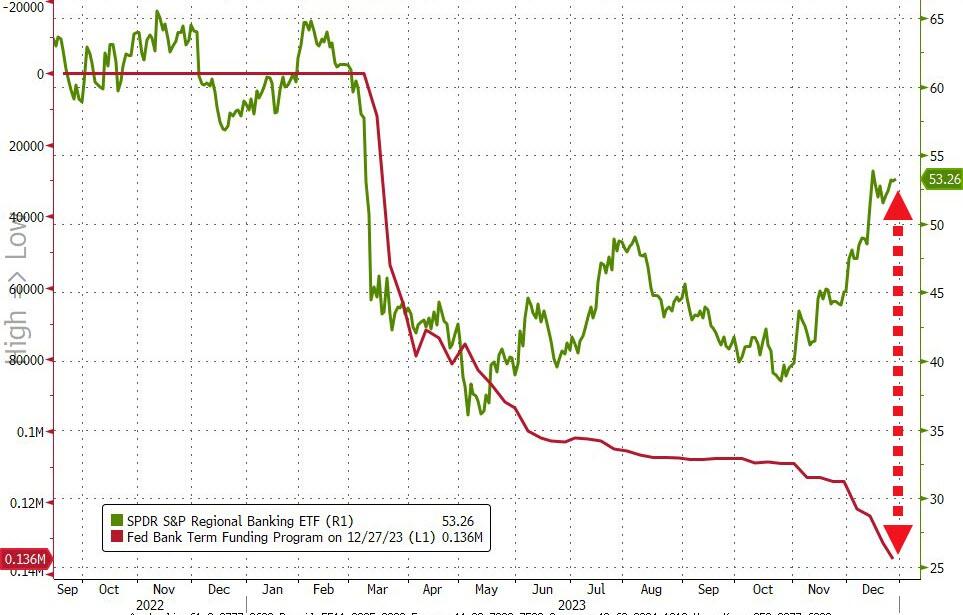
BKX has dropped to the lower end of its one-month trading range.  Should it decline further, a bearish cross beneath its Cycle Top support at 94.57 may produce a sell signal.  Today is day 251 of its current Master Cycle, a week early.  However, should the decline take place, it may confirm the top is already in.  Should the BTFP expire, the Federal tit is removed and banks may have to fend for themselves.  Should rates also rise, the outcome may not be pretty.

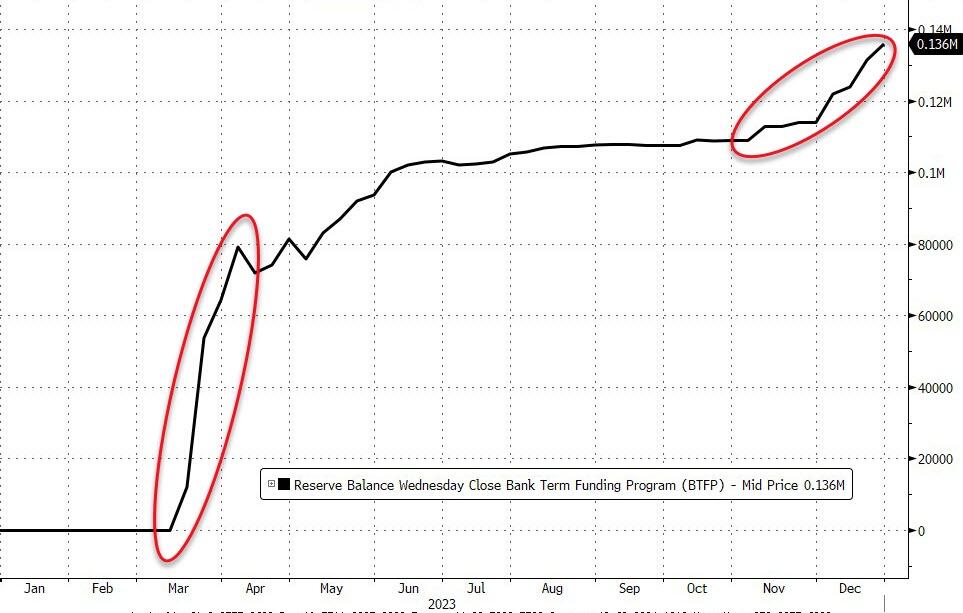
ZeroHedge remarks, “The Federal Reserve is likely to retire the Bank Term Funding Program in March. This would entail an additional ongoing headwind for reserves, and thus liquidity, through 2024. At the margin, this adds weight to the case for the Fed cutting interest rates sooner in the year.

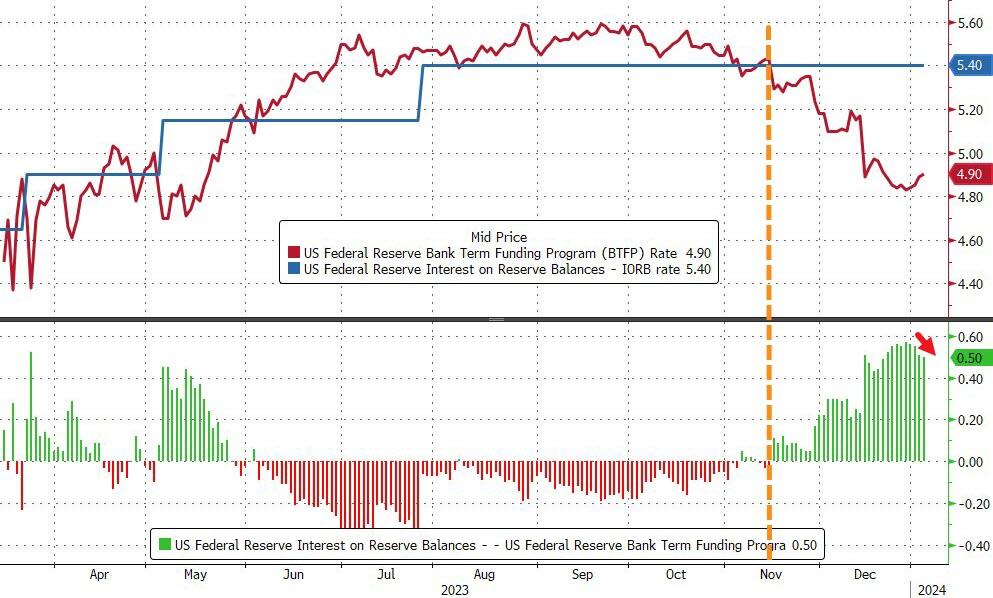
The BTFP was created in the wake of the SVB crisis to help struggling banks get access to liquidity when bond prices were dropping. However, its use in recent months has jumped to over $140 billion. That is not, however, a sign of banking stress.

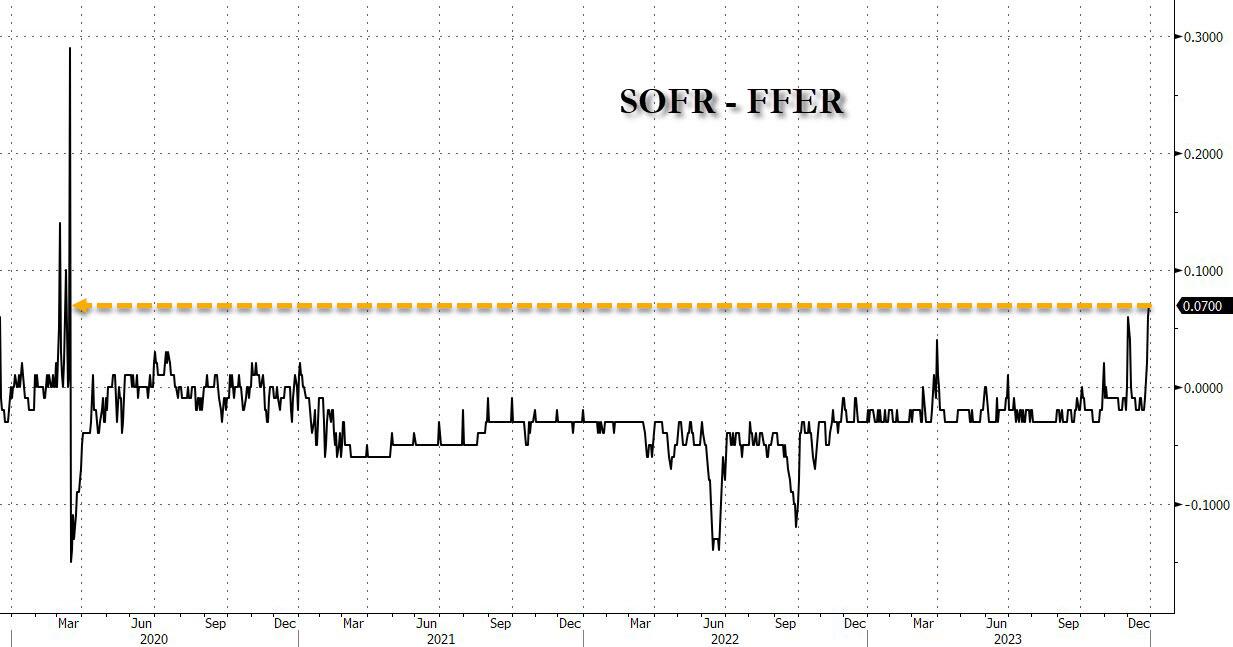
The chart below shows the usage of the BTFP along with the rate paid at the 99th percentile in the fed funds market relative to the upper bound of the range for fed funds.

As can be seen, this is under zero, i.e. banks are not having to pay up to get liquidity.”


8:50 am

Good Morning!

NDX futures remain stalled at the short-term resistance at 16662.27 and a 64% retracement of the first week decline.  Today is day 259 of the (old) Master Cycle, leaving NDX with diminishing capabilities of a new all-time high.  Should the decline resume, it may do so with an increased intensity as momentum factors are increasing.

Today’s options chain shows Max Investor Pain at 16725.00.  Long gamma may begin at 16750.00 and short gamma starts strong at 16720.00.  Dealers may be fighting a negative tape today.

ZeroHedge remarks, “Market narratives have been around for ages. However, the internet and, more recently, social media allow narratives to spread much quicker. Accordingly, they have become more frequent and potent market forces. Following economic data, corporate earnings, politics, global affairs, and many other factors are still crucial for investors. But equally important, especially over short periods, is identifying which narrative(s) most heavily impact markets. Today’s popular narrative is a growing consensus for the Fed to engineer a soft landing and a Goldilocks economy. It’s worth appreciating the Fed and Jerome Powell, purposely or not, started the narrative.

As the fiscal stimulus that drove above-average economic growth in the post-pandemic era exits the system and monetary policy remains very tight, economists and investors wonder what comes next. The scenario rapidly gaining in popularity is the Goldilocks narrative.”


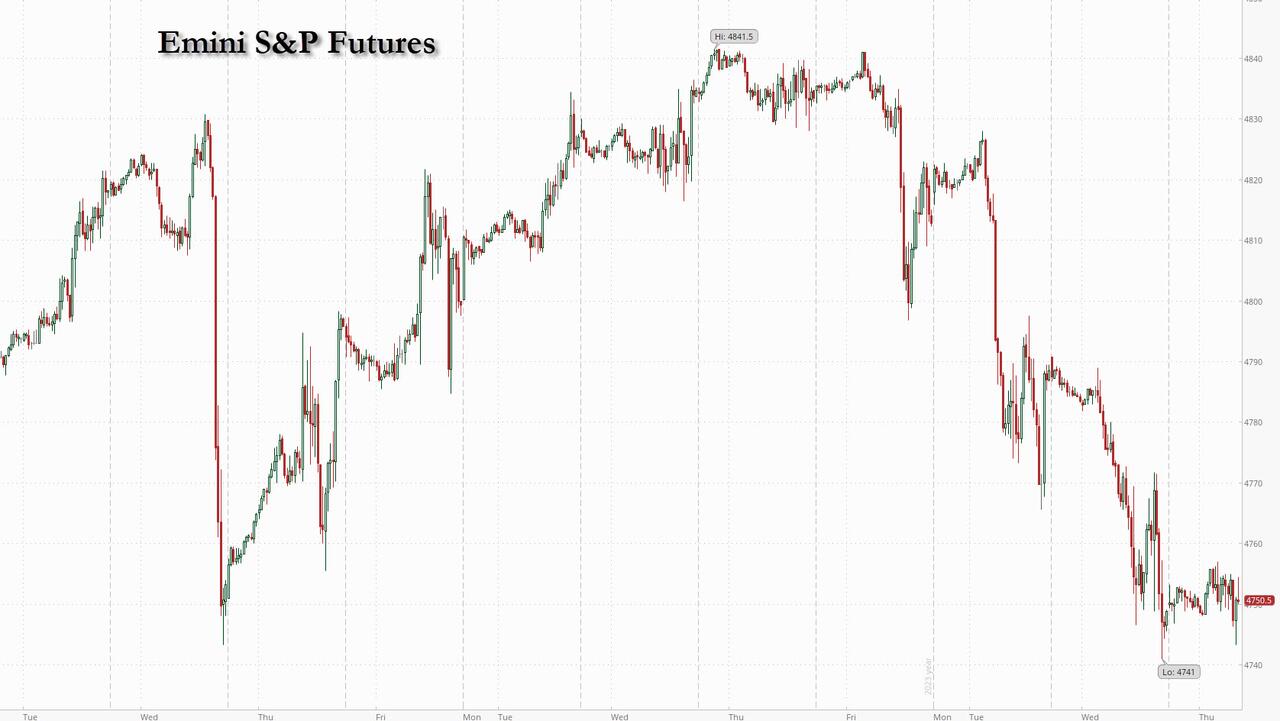
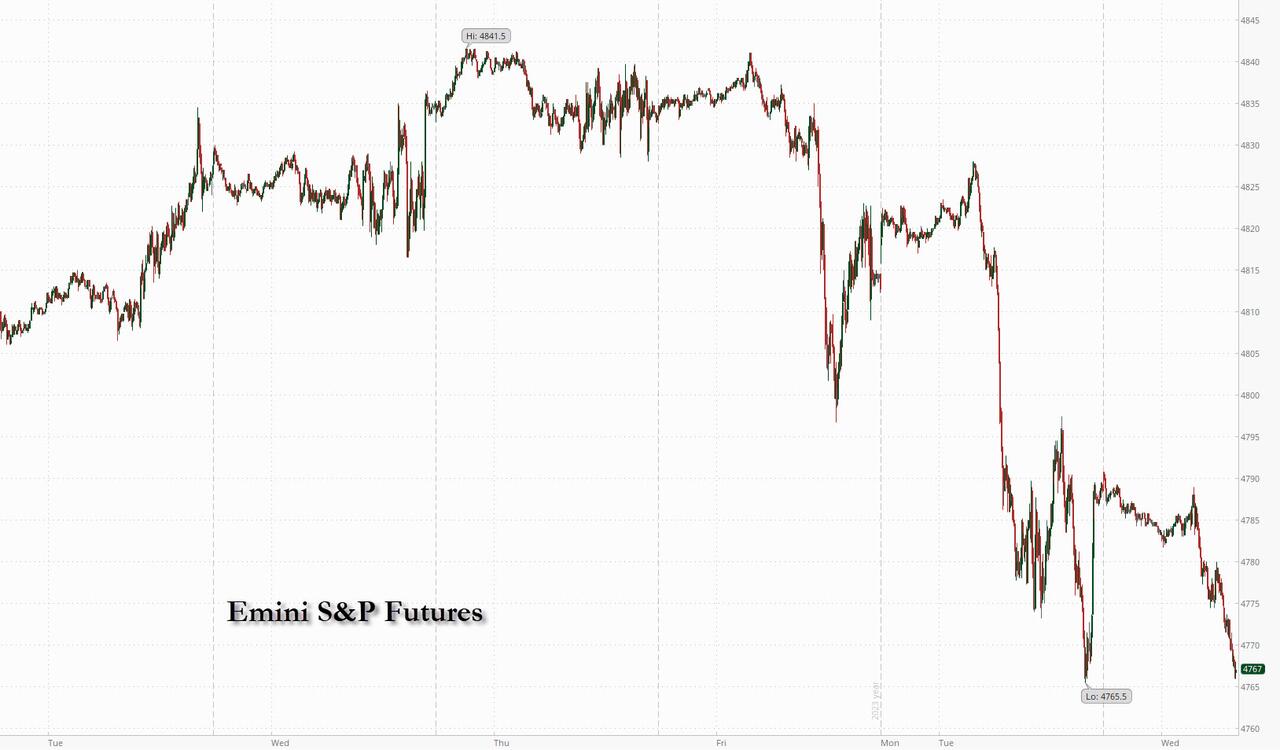
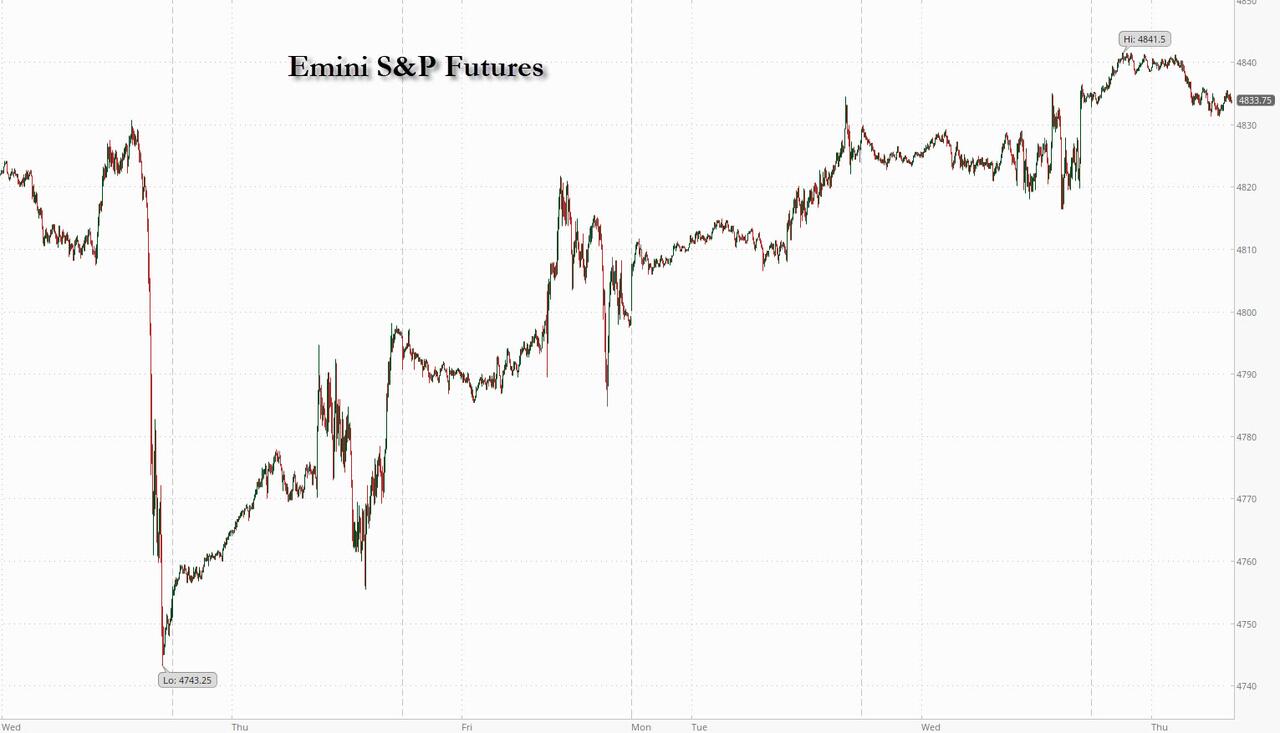
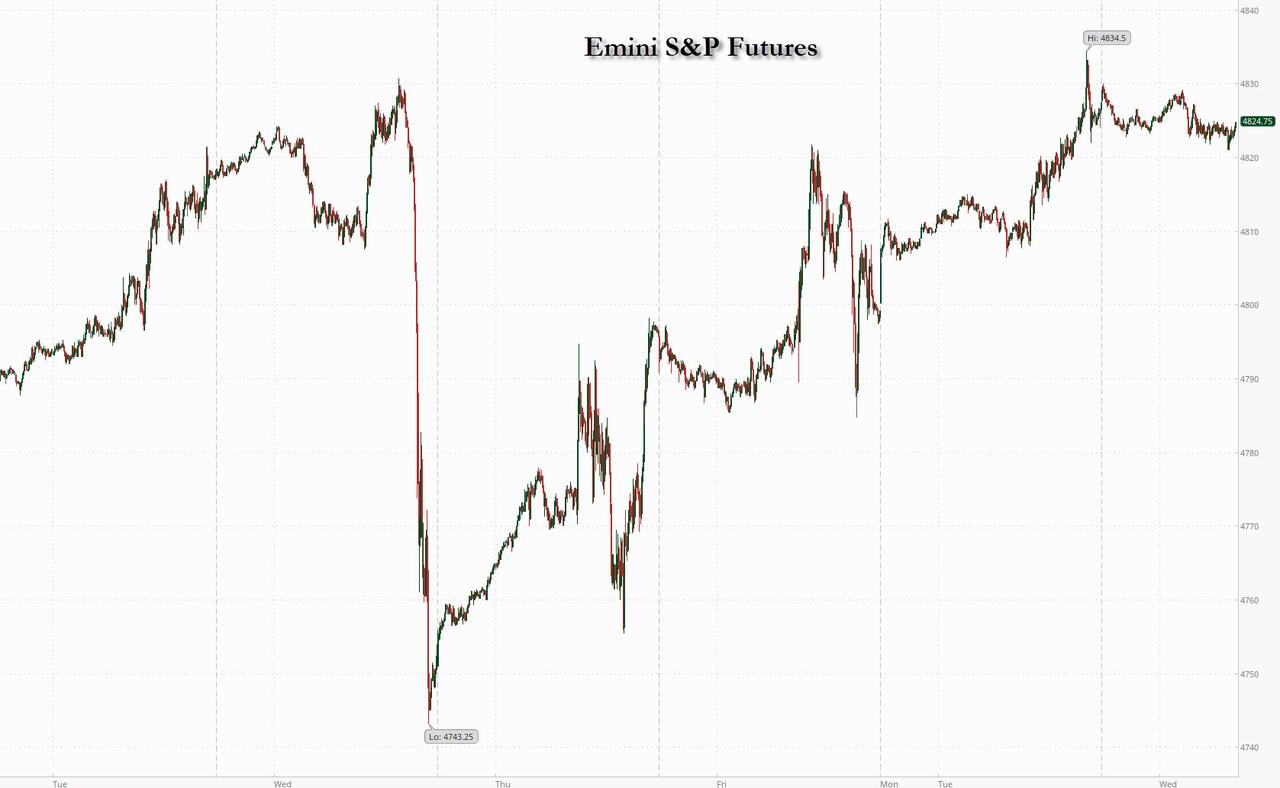
SPX futures remain flat beneath the 1987 trendline at 4765.00.  There was a slight gain yesterday to the 67% retracement value,  also at 4765.00.  We canot rule out the potential for another probe higher, but the old Cycle is winding down with less and less capability to forge higher.  On the other hand, should a reversal take place today, the Cycles Model suggests a potential for a panic decline over the next week.

Today’s options chain shows Max Pain from 4745.00 to 4755.00.  Long gamma starts with a 7,520 contract call wall at 4760.00.  Short gamma begins at 4740.00.  Speculation is overwhelmingly bullish.

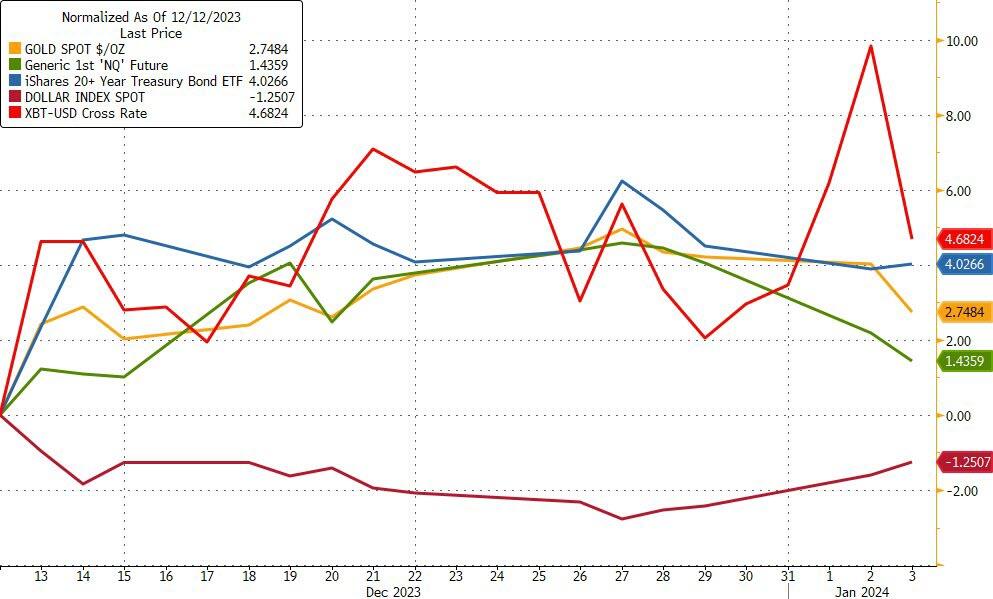
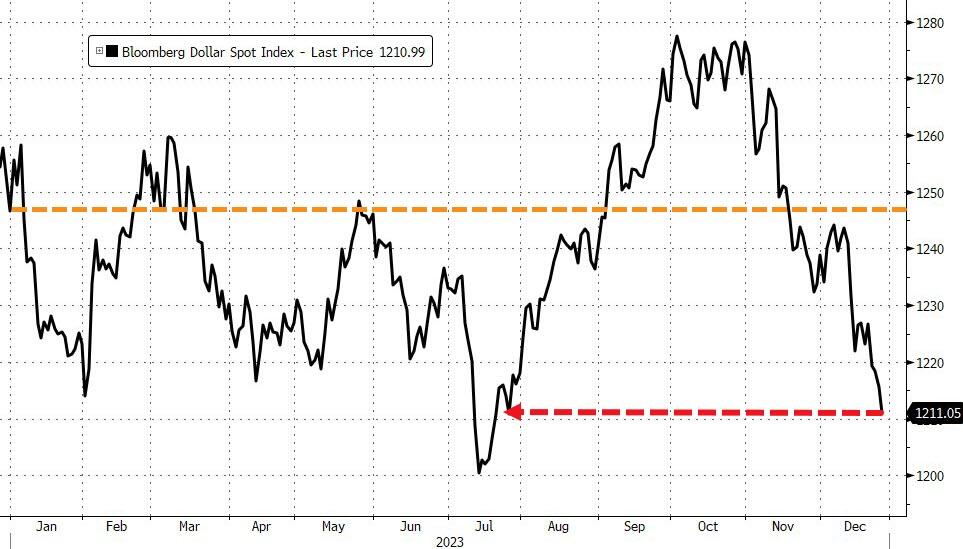
ZeroHedge reports, “US stock futures were unchanged, trading in a narrow range and shifting between modest gains and losses, as investors clung to the sidelines ahead of a key US inflation report. As of 7:50am, Nasdaq 100 futures gained 0.1% while S&P 500 index futures were little changed. The Treasury 10-year yield crept back under 4%, before recovering much of the move. The Dollar was also unchanged while the yen tumbled after the latest Japanese wage data confirmed there will be no rate hikes soon, if not ever. Brent crude rose 0.5% and was trading just below $78 a barrel in a choppy session following more attacks on vessels in the Red Sea that could upset both oil supplies and trade flows. Bitcoin dropped to trade around $45K after a hacked post on the SEC’s X/twitter account prompted large price swings on Tuesday. Today’s calendar is sparse: just wholesale inventories and trade on deck.”


VIX futures are consolidating near yesterday’s low.  Today is day 254 in the Master Cycle and we are looking for a bottom before the week is over.

Today’s options expiration shows Max Pain at 13.00.  There is a small contingent of short gamma at 12.00.  Long gamma starts at 15.00 and runs to 37.00.


TNX is marching the flat line at 40.00 this morning.  Should it succeed in going higher, the neckline at 41.00 may be in its sight.  The 10-year and 30-year auctions will be interesting to watch.  The Cycles Model indicates trending strength to start rising.

ZeroHedge observes, “While not nearly as interesting as the upcoming long-duration 10Y and 30Y auction later this week, all eyes were on today’s sale of 3Y paper as it was the first coupon auction of the year. And despite some erroneous previews at competing publications, the auction was nothing short of stellar.

Pricing at a high yield of 4.105%, down 38.5bps from the December yield of 4.490%, and the lowest 3Y high yield stop since May 2023, today’s auction stopped through the When Issued 4.116% by 1.1bps, the biggest stop through since Aug 2023.

The bid to cover was 2.672, a solid jump from the 2.416 in December, and the highest since September.”


Posted in Published | 5 Comments

January 9, 2024

3:43 pm

SPX is closing right at the cusp of a breakdown after retracing 67% of the first week decline.  This appears to be a one-off event.  As mentioned this morning, it is attempting a close at “Max Pain” at 4750.00.  A close beneath that may result in a decline.  Nearby support is at 4743.00, beneath which short gamma may take hold at 4740.00..


8:15 am

Good Morning!

NDX futures have reversed down to 16534.40 this morning after being repelled by short-term resistance at 16650.00, a 66% retracement.  Today is day 258 of the former Master Cycle.  Thus far, it appears to be early, on December 28.  An early appearance may be followed bay a “shadow high” on the correct day, that is today.

This morning’s options chain is flirting with short gamma at 16600.00.  There is a huge put wall at 16680.00 that may block a further rally.

ZeroHedge remarks, “In retrospect today’s torrid meltup in the Nasdaq, and the MagnifiSeven in particular, was largely preordained following our weekend post that “Hedge Funds and Long-Onlies had Resumed Dumping Tech Stocks At Furious Pace” with the “Largest Selling Since Mid-October.” Of course, in this market which loves inflicting max pain on a daily if not hourly basis, it was inevitable that the one trade which the smart money was rapidly liquidating – in this case the Info Tech Long/Short pair trade…

… would be insta-jammed higher, leading to the best day for the Nasdaq since mid-November.”


SPX futures reversed down to 4739.40 after being repelled by the 1987 trendline at 4765.00.  AS mentioned earlier, we may be watching a “shadow Cycle”  occurring on Day 258.  Barring a further rally, we will leave the Master Cycle high at December 28.

Today’s options chain shows Max Pain at 4750.00.  Long gamma may start at 4755.00 while short gamma starts at 4740.00.

ZeroHedge reports, “US stock futures dropped amid a risk-off tone as Monday’s tech-fueled bounce fizzled and investors turned their attention to this week’s inflation print as well as the start of corporate earnings season. As of 7:40am ET, S&P futures were down 0.3%, and Nasdaq futures dropped 0.5% following European bourses lower. The tech rally in US stocks on Monday came as Nvidia surged after announcing new AI products for personal computers. The Nasdaq 100 jumped the most since November on Monday and the S&P 500 traded near a record high while Japan’s Nikkei 225 index closed up 1.2% — a level unseen since March 1990. Bonds are lower pushing the 10Y yield as high as 4.05% as oil bounced back from the largest drop in about a month on signs of a weaker physical market, including a deep pricing cut by OPEC+ leader Saudi Arabia; Brent traded near session highs around $78. The USD was flat while the yen reversed earlier gains. Bitcoin dipped after surging past $47,000 on bets that the US is set to approve the first spot ETF.”


VIX futures are consolidating beneath the 50-day Moving Average at 13.95.  The Cycles Model calls for the probable uptrend ti become more established at the end of the week.

Tomorrow’s op-ex shows Max Investor Pain at 13.50.  Short gamma is in short supply while long gamma begins at 15.00.


TNX is consolidating beneath its 200-day Moving Average at 40.50 after a brief challenge in the overni8ght session.    The Cycles Model suggests a gathering of strength in the uptrend that may break out early next week.  The uptrend may resume above the Head & Shoulders neckline at 41.00.


USD futures pulled back to 101.83 this morning.  A decline to an estimated 101.00-101.50 may be in store for today.  The rally appears to be a long-lasting one, to early March, as a world-wide decline in stocks and bonds develops.


Posted in Published | 7 Comments

January 8, 2024

11:08 am

BKX, the market’s liquidity proxy, may have made its Master Cycle high on Friday.  Although there may be a few days left in the current Cycle, the retracement structure may be complete.  Evidence of this may be a decline beneath 95.00.

ZeroHedge remarks, “Buried on a Saturday morning, amid the hubbub of politicians and media scrambling to signal their virtue over the 3rd anniversary of ‘January 6’, Dallas Fed President Lorie Logan dropped a couple of tape-bombs that suggest Powell and his pals are ‘worried’ about more than just jobs and inflation.

Notably, prior to joining the Dallas Fed last year, Logan was heavily involved in the financial plumbing of the Fed’s policy mechanism as SOMA Manager at the NYFed, and so her views are going to carry a lot of weight on the FOMC – and the two subjects she discussed point to potential financial stability concerns.

Her first point can be summarized as a concern that:

‘Liquidity is draining (too damn) fast…'”


11:00 am

SPX made an exact 38.2% retracement this morning of last week’s decline.  The decline may resume with considerable strength imminently.  Today may be the start of one of those “limit down” days mentioned on Friday.


7:45 am

Good Morning!

NDX futures dropped to 16222.00 before a morning bounce back to the flat line.  NDX is flirting with a confirmed sell signal beneath Intermediate support at 16296.25.  The next support to fall may be the 50-day Moving Average at 15829.21 as the decline may pick up momentum this morning.

Today’s options chain shows 16300.00-16310.00 being highly contested.  Long gamma may begin at 16340.00 while short gamma may begin at 16200.00.

ZeroHedge remarks, “Late last year, Goldman’s Prime Brokerage, the bank’s most actionable client-facing division which keeps daily tabs on all the latest hedge fund activity and is happy to share the data with a select group of top clients, launched its weekly US Equities Weekly Rundown: a weekly must-read compilation that aims to consolidate the latest positioning and flows intelligence, market themes, and actionable ideas from thought leaders and risk takers across the GS franchise. It is an indispensable piece for every serious trader, and below we excerpt from the latest full report for the benefit of our premium and professional readers (full analysis available to our pro subscribers in the usual place).”


SPX futures declined to 4677.00 over the weekend, then bounced to a near recovery of Friday’s close.  The Cycles Model calls for an intensification of the decline which may start after the opening bell.

Today’s options chain shows Max Pain at 4705.00.  Long gamma begins at 4720.00 while short gamma starts at 4700.00.  Options do not provide insurance.  They simply transfer risk.  At this point the risk is on the dealers who must sell short to cover losses in a declining market.

ZeroHedge reports, “US stock futures dipped on Monday and Treasury yields gained as traders jostled for position in the wake of last week’s selloff coupled with at very confusing jobs report which was strong at the headline level and a disaster when looked closer. As of 7:40am ET, S&P 500 futures declined 0.1% with Boeing retreating almost 8% after a fuselage section on a 737 Max 9 aircraft ejected during a flight over the weekend, leading to another FAA-mandated grounding of the aircraft. Spirit AeroSystems, which installed the panel, slumped 21%. European stocks followed declines in Asia. The dollar was flat, bitcoin reversed earlier losses and and oil slid almost 3% after Saudi Arabia cut official selling prices for all regions amid persistent weakness in the market.”


VIX futures rose to 14.18 this morning before settling back beneath the 50-day Moving Average at 14.09.00This is a good position to accumulate VIX shares and futures as a hedge against falling stock prices.

Wednesday’s options chain shows Max Pain at 12.50.  Short gamma appears to be non-existent while long gamma begins at 15.00.


TNX rose to 40.63 over the weekend after challenging the Head & Shoulders neckline at 41.00 on Thursday.  The Cycles Model suggests a burst of strength may be due today, possibly launching it over the line.

ZeroHedge remarks. “US data from last week were not enough, from the perspective of the economy, to endorse the amount of rate cuts from the Federal Reserve expected by the market.

Payrolls and the jobs data released last week demonstrated why the market – and the Fed – shouldn’t take it too seriously as a real-time snapshot of the labor market.

On the surface, the data was solid next to expectations, but if you go digging you will always find elements to back up a bullish or bearish case.”


Posted in Published | 4 Comments

January 5, 2024

1:31 pm

Today is day 246 in the current Master Cycle for BKX.  You would think there may be another two weeks before a reversal may happen.  However, it is fast approaching the 61.8% Fibonacci retracement at 98.51 which may spell the death knell for this rally.  The Cycles don’t just measure time.  They also measure price.  A Cycle may be lengthened or shortened by its relation to the price target.  Keep that in mind as a very strong burst of energy is due in the banking sector in the next week.

ZeroHedge remarks, “Usage of The Fed’s BTFP bank bailout facility surged by over $5BN to a new record high of $141BN…

Source: Bloomberg

The BTFP-Fed Arb continues to offer ‘free-money’ (and usage of the BTFP has risen by $32BN since the arb existed), but the spread has narrowed a smidge from a peak near 60bps to 50bps today…

Source: Bloomberg

Which will make it hard for The Fed to defend leaving the facility open after March when its “temporary” nature is supposed to expire.”


6:30 am

Good Morning!

I have a morning appointment and may not return until after the open of the Markets.

SPX futures continued their decline to 4672.30 thus far.  Intermediate support lies at 4640.82, beneath which lies a confirmed sell signal.  Intermediate support may not hold, leaving the 50-day Moving Average at 4519.03 as the next possible support.  A word of warning.  The Cycles Model suggests that trending strength may increase substantially starting next week and lasting a possible two weeks.  Trending strength tends to magnify the current trend.  The implication is that we may see one or more “limit down” days during that period.

Today’s options chain shows Max Pain at 4715.00.  Long gamma starts at 4750.00.  Short gamma begins at 4700.00.


VIX futures have ramped up to 14.58, exceeding the 50-day Moving Average and creating a double confirmed buy signal.  The target for this rally may be the March 13 high at 30.81.  Depending on the velocity of the rally, the ultimate target may be much higher.

Next Wednesday’s op-ex shows Long gamma residing between 15.00 and 17.00.  Short gamma has all but disappeared.  Investors are just not prepared for an explosion in the VIX.


TNX futures have risen to a morning high of 40.51, confirming the fears of investors that the rally in treasuries may be over.  TNX has exceeded its 200-day Moving Average, creating a confirmed buy signal for yields.

Posted in Published | 2 Comments

January 4, 2024

11:33 am

SPX may be at the end of a less-than Fibonacci retracement at 30.1%, a very weak rebound from this morning’s new low.  We may see the decline resume with strength within the hour.


7:45 am

Good Morning!

NDX futures have continued to decline to 16340.10 this morning.  It is due for a short-term bounce that may be complete by the end of the day.  The bounce target may be short-term resistance at 16608.00.    However, should NDX continue to decline beneath Intermediate support at 16268.10, the decline may resume uninterrupted.

Today’s options chain shows Max Pain at 16425.00.  Long gamma may begin at 15450.00, but without much conviction to 16475.00 to 16500.00.  Short gamma starts at 16410.00 an remains strong beneath it.

ZeroHedge remarks, “Hard to get excited

JPM’s positioning intelligence team, who nailed the melt up, summing up the view here: “… it’s hard to be excited about the market in the near-term from a positioning standpoint, given how much has changed in the past ~2 months.”

Lot of longs

Positioning is elevated.”


SPX futures are hovering near the low end of yesterday’s trading range.  Normally SPX would have bounced to 4750.00 today.  Instead, the bounce may have truncated at 4729.29 and the decline appears to have resumed to the close.  A gap down at the open may suggest a panic decline may be underway.  If so, the next support may be the 50-day Moving Average at 4511.13.  For most investors, the uptrend is still not broken.

Today’s options chain shows Max Pain (for investors) at 4705.00. Long gamma begins above 4710.00 while short gamma starts beneath 4700.00.  The options market may easily go out of control.

ZeroHedge reports, “After the worst start start to the year in almost two decades – it was just the third time in history that the Nasdaq started the year with back to back 1%+ declines (the other two years were 1980 and 2005) – markets took a breather on Thursday, with US equity futures posting small gains even as they remained toward the bottom of Wednesday session range. As of 7:50am, S&P futures gained 0.1% after swinging between modest gains and losses and supported by the Dec 20 0DTE flash crash lows, while Nasdaq futures were down 0.1%; Treasury yields resumed their ascent, edging closer to 4%, and last trading at 3.95% as part of a bear steepening, potentially a delayed reaction to the higher-for-long message from the Fed. The dollar is higher and the USDJPY is surging to the highest since mid-December, rising above 144, just as everyone was convinced the pair would tumble to 130 next. Commodities are also stronger led by Energy. Today’s macro data focus is on ADP, Jobless Claims, and Job Cuts all ahead of tomorrow’s Nonfarm payrolls which should help shape the macro narrative as we are about to enter Q1 earnings season.”


VIX futures remain flat, but at yesterday’s session high.  A breakout above yesterday’s high and the 50-day Moving Average at 14.22 produces a confirmed buy signal.  The target for this rally may be the March 2023 high at 30.81.

The January 10 options expiration shows Max Pain at 13.50.  There is little short gamma.  Long gamma begins at 17.00 and runs to 24.00.


TNX may be resuming its rally toward the 200-day Moving Average at 40.42.  A confirmed buy signal awaits above that level.  Mid-Cycle support/resistance lies at 40.90.  Above those resistances it may be clear that the decline has ended.

ZeroHedge remarks, “Today we get to see the cherry-picked highlights from The Fed’s ‘Great Pivoting’ in December.


Will they admit what we all think happened? Of course not

Since the ‘dovish’ flip-flop at the last FOMC meeting on December 13th, markets have mimicked ‘the QE trade’ – dollar down, everything else up (led by crypto)…”

Source: Bloomberg


USD futures have slowed their ascent at they approach Intermediate resistance at 102.75.  A pullback near 101.50 may be in order here before the advance resumes.  A good time to accumulate USD shares/futures.  We may continue to see predictions of the Dollar’s demise until it becomes painfully evident that USD is about to become stronger.


Posted in Published | 2 Comments

January 3, 2024

8:25 am

Good Morning!

NDX futures declined to 16423.00 thus far, as it searches for Intermediate support at 16242.00.  A bounce may normally occur at or above Intermediate support.  However, should it decline through that support, the 50-day Moving Average lies at 15738.76 as the next level.  The average target for this decline may be the October low at 14058.30.  WE will monitor the decline to ascertain whether it goes deeper.

Today’s options chain shows Max Pain at 16575.00.  Long gamma may start at 16000.00 while short gamma begins at 16570.00.  Short gamma may rule the day.

ZeroHedge remarks, “The big short is now a big long

What a difference a year makes. Non dealers exposure in US equities is at the highest levels in “forever”.”


SPX futures declined to 4720.50 this morning as larger losses are consolidated.  Overhead resistance is at 4750.00 where the short-term trendline, the 1987 trendline and the Cycle Top all reside.  Should the decline continue, the next level of support is the Intermediate level at 4626.51 beneath which the sell signal is confirmed.  The Cycles Model indicate that the next two weeks may be particularly bearish.  The normal target may be the October low at 4103.78.  However, the decline may go lower.

Today’s options chain shows Max Pain at 4745.00.  Long gamma dominates above 4750.00.  Short gamma reigns beneath 4735.00.

ZeroHedge reports, “The risk off tone that has dominated the 2024 mood so far extended into a second session, and this time in addition to selling in both stocks and bonds, we are seeing crypto join the fray (the reason being attributed to this tweet). US equity futures and global market are experiencing some selling and profit-taking after the recent torrid Santa Rally, as we enter the first of several important macro data days: today the focus will be on ISM Mfg report and the December Fed Minutes. Interestingly, despite the weakness, yesterday’s US session saw a $7.8bn MOC to buy, and in its market intel note this morning (available to pro subscribers), JPM writes that for all the weakness “it does feel like there are buyers below current levels as the SPX struggles to breach 4,800.” That said, as of 7:45am, S&P futures were down 0.4% to 4,765, near yesterday’s session lows; Nasdaq futures dropped 0.7%. Bond yields are higher as we see bonds come for sale alongside stocks globally. 10Y Treasury yields rose to 3.98%, the highest since mid-December and a move above 4% will likely add more volatility to equity markets; the USD extended its gains; Brent jumped to session high around $77, rising form a sub-$75 low after Libya’s Sharara oil field unexpectedly shutdown amid mass protests, removing some 265K bpd in daily output although commodities overall remain mixed on concerns about China’s economy.”


VIX is consolidating beneath the 50-day Moving Average at 14.49.  Yesterday was a wake-up call with the sudden realization that stocks don’t only go up.  A confirmed buy signal lies above the 50-day.

Wednesday’s op-ex shows Max Pain at 13.50.  Short gamma rules between 12.00 and 13.00.  Long gamma resides above 15.00 and runs to 30.00.


TNX rose to 40.08 this morning as rising rates attract attention.  The Master Cycle low on December 27 gave traders a reversal and aggressive buy signal.  Unfortunately, most do not see this as a positive because TNX is beneath the 200-day Moving Average at 40.40.  Once above it, however, investors may take appropriate action.

ZeroHedge observes, “The US Treasury has a morbid habit of revealing big, round numbers of debt around major calendar milestones, and the new 2024 year was no different because according to the latest Treasury Daily Statement published after the close today and reflecting the US Treasury’s financial statements as of Dec 29, 2023, total US debt as of the end of the year was – drumroll – just over $34 trillion for the first time ever, or $34,001,493,655,565.48 to be precise.

Since this is a topic we have covered more or less daily for our 15 year existence, we don’t need to say much suffice to show a chart of total US debt since zerohedge launched in Jan 2009, when total US debt was only $10.6 trillion. We sure have gone a long way since then.”


USD cash may be approaching Intermediate resistance at 102.82 after exploding out of its Master Cycle low on December 28.  It is on an aggressive buy signal with confirmation of its buy at Intermediate resistance.


Posted in Published | 3 Comments

January 2, 2024

2:24 pm

BKX, our liquidity proxy, may be attempting to make the 61.8% Fibonacci retracement at 98.51.  Today is day 243 in the current Master Cycle, which allows a few more days of rally either until something breaks or quarterly earnings begin reporting the week of January 8.

ZeroHedge observes, “n a non-seasonally-adjusted basis (why adjust when we are looking at annual changes), US domestic banks saw a stunning $1.17TN in deposit outflows (ex-large time deposits) in 2023 – the largest annual decline ever (and only the 3rd annual decline on record going back to 1985 – 1994, 2022, and 2023)…

Source: Bloomberg

Interestingly, money-market funds saw inflows of around $1.15TN almost perfectly mirroring the deposit exodus from banks…”


2:07 pm

SPX has declined both below the 1987 trendline and the diagonal trendline that defined the lows in the year-end rally, both at 4750.00.  It also declined beneath the Cycle Top at 4742.94.    Today is day 251 in the Master Cycle.  Although early, SPX has also met its structural high, leaving a truncation in place.   While not attaining the January 2022 high, both time and price targets may have been met for this rally.   An aggressive sell signal may have been made,  Aggressive signals are those that are often (1) short-term, awaiting confirmation, (2) may be early, allowing attempts at higher highs or lower lows, (3) subject to volatility where gains/losses appear uncertain.   However, aggressive moves tend to prove out over time and allow a greater gain on a new position.


9:15 am

Good Morning!

I had originally intended to put the long charts up last night, but family events took precedence.

DJIA futures declined to 37463 this morning, indicating a potential reversal.  Cycle Top support is at 36985.00.  A decline beneath that level gives us an aggressive sell signal.  The traeding bands have narrowed considerably, suggesting a probable slingshot move to the October 2022 low.  Note that the Indu rose above its Cycle Top in 2021 but further advances were stopped by the 1987 trendline during 2021.  It has stayed beneath the trendline and Cycle Top resistance until December 2023 in a final probe called a throw-over.  The Industrials are favored by international investors due to their liquidity and stability.

INDU futures remain above  the Cycle Top support at 36985.06.  A decline beneath that level produces an aggressive sell signal.


The SPX was also able to rise above the 1987 trendline in 2021, but fell back beneath it in April 2022.  It has met a double resistance at 4750.00 and the Cycle Top at 4815.00.  SPX has not been able to crack the 2022 ceiling due to these resistances, but the structure suggests a completed uptrend.  This may be called a truncated rally where it had structurally weakened to be unable to make a new all-time high.  The SPX is favored by domestic institutions for its liquidity, but has fallen out of favor recently due to weakened performance and overperformance of the seven largest NDX stocks..

SPX futures fell beneath the 1987 trendline at 4750.00 to 4732..00 thus far.  This produces an aggressive sell signal on the weekly chart.  We will follow the daily chart from here on, but this picture substantiates the necessity for a reversal here.


NDX has remained above its 1987 trendline for all of its existence, attracting retail investors and hedge funds.  The Cycle Top is at 17068.  The NDX rose to within 100 points of the Cycle Top but was unable to reach it.

NDX futures have fallen the most of all the indices, breaking the diagonal trendline for an aggressive sell signal and nearing its first short-term support at 16451.00.  Confirmation of the sell signal lies beneath Intermediate support at 16243.00.

ZeroHedge says, “Not Buying The Dips Here… Yet.”


VIX futures have reached a morning high at 14.23, short of a confirmed buy signal at 14.50, where we find the 50-day Moving Average.  The VIX made its Master Cycle low on December 13 and has remained above it since.  Investors have steered clear of it because of its historically low level.  However, it  may be at a good accumulation level, nonetheless..


TNX continues to advance from its Master Cycle low made on December 27, day 252 of its Master Cycle.  Today is day 258.  The chances of a deeper low are diminishing by the day.  The Buy signal resides at the 200-day Moving Average at 40.37.


Posted in Published | 4 Comments

December 29, 2023

12:46 pm

SPX has declined to the convergence of the short-term trendline and the 1987 trendline.  A break beneath the double trendline offers an aggressive sell signal.  One should not own stocks beneath that point.  The first confirmation is at the short-term line at 4698.96 (4700.00), another aggressive confirmation.  Take advantage of these supports to unencumber yourself of any longs.  Shorts may be taken at those points, as well.  When the liquidity spigot closes, we may see a “no bid” event.

ZeroHedge remarks, “Over a month ago (and well before the Fed’s “shocking” dovish pivot) as the Fed’s Overnight Reverse Repo tumbled below $900 billion for the first time since June 2021 amid a growing debate of where and when the Fed’s reserve scarcity constraint will be hit, we warned that liquidity is rapidly approaching the reverse repo constraint level which could emerge as soon as the RRP facility dropped to $700 billion, at which point the market’s all-important credit plumbing will start to crack”

ZeroHedge further observes, “Earlier today, when discussing the sudden spike in the SOFR rate to an all time high 5.40% and which dragged the SOFR-Fed Funds spread to the highest since the March 2020 repo crisis…

… we said that “two factors are the likely culprits: the year-end liquidity crunch, and the recent sharp increase in the Fed’s reverse repo facility, which has increased from a multi-year low of $683 billion on Dec 15 to yesterday’s $830 billion, and which STIR strategists expect will shoot up above $1 trillion in today’s final for 2023 reverse repo operation as a whopping $300+ billion in short-term liquidity in pulled from markets in just days.”


9:30 am (short session)

SPX futures attempted a new high by briefly reaching 4795.30, but fell back to a flat position.  The cash market high has been 4793.30 thus far.  The rally formation is complete, or nearly so.  Today may remain flat on weak volume as the book for 2023 is closed for many.  The rising trendline and the 1987 trendline bot reside at 4750.00.  An aggressive sell signal lies beneath them.  The Cycle Top resides at 4732.30 which may confirm the sell signal.

Today’s options chain shows 4780.00 is hotly contested and offers the Max Pain.  Long gamma starts at 4800.00 while short gamma may begin at 4775.00.

ZeroHedge reports, “US futures once again flirted between gains and losses on the last trading day of the year, but with the all time high in the S&P just 0.3% away, it is virtually guaranteed that the script calls for a new record to close out 2023 because that’s how centrally-planned markets work. And who knows, maybe this time BIden’s approval rating will actually increase; after all that’s what all of this is about.”


VIX futures consolidated inside yesterday’s trading range, without the energy to break up or down.  However, it has completed its first positive hourly Cycle since the Master low on December 13.  The new Master Cycle may extend to mid-January with an upward bias.

Wednesday’s options chain shows Max Pain at 13.50.  An 11,000 call contract at 11.00 negates the potential short gamma.  Long gamma otherwise begins at 16.00 and extends to 30.00.


TNX opened higher this morning, putting more distance from its probable Master Cycle low on December 27th.  There are multiple indications that yields have stopped going lower.

ZeroHedge remarks, “It’s only appropriate that a year which saw 10Y rates soar above 5%, the most in 16 years, before sliding on fears of an imminent recession and/or Fed easing cycle, that the final coupon auction of the year was a dog with a capital D.

Yesterday’s far stronger than expected 5Y auction surprised many: not only was there no concession with yields tumbling all day, but there was no tangible reason for the burst in demand that lead to one of the strongest stop-throughs on record, besides perhaps a big squeeze overhang as shorts sought to cover in the year’s last trading hours. Well, moments ago we did get confirmation that yesterday’s strength was indeed technically-driven because the $40BN in 7Y paper that was just sold by the Treasury could be described by just one word: ugly.”


BKX continues to hover near its retracement high.  As noted, TNX is beginning to rise, indicating that liquidity may be drying up.  Should that be the case, a decline beneath the Head & Shoulders neckline may be imminent.

ZeroHedge notes, “Usage of The Fed’s bank bailout facility rose by another $4.5BN last week to a new record high of $136BN…

Source: Bloomberg

But Regional bank shares don’t care…”


The Ag Index made its Master Cycle low on December 21.  There is no visible buy signal except the Cycle low.  Overhead resistance is at 395.98, beyond which lies a confirmed buy signal.

ZeroHedge observes, “The war in Ukraine has transformed parts of the Black Sea into a conflict area. Commercial vessels transporting agricultural goods from the ‘breadbasket of Europe’ have been caught in the crossfire.

The latest maritime incident occurred on Wednesday when a Panama-flagged bulk carrier struck a mine in the Black Sea while sailing to a port on the Danube River to load grain, according to Reuters.

“A Panama-flagged civilian vessel was blown up on an enemy sea mine in the Black Sea … The vessel lost its course and control, and a fire broke out on the upper deck,” Ukraine’s southern military command said on Telegram.”

For those with a sweet tooth, ZeroHedge remarks, “Cocoa prices Wednesday hit $4,285 per ton in New York, the highest level since 1978, as the outlook of poor crop harvests across West Africa has been a major bullish factor pushing prices higher this year. There is also an increasing risk that El Nino-induced weather disturbances could cause the global cocoa market to sink into a deficit for the third year.”


On the other side of the world, shortages lurk.  ZeroHedge reports, “On Wednesday, the Thai Rice Exporters Association revealed that the price of Thai white rice 5% broken, a key Asian benchmark, reached a new 15-year high. This surge is mainly attributed to increasing fears of a global shortage due to the damaging effects of the El Nino weather phenomenon on Asian farmlands and India’s recent decision to restrict certain rice exports.

Thai white rice 5% broken hit $659 a ton, the highest level since October 2008. Prices of the staple food that feeds billions of people worldwide are up over 50% since the start of 2022. ”


Posted in Published | 5 Comments

December 28, 2023

10:20 am

BKX is still hovering near its December 14 Master Cycle high.  It has been 9 market days since its high.  A sekl signal may be found beneath its Cycle Top at 92.41.  Be alert since a reversal may be imminent.

TheEpochTimes observes, “It has been nine months since the spectacular and sudden collapse of Silicon Valley Bank. After witnessing three of the four largest bank failures in U.S. history in 2023, the attention of the media and the markets has turned elsewhere. Banking crisis? It is as though it never happened. Having fallen by some 40 percent in March, the NASDAQ Bank Index has recovered to within 15 percent of its high from February. In the last few months, nearly all markets have gone on a bull run, including bank stocks. Yet, and despite the relative quiet, the banking sector is not in great shape. Here are some of the reasons why.”


8:00 am

Good Morning!

NDX futures have made a new all-time high at 16970.40.  It is nearing 17000.00, a significant round number resistance.  The energy needed to overcome this resistance may be more than this already overbought index can summon.  At the same time the rally structure is complete, or nearly so.  The trendline underlying the rally is at 16850.00, beneath which an aggressive sell signal may lie.  The lie being promoted by Wall Street is that a soft landing may be engineered by the Fed.  Is Goldilocks back?”

Today’s options chain show possible Max Pain at 16880.00.  There is no evidence of short gamma.  Long gamma begins at 16890.00.

ZeroHedge remarks, “Guess that’s why the call it a bull

1. Dow Jones Industrials closed at another all-time high and has traded green in 12 of the last 14 days

2. S&P 500 is on track for its 9th consecutive green week, which would be its longest winning streak in 20 years

3. Mega Cap Tech Stocks continue surging as the Nasdaq 100 hit an all-time high. IUXX is on track for its best year since 1999.”


SPX futures reached a high of 4797.10, approaching round number resistance at 4800.00 and the all-time high at 4818.62 made on January 2, 2022.  While the Dow Jones Industrials have made a new all-time high, the Dow Transports and SPX have not.  Dow Theory posits that, unless the SPX and Transports make new all-time highs, this rally remains unconfirmed and subject to a reversal.  Similarly, the Nasdaq Composite Index, a broad-based index, does not confirm the NDX new all-time highs.

The rising trendline and the 1987 trendline both reside near 4750.00.  Should the SPX decline beneath that level, an aggressive sell signal may be made.

Today’s options chain shows Max Pain at 4780.00.  Long gamma starts at 4800.00 while short gamma may begin at 4775.00.

ZeroHedge reports, “The relentless Santa rally can’t stop, won’t stop, and while S&P futures swung between modest gains and losses, Nasdaq 100 index futures edged higher yet again to record-er highs, putting the tech-heavy index on track for its best year since the dotcom bubble burst, as US equities are set to close out 2023 at all-time highs amid optimism the Powell Fed is poised to boost Biden’s re-election campaign by cutting interest rates as soon as March despite sticky inflation, a sturdy labor market with near record low unemployment and an economy which, according to Goldman, is about to ramp up again. As of 7:50am, Nasdaq futures, already at an all time high after soaring a blistering 55% this year, the most since the pre-dot com bubble 1999 – rose another 0.2%, while S&P 500 contracts were little changed after the benchmark edged within just 0.3% of its record high from January 2022. After inexplicably tumbling yesterday, bond yields have reversed some of the sharp move lower, spawned by the relentless slide in the dollar as the market is now convinced the Fed will cut more than 6 times next year to smooth Biden’s reelection. Oil extended losses because of continued CTA selling, while bitcoin reversed yesterday’s gain.”


VIX futures hovering near yesterday’s low at 12.37.    VIX is in its accumulation phase, an ideal time to buy (aggressively) before a recognizable breakout.

Next Wednesday’s op-rx shows a huge call wall at 11.00 with active call interest to 24.00.


USD futures made a new low at 100.31 this morning on day 258 of the Master Cycle.  Today or tomorrow may be the end of the decline of the USD.

ZeroHedge observes “What could the difference of a couple of quarters make to the overall year’s scorecard?

Well, a ton, if you are sitting in the currency markets.

Only a handful of currencies had managed to eke out a gain against the dollar in the first half:”


Posted in Published | 4 Comments

December 27, 2023

9:40 am

On of the biggest beneficiaries of the Fed largesse is the banking sector.  At the end of October BKX was threatening to break through the neckline of a 4-year wide Head & Shoulders formation near 71.00.  Banks are scrambling by laying off employees and cleaning up their portfolios while conditions are eased.  Interest rates are due to start rising again after the first of the year, which may reveal how poorly prepared the banks may be.

ZeroHedge remarks, “The collapse of three US regional banks – First Republic Bank, Silicon Valley Bank, and Signature Bank – marked some of the largest failures in the banking system since 2008. Central banks contained the “mini-crisis” earlier this year with forced interventions and the mega-merger of Credit Suisse and UBS. Despite the interventions, global banks still axed the most jobs since the global financial crisis.

A new report from the Financial Times shows twenty of the world’s largest banks slashed 61,905 jobs in 2023, a move to protect profit margins in a period of high interest rates amid a slump in dealmaking and equity and debt sales. This compared with the 140,000 lost during the GFC of 2007-08.”


8:15 am

Good Morning!

NDX futures consolidated under the all-time high this morning.  Usually a key reversal such as the one we witnessed last week would have been the end of the line for the rally.  However, it did not break the uptrend, allowing the NDX to go even higher.    The trendline is near 16800.00 which, if broken, may begin the decline.  Recent information shows that the 0DTE investors having a hand in this rally is an urban myth.  Retail investors have been absent from this rally thus far.

Today’s options chain shows Max Pain at 16920.00.  Long gamma may begin at 16930.00 while short gamma begins at 16910.00.  Large investors are taking positions against the rally.  It may be to “protect” their profits but may be a spark for a reversal.

ZeroHedge remarks, “That perfect storm

A tsunami of capital has been competing for stocks in December. Buybacks, equity inflows, CTAs and hedgies. SPY has drawn around $40 billion in inflows in December, on track for the biggest monthly haul since it began trading in 1993.

Source: FactSet

Elevated positioning

ETF flows, vol target, CTA and CFTC components are all at elevated levels.”


SPX futures are also consolidating near the highs.  SPX is  in a throw-over formation, usually associated with a final push in an uptrend.  As mentioned earlier, large, liquid institutions are dominating the rally to date.  They are also building their hedges, waiting for retail investors on which to offload their books.  The next target is the January 2022 high that may be taken with lots of fanfare to incentivize the retail investors to join the party.  There remains an overhead resistance at 4795.00 that may have the potential of stopping the rally.  Keep an eye on that level.

Today’s op-ex shows max Pain at 4755.00 to 4765.00.  Long gamma may begin at 4780.00 to 4800.00 while short gamma may start at 4740.00.

ZeroHedge reports, “US futures were flat in muted trading following yesterday’s gain which pushed the S&P to within fractions of an all-time high amid trader hopes that the Federal Reserve is getting close to cutting interest rates, even if it means sparking another violent bout of inflation. As of 8:15 am, futures on the S&P 500 and the Nasdaq 100 indexes flirted between small gains and losses; after rising 0.4% on Tuesday, the S&P is heading for a seven-week winning streak and resides within 0.5% of the record high reached early last year. 10Y yields slumped to session lows around 3.842%, down 5 bps from Tuesday’s close, while Brent also dipped about $1, sliding below $80.”


VIX futures are testing yesterday’s low.  It may hold, even though bottom support is at 12.76.  VIX may be due for a burst of trending strength today as shown in the Cycles Model.  VIX is on an aggressive buy signal.  Aggressive signals come early in a trend and are subject to blow-back.  If held with patience these signals may produce the best results.

Today’s options chain shows virtually no short gamma.  Long gamma starts at 13.00 and extends to 24.00.


TNX futures have declined to 38.37 thus far.  There appears to be a concerted effort to re-liquify the markets by keeping rates low.  Today is day 252 of the Master Cycle leaving about a week in which yields may fall.  The reason may be that the Treasury auction schedule shows no bond being sold for the balance of 2023.  The five year and seven year notes are on the block in the next two days.  This may artificially increase demand for the 10-year notes and 20-year bonds.

ZeroHedge observes, “Despite resilience in US data, 30Y Yields have plunged back below the 4.00% Maginot Line this morning…

Source: Bloomberg

The last few weeks have seen US macro data reverse its recent trend of disappointment…”


Posted in Published | 2 Comments