December 26, 2023

8:45 am

Good Morning!

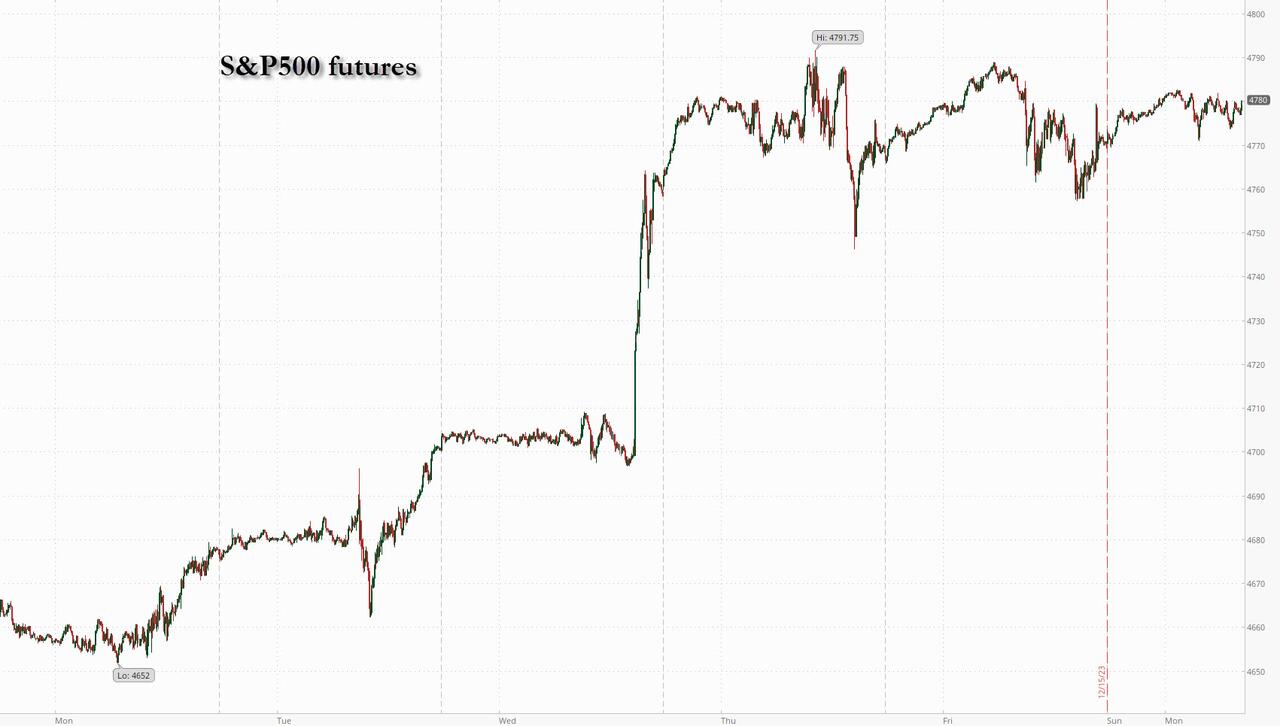
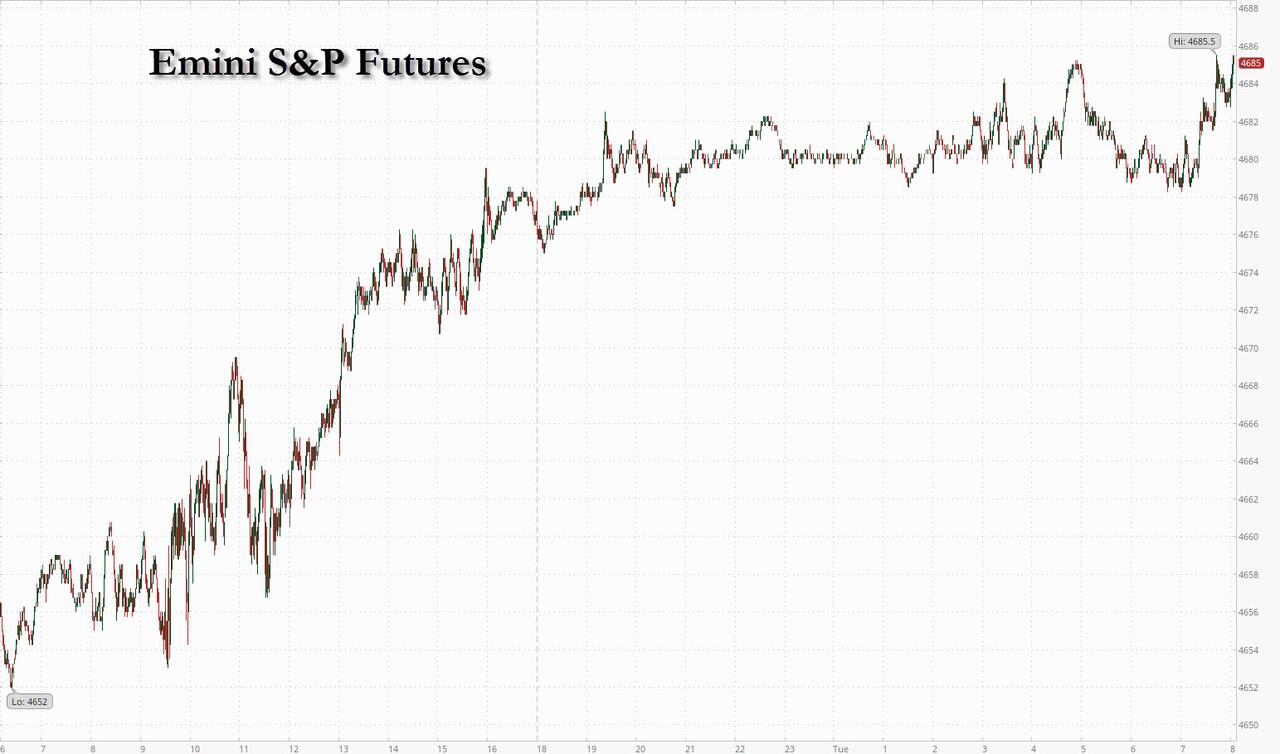
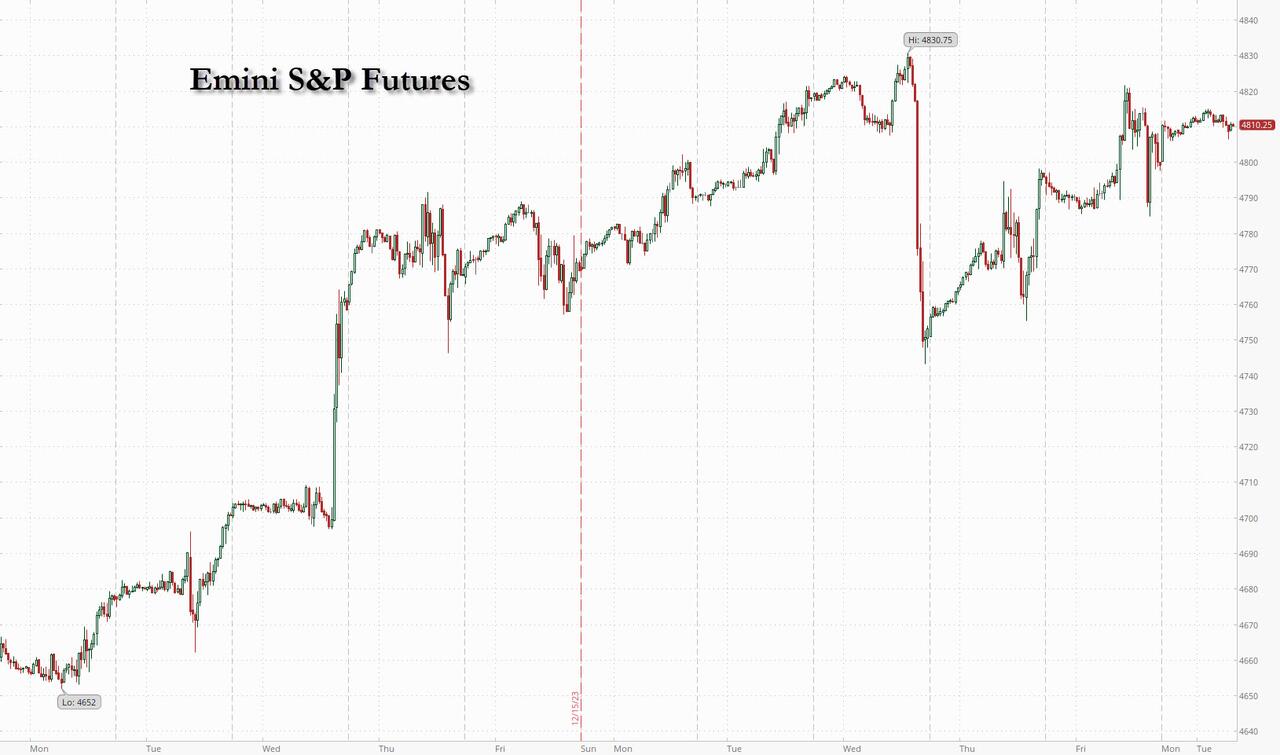
SPX futures consolidated between 4752.00 and 4766.00 this morning.  The markets are thinly traded and large institutions seem to be absent from the scene.  The Cycles Model shows the SPX being calm for the balance of the year, but the VIX shows otherwise.

Today’s options chain shows 4750.00 to be a highly contested layer for both puts and calls.  Long gamma may begin at 4760.00 while short gamma may start at 4735.00.

ZeroHedge reports, “The Santa rally grinds on, with US equity futures edging modestly higher in very thin volumes while interest yields were flat as trading resumed after the Christmas holiday amid growing expectations for earlier and deep interest rate cuts next year which supposedly will prevent a recession from materializing. As of 8:00am, S&P futures rose 0.1% while Nasdaq 100 futs gained 0.2%. Most European markets are closed, while Asian stocks are mixed in a thin trading session with markets including Hong Kong, New Zealand and Australia also shut. The dollar was little changed while bitcoin slumped during its now traditional Asian session meltdown.”


VIX futures are trading near the upper end of Friday’s trading range.  The Cycles Model shows a double dose of trending strength appearing today.  It also shows that a rally may persist through the third week of January.  VIX has made a basic breakout, giving it an aggressive buy signal.  Confirmation comes above the 509-day Moving Average a15.12.

Tomorrow’s options chain shows Max Pain at 13.50.  Short gamma dwells at 13.00 while long gamma begins at 15.00 and runs to 24.00.  The perception is a quiet market ahead.

ZeroHedge remarks, “Santa rally happening right now

The “Santa Rally” is the period of time including the last 5 trading days of the year followed by the first two in January. The S&P 500 has rallied during this period of time each of the last 7 years and 79% of the time since 1950.”


TNX is  hovering near its Friday close after making a possible early Master Cycle low on Thursday.  This low may be challenged for another week or so.  Therefore there is no signal at the present.  January may prove to be a choppy time for bonds.  The long view is that yields are going much higher than anyone expects.  It won’t be long before that becomes evident.

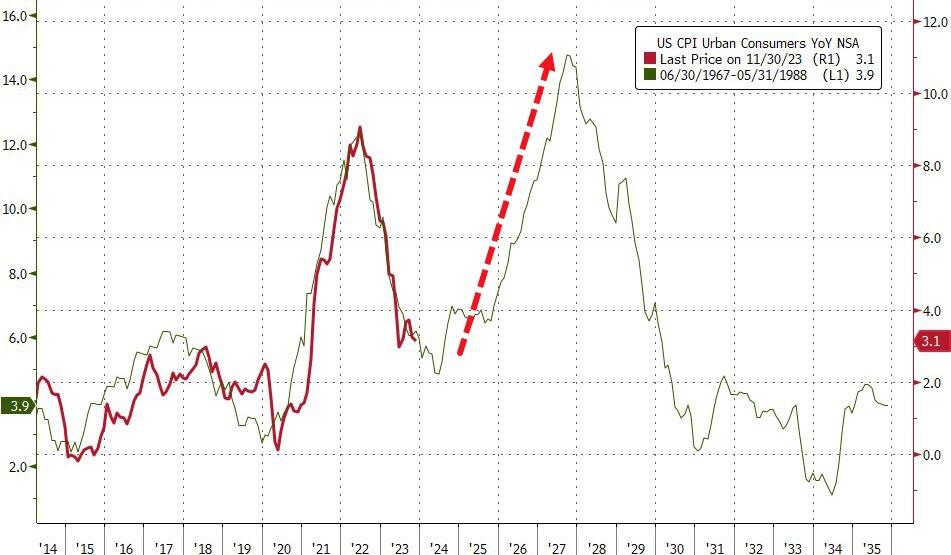
ZeroHedge remarks, “A few days ago we had some fun at the expense of the Fed’s technocrats, when we concluded that “inflation had been defeated”

… by looking at the roundtrip in CPI inflation from 1972 to 1976. Of course, inflation was anything but defeated as everyone knows what happened in the late 1970s and early 1980s, and how Paul Volcker just barely managed to put the inflation genie back in the bottle, and certainly not before hiking rates to 20%.”


USD futures are probing the low, reaching 101.21 this morning.  It may be likely that USD reached its Cycle Bottom at 99.80 by the end of the week.  The Cycles Model suggests that January may show a rising USD lasting rough the end of February.

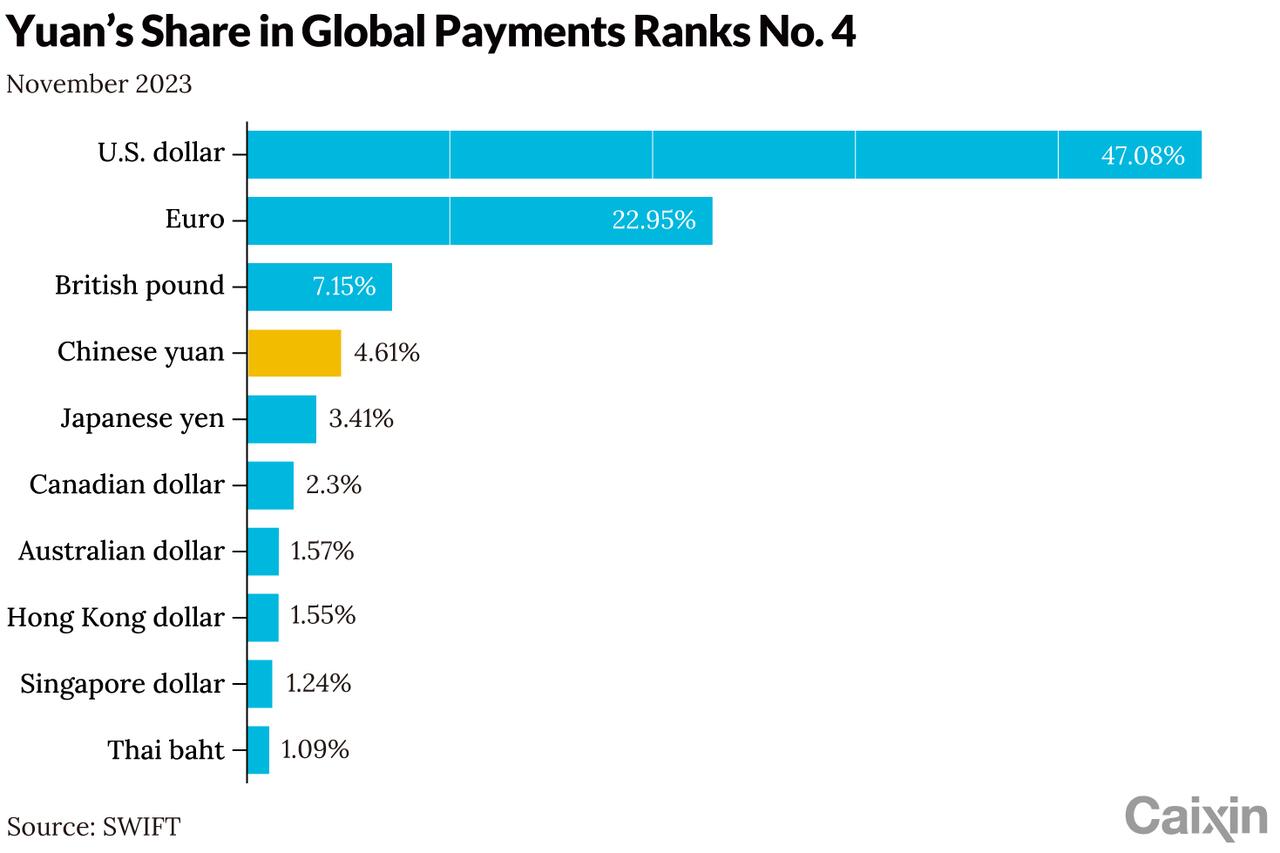
ZeroHedge observes, “China’s yuan has overtaken the Japanese yen to become the fourth-most used currency by value in global payments for the first time in almost two years, according to a monthly tracker of the Chinese currency released by the Society for Worldwide Interbank Financial Telecommunication (SWIFT).

The share of the yuan as a global payment currency climbed to 4.61% in November from 3.6% the previous month, according to data compiled by SWIFT and released on Thursday. According to Caixin, the redback surpassed the Japanese yen, whose share came in at 3.41% in November, down from 3.91% the month before.”


Crude oil futures rose this morning to 75.71, crossing Intermediate resistance at 74.49 and making a confirmed buy signal.  The buy signal may persist until early February.  There may be resistance at the 50-day at 78.18, but once above it, crude may rise to the neckline of the Head & Shoulders or higher by February.


Gold futures are consolidating above the Cycle Top support at 2065.00.  Today is day 257 of the Cycles Model.  We may be anticipating a decline beneath the Cycle Top, setting off a sell signal for gold.  There may be a strong decline to the middle of January, according to the Cycles Model.


Posted in Published | 3 Comments

December 22, 2023

9:40 am

BKX has remained under its December 14 high, but seems hesitant to decline further.  There may be the possibility of an inversion, as the powers-that-be attempt to keep interest rates low and bank stocks elevated.  However, the probability of a massive accident in the Banking sector is very high.  The Cycles Model suggests a probable decline starting after the first of the year, with a panic developing in the third week of January.  There may be some arbitrage in rates that may keep the banks afloat…until rates start rising again.

ZeroHedge observes, “Usage of The Fed’s BTFP bank bailout facility soared again last week, jumping $7.5BN to $131BN…

Source: Bloomberg

But Regional Bank shares still don’t care…


8:10 am – Merry Christmas!

Good Morning!

NDX futures consolidated beneath the Cycle Top resistance at 16772.44 this morning.  The Cycle Top acts as resistance to further attempts at a new high.  The rising trendline beneath the 1 month rally lies at 16600.00, offering an aggressive sell signal.  The Cycles Model suggests the inversion was meant to reach the Cycle Top and no more.  Should the NDX decline beneath the trendline, the Cycle path is lower until mid January.

Today’s options chain shows Max Pain at 16725.00.  Long gamma begins at 16750.00 while short gamma lies at 16700.00.

ZeroHedge observes, “The market’s reflexivity was on full display in the latest monthly Bank of America Fund Managers Survey (full note available to pro subs in the usual place), in which BofA Chief Investment Strategist Michael Hartnett polled 254 panelists managing $691 billion in the period between Dec 8 and 14th, thus capturing sentiment after the unexpected dovish Fed pivot. Not surprisingly, Hartnett found that the Fed’s capitulation resulted in the most upbeat sentiment since Jan’22 (when stocks hit an all time high last) on what is now called “Goldilocks ’24”

…. as investors cut cash to 4.5% from 4.7%, a 2-year low…”


SPX futures are challenging the 1987 trendline at 4745.00 this morning in an attempt to make new highs.  Failure to do so may allow SPX to decline beneath the Cycle Top, giving an Aggressive sell signal with a decline to the next support level, Intermediate support at 4657.13.

Today’s options chain shows Max Pain at 4745.00, inadvertently trying to hold the 1987 trendline.  Long gamma starts at 4750.00 while short gamma may begin at 4740.00.

ZeroHedge reports, “US equity futures were slightly lower, bond yields dropped ahead of the release of a the Fed’s favorite inflation metric, the core PCE, which could cement the case for Federal Reserve interest-rate cuts as soon as March which in turn will unleash the biggest policy mistake since the Arthur Burns Fed, triggering much more inflation down the road. As of 7:55am ET, futures on the US Nasdaq 100 and S&P 500 were down -0.1% after a solid rebound yesterday from Wednesday’s 0DTE inspired selloff. The dollar dropped while oil was modestly higher, headed for a weekly advance as attacks in the Red Sea forced hundreds of ships to take longer routes.”


VIX futures are consolidating positively inside yesterday’s trading range.  There may be an effort to suppress the VIX prior to the Christmas Holiday.  However, the Cycles Model shows a potential surge in strength early next week.

Wednesday’s options chain shows Max Pain at 13.50.  The sole short gamma position lies at 12.50.  Long gamma may begin at 15.00, but long sentiment is still lagging.

ZeroHedge remarks, “Somebody is nervous

VIX continues moving higher today, despite the fact SPX has managed bouncing from yesterday’s panic. The sudden bid in volatility shouldn’t be dismissed. VIX hasn’t closed here since November 20. Chart shows SPX vs VIX inverted.


TNX is testing its low at 38.29 this morning.  The current Master Cycle is at day 247, which allows the decline to extend to the opening day of 2024.  Should TNX go lower during that time, it may go to the Cycle Bottom near 32.00-33.00.   This is not the end of rising yields.  On the contrary, the next target in 2024 may be 5.3%.


USD futures made a new low at 101.10 this morning.  The Cycles Model anticipates the Master Cycle low may arrive next week.  The possible target may be near the Cycle Bottom at 99.81.

ZeroHedge remarks, “The magnitude of last week’s dovish swing by the Federal Reserve now makes a rate cut next year highly likely.

Yet, as is so often the case with central banks focused on lagging variables, it could come at exactly the wrong time, with a profusion of indicators showing inflation will be rekindled later next year. Rate-cut expectations look overdone, but any repricing may not come until the whites of inflation’s eyes are seen — when that happens the move will be dramatic.

No analogy is perfect.

But history rhymes because there is one thing that is immutable through time: human nature.

The 1970s were different to today in several respects, but the immutability of human behavior makes it quite conceivable a similar inflation pattern could recur.”


Posted in Published | 5 Comments

December 21, 2023

7:45 am

Good Morning!

NDX futures bounced to a morning high (thus far) of 16689.60, short of the Cycle Top resistance of 16751.05.  The Cycle Top is now critical resistance to the rally.  There is a rising trendline near 16450.00 that, once broken, confirms the aggressive sell signal.

Today’s options chain shows Max Pain at 16575.00.  Long gamma may start at 16590.00 while short gamma may begin at 16570.00 .  Short gamma dominated the options chain this morning.

ZeroHedge observes, “1 – SPX – the short term view

The trend channel that has been in place since October lows remains intact. Note that we never tried the upper part of the steep channel. Short term supports are: 4750, 4720 and then the bigger 4700. Resistance is the 4850:ish area.

Source: Refinitiv

2 – NASDAQ levels to watch

NASDAQ’s steep trend channel remains intact, although yesterday’s bearish candle isn’t looking great. Resistance around the 17100 area. Supports: lower area of the channel around 16700 and then the 16400 ish area, right where the 21 day comes in.”


SPX futures have risen from 4701.90 to 4727.60, short of the 1987 trendline near 4745.00.  Yesterday’s move is called a Key Reversal, a highly recognized reversal signal. The trendline provides maximum resistance  while the Cycle Top support and rising trendline near 4700.00 provide confirmation of the new trend at their crossing.  The Cycles Model suggests a decline in the making to mid-January with a possible outright panic starting the second week of January.

Today’s options chain reveals Max Pain at 4720.00.  Long gamma may start at 4725.00 while short gamma begins at 4710.00.  However, the entire entire options chain is sorely contested.

ZeroHedge reports, “One of the ironic consequences of yesterday’s sharp, 0DTE-driven 1.5% selloff which was the biggest for the S&P since Sept 26 and which snapped a 9-day winning streak, is that with the market hitting the most overbought level in years earlier in the day, the liquidation reset the Relative Strength Indicator of the S&P back below 70, and thus no longer in overbought territory, which paradoxically has made a gradual year-end meltup even more likely once traders realize that nothing substantial has changed, the Fed has still pivoted dovish and that much of the technical overhang that prevented a move even higher may now be gone.”


VIX futures declined to 13.24 this morning, after exceeding a Intermediate resistance at 13.41.  This event may be used as an aggressive buy signal.  The signal becomes a confirmed buy above the 50-day Moving Average at 15.24.  The Cycles Model suggests the rally may continue to the third week of January.

Wednesday’s options chain shows Max Pain at 13.50.  Short gamma has shrunken to a single cluster at 12.50.  Long gamma begins at 15.00 and stays strong to 20.00.  We may see speculators fill in the long gamma to much higher levels.


TNX futures continue to drift lower, to 38.30 thus far.  The Cycles Model suggests that the reversal window is open but there may be another week of sideways-to-lower prices.  A possible target for this decline may be 33.00, suggesting a higher degree Wave [4] may be in progress.  Should that be the case, Wave [5] may be a monster blow-off with a possible target of 68.00 in the first half of 2024.


USD futures have declined to a morning low of 101.46.  The Cycles Model suggests another week of decline, possibly to the Cycle Bottom at 99.83.  Today is day 251 of the  current Master Cycle.


Posted in Published | 1 Comment

December 20, 2023

3:35 pm

SPX has made a stunning reversal, declining beneath the 1987 trendline at 4743.00 for an aggressive sell signal.  The next support is the Cycle Top at 4702.00 (not shown) which adds confirmation to the aggressive sell.  Regardless of declining beneath the second support, today is a key reversal day.

ZeroHedge remarks, “Acrophobia?

Some people are starting to get a bit afraid of “heights”. The latest rise in the SDEX is telling us the crowd is “long enough” and they need to start paying up for downside protection.”


1:56 pm

BKX, our liquidity proxy, is hovering near its high after a 36% rally from the October low.  However, instead of making new all-time highs, BKX has only retraced 55% of its decline from its February 2 high.  We may never know exactly what prompted the Fed to pour on the liquidity, but you can see why there was a threat.  The Head & Shoulders formation is truly ominous.  Should 70 be broken, we may see BKX reach its target by summer.


8:10 am

NDX futures are lower this morning, to 16754.40.  The Cycle Top support is at 16738.05.  Beneath that level is an aggressive sell signal.  Once beneath it, an entire year’s gains may evaporate in just a few weeks.  Buybacks are finished for this quarter and earnings reports start on January 8, with an uptick in volatility.

Today’s options chain shows Maximum investor Pain at 16850.00.  Long gamma begins  at 16875.00.  Short gamma starts ay 16830.00 with a bangg followed by large layers of puts at 50-point intervals.

ZeroHedge remarks, “One more, just one more…

Can we say it….? “It’s so bullish that you almost have to get bearish…”. Ok we said it. But seriously, have you ever seen such a one-sided market where everything is interpreted bullish and it is an “everything up” type of tape. Futures cannot even go red on a FedEx profit warning…..To stay on theme we hereby provide you with a couple of more bullish observations. Enjoy!

Brontosaurus buyback bid

Largest weekly corporate buybacks in BofA data history (since‘09). And guess what, this bid a) never gets tired and b) never cares about your bearish feelings.”


SPX futures are testing the 1987 trendline support near4740.00..  This marks a potential sell signal for SPX.  Beneath that is the Cycle Top support at 4699.00, the next layer of support.  The dynamic sell signal may be confirmed at that level.  There may be a structural resistance at 4795.00 where an attempt at that level may be met with a reversal.

Today’s options chain shows Max Pain at 4765.00.  Long gamma begins at 4790.00 while short gamma starts at 4750.00.

ZeroHedge reports, “US equity futures and global markets reversed their torrid rally as bonds rallied and the dollar gained after a fresh batch of soft inflation data in the UK boosted the likelihood of interest-rate cuts, but also underscored the risk of an economic downturn. As of 7:45am, S&P eminis dropped 0.2% after the index notched a record high for the third successive session, with European and Asian stocks in the red. Germany 10-year yields dropped below 2% for the first time in nine months after a report showed producer prices fell more than expected in November. Meanwhile, British 10-year borrowing costs slid as much as 11 basis points as slower-than-expected inflation boosted the case for multiple rate cuts next year. Treasury yields slid four basis points to 3.9%, down more than 40 this month. Brent jumped above $80 to a 3 week high after the US considered possible military strikes against Houthi rebels in Yemen, in a recognition that a newly announced maritime task force meant to protect commercial ships in the Red Sea may not be enough to eliminate the threat to the vital waterway. US economic data includes 3Q current account balance (8:30am), November existing home sales and December consumer confidence (10am).”


VIX futures climbed to 12.73 so far this morning, in an attempt to overcome its one week trading range at 12.74.  The Master Cycle low is also one week behind us reinforcing the change in trend.  Pressure for a breakout above 14.31 is growing and trending strength may re-appear early next week.

Today’s (monthly) options expiration may bring a bit of volatility of its own.  Max Pain is at 14.50.  Short gamma is crowded between 11.00 and 14.00.  Long gamma starts at 18.00 and is well populated to 45.00.  This may be where the action is today.

ZeroHedge remarks, “Usually when markets break out from a given range, there are various market speed brakes – usually in the realm of derivatives – which act as a natural decelerator to any rapid move either higher or lower. Dealer gamma is one such buffer, as it is traditionally positive around prevailing levels or “big large numbers” (where it provides what is known as “gamma gravity”), and forces dealers to step into the direction of aggressive order flow so as to avoid major losses.

However, on certain rare occasions, when countertrend fund flows are too powerful, Dealers are forced to reprice gamma higher or lower, ending up in a “negative gamma” position, one where they are forced to chase – not lean against – any one market move. That was the case in February (discussed here “Here Comes The Negative Gamma Flip“). That’s also the case today.”


TNX yields are drifting lower today to 38.75 (38.70 in the futures).  Tomorrow the Treasury announces its final 2023 auctions in the 2-year, 5-year and 7-year notes, all taking place next week.  The current Master Cycle is approaching its reversal in the next week as well.  Janet Yellen may be deliberately trying shoehorn as much as she can into these auctions while rates are low.  The Cycles Model indicates a surge in trending strength reappearing after the New Year.

ZeroHedge reports, “With secondary market yields tumbling in recent days following the Fed pivot, traders were closely watching today’s 20Y auction to see if demand for paper would suffer in the primary market. We got the answer moments ago when the Treasury sold $13 billion in 20Y paper in what was a rather ugly auction.

Starting at the top, the auction priced at a high yield of 4.213%, which was more than half a percent below last month’s 4.780% and was the lowest yields since July. It also tailed the When Issued 4.198% by a remarkable 1.5bps, the first tail in the tenor since August, and the biggest tail since October 2022.

The 2.56 BId to Cover was on the low side of recent auctions, down from 2.58 last month, and below the 2.67 recent average; it was also the west btc since March.

The internals were also quite ugly, with Indirects sliding to 66.4%, far below last month’s 74.0% and the lowest since September. And with Directs awarded 20.7%, Dealers were left holding 12.9%, the highest Dealer take down Since October 22.”


Posted in Published | 1 Comment

December 19, 2023

11:39 am

After a bit of investigating I concluded tat the December 1 high at 4599.39 in the SPX may have been the Master Cycle high on day 263,  This Master Cycle high was visible in all the stock indexes.  What happened after was a rare inversion of the new Cycle due to the FOMC  pivot    There are two possible outcomes.  The first is that the rally in SPX may stop short of 4800.00 in the next few days due to a possible structural limitation, leaving about three weeks of decline into mid-January, as previously mentioned.  Second, should the SPX exceed 4800.00, we may see the rally continue to mid-January.  The 1987 trendline at 4740.00 is the first possible aggressive sell signal.

The VIX ended its Master Cycle on the day of the FOMC meeting.  It may begin a panic Cycle next week,, which bolsters the first outcome.

RealInvestmentAdvice states, “A recent warning by YahooFinance warns investors to sell their cash and buy bonds and stocks now as the Fed pauses. To wit:

“Get out of cash now. Take advantage of some of these incredible things in the fixed-income markets, especially in the belly of the curve. Take advantage of the companies that are still available to you at reasonable prices,” said Gargi Chaudhuri, head of investment strategy at BlackRock iShares Americas. 

Such advice certainly goes against a mountain of historical evidence from both inverted yield curves and Fed rate cuts that suggest investors should be selling stocks and heading to the safety of cash. For example, the four-panel chart below shows the previous yield curve inversions when more than 50% of the ten economically sensitive yield spreads we track were inverted. ”


8:45 am

Good Morning!

I have switched to the weekly charts because the rally is larger than what the daily charts have indicated.  It now appears that the NDX may be completing its Super Cycle Wave (b) which has been in effect since March 2009.  I am still revising the labels, so you may see some changes to this chart later on.  However, what I am seeing is five degrees of trend which takes in much larger Cycles than what I have illustrated up to this point.

Today’s NDX futures have risen to 16778.00 thus far.  The weekly Cycle Top is 17126.17, a very likely target for this rally.  This top may be the equivalent of the 2000 top, with its blow-off feature.

Today’s options chain shows Max Pain at 16820.00.  Long gamma may start at 16850.00.  Short gamma begins at 16800.00.

ZeroHedge remarks, “No fear FAANG

NYFANG continues moving higher, reaching the most overbought levels since the June mania…but overbought can stay overbought for longer than most think possible.

Source: Refinitiv

Small caps

S&P Small Cap Index is up 9% relative to the S&P 500 since Nov. 10th; however, the long- term relative performance and valuation for small caps look very undemanding in a historical context (the S&P Small Cap forward P/E multiple trades at a 30% discount to large caps; 13th percentile back to 1997). Mike Wilson finds that small caps actually tend to underperform both before and after Fed rate cuts, which speaks to the notion that the Fed typically cuts rates as nominal growth is slowing and small caps tend to be quite economically sensitive. (Morgan Stanley)

Thank you rates

Small caps are very sensitive to rising rates. The latest move lower in rates is a tailwind for small caps, ceteris paribus.”


SPX futures have risen to 4752.10.  Its Cycle Top resistance is at 4809.10.  This may allow it to exceed the January 2022 high at 4818.62 and temporarily exceeding the 1987 trendline a final time.  This move may be truncated by a potential financial accident at any time.

Today’s options chain shows Max Pain at 4745.00.  Long gamma starts at 4750.00 while short gamma begins at 4740.00.  This market is very tightly wound.

ZeroHedge reports, “&P futures continue their seasonal year-end meltup following 0.3% gain in Estoxx 50 where utilities and industrials outperform and a surge in Japanese stocks where the BOJ “shocked” market by doing nothing at all. As of 8:00am ET, S&P and Nasdaq 100 futures were up 0.2%, set for a third consecutive record high. Europe’s Stoxx 600 index rose 0.3%, with Switzerland’s UBS AG rising as much as 2.8% after Cevian Capital AB took a €1.2 billion ($1.3 billion) stake. The yen plunged as much as 1.5% to a one-week low against the dollar, while the Nikkei 225 equity index rallied after the BOJ held its policy rate at -0.10% denying laughable speculation of an imminent rate hike. 10-year yields slipped about two basis points, the dollar slipped and bitcoin gained, while WTI futures were little change on the day despite growing paralysis of Red Sea transit.”


VIX futures hit a morning low of 12.44.  A buy signal awaits above the 10-week average at 14.31.

Tomorrow’s monthly options chain shows Max Pain at 14.50.  Short gamma resided between 11.00 and 14.00.  Long gamma begins at 15.00 and extends to 45.00.


ZeroHedge observes, “FOMO for real

SPY ETF all-time record inflows of more than $20bn last week

Source: Bloomberg

$20bn of FOMO buying. $6 trillion of potential

“.. despite a near 20% rally in the $QQQ since late October .. the amount of cash on the sidelines .. now at $5.886 trillion .. funds might begin to deploy cash in the new calendar year .. which might help to fuel the market rally even more.” (FundStrat)

It’s happening

Huge monthly inflows in SPY on the back of the dovish FOMC meeting. We last saw such inflows in 2007.


The Weekly TNX chart shows it inside its  trading channel since 2020.  The channel may allow TNX to move much higher.

TNX futures dipped to 38.92 this morning before a bounce took it out of the danger zone.  While the current regime would like to see lower rates, the final high of this Cycle may be closer to 56.00.

ZeroHedge comments, “Follow the money. That’s how to explain the Federal Reserve’s extraordinary dovish swing last week. The government’s soaring interest-rate bill will become an increasing drain on the volume and velocity of reserves in the system, stoking headwinds for assets and the economy. By jettisoning higher for longer, the Fed has enabled interest-rate costs to fall – but only by heightening future inflation risks and the prospect of higher yields.

Mark Wednesday 13th of December down as the day modern-era central-banking independence died in all but name. The rot began several years ago, and spread when inflation jumped to its highest level in decades. But the Fed’s Damascene conversion to dovishness at last week’s meeting was the fatal blow.”


Posted in Published | Comments Off on December 19, 2023

December 18, 2023

8:00 am

Good Morning!

NDX futures are consolidating just beneath their Cycle Top at 16669.77.  Friday’s high at 16669.77 may be the Master Cycle high, on day 275.  The Master Cycle has been stretched due to options expiration on Friday.  Today we may see an “unclenching” of the gamma hold on the NDX from investor calls as a third of them have dropped off at Friday’s expiration.

Today’s options chain shows large (institutional) put positions taken as high as 16690.00, leaving the NDX in short gamma. Long gamma may exist above 16700.00.  The NDX unclench may have begun.

ZeroHedge remarks, “When stocks were tumbling in late October to the lowest level in 5 months, few dared to stick their necks out and call the bottom (in fact, quite the contrary, there was a huge pile up of the usual momentum chasers predicting a total collapse in the S&P in the next few weeks). However, UBS desk trader Rebecca Cheong was not one of the doom echo-chamber penguins, and as we reported on October 20, shortly after the 10Y briefly traded above 5%, she called the bottom in the market writing that “treasury bonds hit capitulation on Thursday and it should mark the end of the current multi-asset unwind cycle that started on Aug. 1.”

As we summarized next, “her conclusion: “I like to buy the dip today in Equities at this level” which with stocks at session lows, with buyback blackout period ending today, at the same time as the endless Fed chatterboxes enter a blackout period, is probably not a bad suggestion.”

It certainly wasn’t, and those who listened to Rebecca made an entire’s year of profits in what has since become a “November to Remember”, a month in which every risk asset exploded to the upside.”


SPX futures are steady this morning, beneath Thursday’s high and beneath the 1987 trendline near 4730.00.  On Thursday I posted the chart showing the trendline originating in 1987.  You may conclude, as I have, that the markets are not random.  The trendline is giving us warning that the trend may be exhausted.

Today’s options chain shows Max Pain at 4695.00.  While there is a large call position at 4700.00, long gamma may not begin until 4720.00.

ZeroHedge reports, “After 7 consecutive weeks of gains, US equity futures edged higher, and traded near session highs even as European bourses were red across the board, as central bankers sought to sow doubts that aggressive interest-rate cuts will materialize early next year. As of 8:00amm S&P 500 futures added 0.3% with Nasdaq 100 futs rising 0.5% on the back of relentless year-end tech momentum, while the Stoxx Europe 600 index was little changed amid thin volumes.  Oil rebounded from earlier losses after BP halted all tanker transits through the red sea. Treasuries edged higher and are on course for a fifth day of gains — the longest stretch since August — while the dollar slips and the yen underperformed ahead of Tuesday’s Bank of Japan monetary policy decision. Meanwhile, more government-backed Chinese companies have ordered staff to not bring iPhones and other foreign devices to work, setting in motion an unprecedented prohibition that could block Apple and Samsung from the world’s largest mobile market.”


VIX futures advanced to 12.64, but have not broken out at 13.85-14.31.  The Cycles Model shows trending (upside) strength building this week with a possibility of a panic rally after the holidays.

Wednesday’s o-ex shows Max Pain at 14.50.  Short gamma rests between 1.50 and 14.00.  Long gamma starts at 20.00 and goes to 45.00.

ZeroHedge remarks, “Just when you thought it was safe to get back in the [market],” Deutsche Bank’s Jim Reid drops some veteran market-watcher wisdom, with a nod to the most important contradiction in markets right now.

Namely that current conditions are as sanguine as they could be, but with history suggesting its still early in terms of the lag of monetary policy.

Indeed, this week saw the VIX hit a post-pandemic low, and last night the S&P 500 hit an all-time high in total return terms after the Fed folded like broken beach-chair in its inflation-fight.”


TNX is emerging from Thursday’s Master Cycle low to begin a new rally that may extend to the first week of January.  Current projections are that TNX ma exceed 50.00 in this move.  Remember, the Fed is not in charge of interest rates, the market is.

ZeroHedge remarks, ” Something is not right, and the drastically divergent messages from Powell and his cronies at the Fed over the last month and a half confirm this suspicion.

The Burning Platform’s Jim Quinn writes that the current situation does remind me of September 2019 when the repo market revealed the underlying mechanisms within the financial system were malfunctioning and were about to lead to another massive financial crisis.

Powell restarted QE and “luckily” the COVID scamdemic was rolled out, so Powell and and our corrupt political class could pump trillions into the system and keep it alive.

Powell and his fellow tough guys at the Fed had increased rates to 5.3% and have talked tough about keeping rates up until inflation got back to their 2% target.

With GDP supposedly accelerating at 5.2%, unemployment still near all-time lows, and corporate profits still booming, there should be no fear about rates being too high by Powell and his sycophants.

But suddenly this week Powell and these economic “rocket scientists” now are saying they will be cutting rates soon and more than anyone expected.”


Posted in Published | 2 Comments

December 15,2023

3:42 pm

Today may be the beginning of the reversal in BKX.  The Head & Shoulder may still be in effect, forecasting a powerful decline.  Be prepared for what that may entail.

ZeroHedge remarks, “The exodus from The Fed’s reverse repo facility accelerated this week with a $54BN decline just today, back below $800BN, lowest since July 2021…

Source: Bloomberg

The Fed’s balance sheet expanded last week by $2.2BN. The first weekly expansion since August 9th and biggest weekly increase since June 7th…”


7:50 am

Good Morning!

NDX futures rose to 16603.00 thus far this morning in another attempt ot test the Cycle Top at 16674.35.  Yesterday’s high fell short of that resistance and there is a strong likelihood that it might try again.  Tops and bottoms are often made at support and resistance points based on the Cycles.  In this case, the bullish attern is complete, subject to verification by the marketplace.  In this case, the rally has been helped by multiple sources of liquidity that may now be exhausted.  Of course, we cannot rule out the political background.

Today’s options chain shows Max Pain at 16500.00 with long gamma above that.  Short gamma rules beneath 16400.00.

AS ZeroHedge observes, “So the picture that emerges is a puzzling one: on one hand with weaker data in hand, the Fed Chair said it was “premature” to talk about rate cuts, yet less than two weeks later, with stronger data in place and with hotter than expected inflation, Powell suddenly flip-flopped 180 degrees, shocking even veteran traders, when supposedly the Fed now was looking at precisely those things (PPI) which it went to great lengths to avoid when inflation was soaring.

Or maybe there is no puzzle at all: maybe what that happened in the past two weeks had nothing to do with economic data, the state of the US consumer, or how hot inflation is running and everything to do with… phone calls from the increasingly angry White House, the same White House which after seeing the latest polling data putting Biden at the biggest disadvantage behind Trump despite the miracle of “Bidenomics”…”


SPX futures rose to 4736.70 this morning in another test of the 1987 trendline.  See yesterday’s afternoon memo.  The current Master Cycle is already stretched to its limit, so the ability to maintain this condition may be constrained.  The Cycles Model calls for a decline into mid-January, so be warned that all is not well on Wall Street.  The trip wire for a possible aggressive sell signal lies at 4685.00.

In today’s morning options chain, calls dominate the entire range down to 4400.00.  This suggests that the SPX may maintain its buoyancy during the morning expiration.  However, the afternoon expiration is decidedly bearish beneath 4715.00.

ZeroHedge reports, “2023 is almost in the history books (the last two weeks of December are usually a volumeless, skeleton crew formality), and the S&P is set to close out the year just shy of all time highs hit in January 2022, largely thanks to the dovish Fed pivot this week and to a relentless buildup (well ahead of said pivot) in Fed reserves which are also closing out the year at 2023 highs…

… and are set for 7 consecutive gains in a row, the longest such stretch since 2017.”


VIX futures are consolidating again this morning above Wednesday’s Master Cycle low.  There is a threat of a new low today, as stock options expire.  Once the morning optons expire, there may be a release of the VIX to move higher.

Wednesday’s (monthly) options chain shows short gamma between 11.50 and 14.50.  Long gamma dominate from 15.00 to 45.00.  There may be an explosive move out of the low.

ZeroHedge observes, “Leave no stock behind

The “everyone” rally…..89% of S&P 500 stocks are trading above their 50 day moving average, the highest percentage of the year. Chart showing the percentage measure vs the SPX.

Source: Tradingview


Clients chasing upside…

“Incredibly busy day on the vol desk as calls made up 58% of the tape, one of the highest levels ytd. We saw significant demand for upside with client chasing via single names and same-day options at the index level. With the outperformance in Russel, IWM call volumes stood out with 1.35mm on the tape (3rd highest of all time)”


TNX is rising off its Master Cycle low made yesterday.  The Cycles Model suggests that rates may be rising into the first week of January.  While a rally off the Master Cycle low may be a buy signal, rising above the mid-Cycle resistance at 40.60 may offer confirmation.

ZeroHedge attempts to explain, “WTF was Powell thinking?

They are trying to front-run (errrr, “will”) the soft-landing through the outright adoption of the now legendary “Waller Doctrine,”…

…and moving from the prior “Nominal Rate” policy regime instead to a “Real Rate” one in “anticipatory” fashion…

…all in order to “reduce restriction on the economy well before 2%”

which preemptively reduces the left-tail risks from running “overly-tight”

,,,“fattens” the right-tail probability that they can “land the plane”.

The massive easing in financial conditions is shocking (especially in light of the fact that The Fed kept its “financial conditions are tightening” language in the statement) as it is now at its ‘easiest’ since before the June rate-hike in 2022!

Simple!”


USD futures are consolidating after yesterday’s strong bounce out of its Master Cycle low.  Higher treasury rates means the USD becomes more attractive to foreign investors.  The Cycles Model suggests a rising USD to the end of the year.


Posted in Published | 1 Comment

December 14, 2023

2:45 pm

I have been challenged to show the complete 1987 trendline.  It has been problem since my charting service generally begins at January 1, 1990.  I finally found a way to allow the chart to go back to 1987, so here it is.


10:17 am

BKX may have ended its Master Cycle tis morning, on day 265.  This rally produced a nearly 33.5% gain from the bottom on October 25.  Quite a return for a bear market rally.  This has clear implications of a rescue operation by the Fed and Treasury.  TARP or its equivalent may also have been used to keep banks from running out of liquidity.   However, The Master Cycle may have ended today, at day 265.

ZeroHedge comments, “While Wednesday’s FOMC statement had barely any changes in it, with the notable addition of the word “any” in the context of policy firming meant to acknowledge that the Fed is at or near the peak rate…”

Please read the Fed statement on the condition of the banks…It may be that political pressure as been applied to make things look better than they are.


8:00 am

Good Morning!

NDX futures rose to their Cycle Top at 16660.00 this morning and fell back.  This may be the final bastion of resistance to the rally.  There may be a considerable amount of volatility as shorts were carried out on stretchers yesterday.  A good day for a reversal.

Today’s options chain shows Max Pain at 16430.00.  Long gamma begins at 16480.00, while short gamma lies at 16420.00.

ZeroHedge comments, “Looking at today’s epic post-FOMC market meltup, one may excused to believe this was the best day for investors in a long time. Well, it wasn’t, and in fact for hedge funds and most pair trading long/short investors, today was nothing short of a historic bloodbath with a barrage of margin calls hitting at the close.

Why? Because while stocks indeed soared, and the Dow closed at a new all time high rising above 37,000 for the first time ever, the stocks that made up the most popular shorted baskets soared about 7 times more!


SPX futures rose this morning to 4727.40, very near its 1987 trendline at 4730.00.  SPX first went beneath the trendline in October 2008 and stayed beneath it until November 2021, where it briefly maintained its position above the trendline until April 2022.  It has been beneath it since.  This trendline has significance since it originated in August 1982 and has defined the trend since then.  This trend is due to end in 2025, and may have made its final probe this morning.

Today’s options chain shows Max Pain at 4700.00.  Long gamma starts at 4720.00 while short gamma begins at 4690.00.

ZeroHedge reports, “Virtually every risk asset across the globe is rallying this morning, as the dollar and interest rates get whacked after the Fed unexpectedly signaled a much more dovish outlook including more than expected interest-rate cuts next year, unleashing bullish euphoria across markets amid optimism that inflation pressures are easing. After the Dow already tipped into record territory yesterday, on Thursday it was tech’s turn – Nasdaq 100 futures climbed, setting up the index for a run at a record close; meanwhile S&P 500 contracts edged 0.3% higher after the benchmark ended within 2% of its record high on Wednesday. Europe’s Stoxx 600 index surged as much as 1.7%. Shares in Germany and France hit fresh all-time peaks. Bond yields are lower with the bulk of the curve seeing a bull steepening and the 10Y now well below 4% (3.94% last). The USD sell-off continues which in turn is helping to boost commodities where Energy is leading and $70 is now acting as support for WTI. The macro data focus is on Retail Sales and Jobless Claims: given the upside surprise delivered by the Fed, this data may not be market-moving but remain useful for understanding whether the growth without inflation hypothesis remains intact.”


VIX futures pulled back to 11.94 this morning after yesterday’s bounce off the bottom of the Master Cycle.  This was the first time in two years that VIX boke ranks with its inverted behavior with the SPX, a probable sign of heightened risk.

Next Wednesday’s options chain shows Max Pain at 14.50 in a highly contested expiration.  Short gamma dwells between 11.50 and 14.00.  Long gamma starts at 18.00 and is heavily populated to 40.00.

ZeroHedge comments, “One of the biggest ever

We have just witnessed one of the biggest vol adjusted rallies ever. UBS adds some color: “chart shows the ratio of rolling ~6 week positive price returns, scaled by 1m implied vol at the beginning of the move. Similar extremes have preceded some large historical reversals lower”.


TNX may have made its Cycle low this morning at 39.51 on day 272 of its Master Cycle.  A buy signal awaits a rise above  the Mid-Cycle resistance at 40.58.  The Cycles Model suggests that rates may rise to the first week of January.

Zerohedge observes, “This week’s central-bank bonanza brings with it the usual set of ambiguous and often impenetrable statements and press conferences.

Traders and investors must spend precious time deciphering them. For those who wouldn’t mind a break from this parlor game, there are some markets that don’t march to the beat of the global policy cycle, and offer diversification benefits for portfolios.

The game was in full flow at Wednesday’s Federal Reserve meeting, as the central bank patiently unpicked the higher-for-longer stitching it had spent many months carefully inculcating in the market.

Anyone who had listened to it on financial conditions, keeping rates restrictive for an extended period, or who thought Powell meant it when he implied he was a Paul Volcker and not an Arthur Burns, is now left trying to figure out if the Fed’s reaction function has indeed changed.”


USD futures made a new low at 101.67 thus far as it probes to find its Cycle Bottom.  A lower USD contains the seeds of a potential sell-off in stocks and bonds by foreign entities.


Posted in Published | 4 Comments

December 13, 2023

1:28 pm

SPX has given up its morning gains.  There is no signal yet, but here are some levels to consider:  (1) A decline beneath 4600 may produce a Key Reversal which is considered a reliable sell indicator by many traders.  (2) A further decline beneath Short-term support at 4571.30 may offer an aggressive sell signal.  Further declines to supports beneath that may confirm the sell signal.  Aggressive signals are subject to blowbacks, but may eventually prove correct.  The rally is only sitting on a one-legged stool (retail buyers) as CTAs and corporate buy-backs have left center stage.

ZeroHedge remarks, “Back on Oct 17, almost to the day the market hit its lowest level since May, we wrote that “CTAs Are Now Buyers In Every Scenario“, a bullish thesis which was further underscored by the arrival of massive stock buybacks a few days later once the buyback blackout period ended (see “Here Comes The Surge In Stock Buybacks As Goldman Models A Record $142BN In CTA Buying) not to mention a huge short squeeze among the hedge fund community (see “After “Record 14 Weeks Of Shorting”, Hedge Funds Steamrolled In Epic Meltup Squeeze“). What has followed since then is what The Market Ear called “one of the biggest vol adjusted rallies ever”, which only makes sense a few weeks after Michael Wilson said to “forget” about a year-end rally, arguably the worst call in recent history.”


8:00 am

Good Morning!

NDX futures continued their relentless march higher, to 16393.70 thus far.  The intended target may be the Cycle Top at 16638.79.  It may have a structural limit not to exceed 16660.00.  Today is day 275, which is an outer boundary of the time allotted to the Master Cycle.  What comes next may be a violent reversal.

Today’s options chain shows Max Pain at 16340.00.  Long gamma begins at 16350.00, while short gamma is in short supply.  A reversal today may be a total surprise.

ZeroHedge observes, “All I want for Christmas

Everyone apparently needs to have more Tech. Most inflows into the S&P Tech Sector (XLK) yesterday in the last 5 years…

Source: GS sales

Terrific Tech Tuesday

Themes / sector performance yesterday somehow feels bullish. Everything tech / AI / growth did well. And the mega-caps are back at doing what they do best after a litte well-deserved rest.”


SPX futures also maintain their climb to 4652.10 thus far.  The apparent upper limit may be the Cycle Top at 4677.43.  A rough calculation of the 1987 trendline places it at 4705.00, which ay be an alternate limitation to the rally.  A normal decline from here may target the Cycle Bottom at 3992.42.

Today’s op-ex shows Max Pain at 4590.00.  Long gamma starts at 4600.00.  Short gamma begins at 4575.00.

ZeroHedge reports, “S&P 500 futures continued to grind to fresh 2023 highs, quickly approaching all-time highs ahead of the Federal Reserve’s last interest rate decision for 2023, after Tuesday’s cash close was at highest level since January 2022. As of 7:45am ET, S&P futures rose 0.12% while Nasdaq futures continued their relentless ascent, adding another 0.2% as investors looked ahead to the Federal Reserve’s interest-rate decision, bracing for any warnings from Chair Jerome Powell that market expectations of policy easing are overdone (our full FOMC preview is here). European stocks are also ahead, with the Stoxx 600 rising 0.2%. Asian stocks fell, with Chinese equities leading declines on disappointment over a lack of more stimulus from a key economic leadership meeting, while European stocks rose, with the Stoxx 600 rising 0.2%, and touching fresh 2023 highs. Sterling tumbled after UK GDP printed -0.3%, contracting more than the lowest consensus estimate while the Bloomberg Dollar Index rose 0.2%. oil prices are little changed, with WTI trading near $68.70. Spot gold rises 0.1%.Bitcoin traded just above $41,000. Today’s macro focus is on PPI and the Fed. The Fed is expected to make no changes to its policy, Powell is expected deliver a hawkish press conference, and for the dot plot decline by 50bps. For markets the keys will be the dot plot and whether Powell discusses a pathway for cuts.”


VIX futures are bouncing off yesterday’s low at 11.81 to a morning high at 12.27 thus far.  A rising VIX in tandem with a rising SPX is a sign of danger ahead, since on or the other is wrong.  Yesterday was day 274 in the Master Cycle, stretched to its outer limits.  Should VIX move lower, the Cycle Bottom lies at 11.18.

Today’s options chain shows Max Pain at 16.00.  Short gamma runs from 12.00 to 15.00.  Long gamma may start at 21.00 to 23.00.

ZeroHedge remarks, “Vol keeps resetting lower into this Spot Equities Index rally (VIX at levels which would be a fresh “post COVID closing low”)…

…and as is so often then the case, a “virtuous feedback loop” ensues: the persistent absolute wreckage in realized Vol allows for mechanical “VaR-up”, as Exposures are bought back and price-momentum / trend re-builds to the Upside…

Nomura’s Charlie McElligott estimates a cumulative $notional of Equities purchased across “Systematics” Vol Control + CTA Trend ~+$104B since early November as a proxy.

This all fits with his warning of an “equity upside pain-trade scenario into year-end”.


TNX is revisiting the trendline at 41.50 in a normal retracement, testing the support there.  Once the rally resumes, it may continue to the first week of January.  The target for this rally may be the Cycle Top at 49.58.   The ultimate target for Wave (5) may be near 5.3% or higher.

ZeroHedge observes, “he Federal Reserve’s dot plot is likely to push back on the notion of deep rate cuts priced in by the markets for 2024, spurring a selloff in Treasuries.

The median of policymakers on Wednesday may show the funds rate for next year at 4.9%, implying 50 basis points of rate cuts. That would fly in the face of market pricing for a reduction that has swung between 110 basis points and 125 basis points over the past few days.

The yield on two-year Treasuries climbed more than 12 basis points at the end of last week after the jobless rate for November, defying predictions, headed lower to 3.7%, hovering near the lowest it has been in decades. A dot plot along the lines portrayed above would send two-year Treasury yields higher toward 5%.”


USD futures plunged to 103.28 this morning.  Mid-Cycle support may act to reverse this probe, since the Cycles Model suggests the rally may resume to the end of the year.  The Cycle Top at 106.86 may be the target.


Crude oil futures continue tis decline this morning to 67.72.  The Cycle Bottom at 66.21 may be the intended target.  However, the trendline at 63.57 may be at risk of being broken, which may change the near-term outlook.

ZeroHedge comments, “Oil plunged again today, on pace for its longest weekly losing streak since 2018, after inflation data prompted some fears that The Fed will not be cutting rates as soon as many hoped.

Traders are worried that the Fed does not have inflation under control and will have to keep the foot on the accelerator when it comes to interest rates, said Phil Flynn, an analyst with the Price Futures Group.

The oil market shrugged off reports from The BBC that Yemeni’s Iran-backed Houthi rebels hit a Norwegian tanker with at least one missile, leading to a fire.

“Add a drop off in China’s crude imports to 5-month lows to our current lull in refined products demand, we’re seeing an increasingly well-supplied crude market,” said StoneX’s Kansas City energy team.”


Gold futures dropped even lower to 1988.00 this morning as the decline continues beneath Intermediate support/resistance at 2002.00.  The decline may continue to the year-endwith the neckline at 1823.50 in sight.  Should that be brokien, further declines may be in store.


Posted in Published | 2 Comments

December 12, 2023

8:00 am

Good Morning!

NDX futures made an overnight high of 16270.70 as it relentlessly powers higher on day 274 of the current Master Cycle.    The liquidity hose is running dry with buybacks ending this week.  It will all be on the backs of retail investors for the next  five weeks.  CPI is being announced this morning and the FOMC is meeting with their report due Wednesday afternoon.  A reversal is expected.

Today’s options chain shows Max Pain at 16225.00.  Long gamma may begin at 16250.00 while short gamma starts at 16200.00.

ZeroHedge remarks, “Losing the rates connection?

NASDAQ has traded in close tandem with rates since July. The latest “mini” decoupling is noteworthy…

Source: Refinitiv

Not your normal recovery

“Up until recently, the path toward a new SPX record conformed with the average recovery looking back at all of the corrections and bear markets through the 50s. However, the rally in Nov changed things. Typically, the recovery after a 25% drawdown starts to lose steam after Y1 (+9% avg.), with returns over the 2Y matching the same +9% pace. At present, we are up ~30% from when we first broke the -25% boundary, and the current 484 days since we last saw an new ATH is ~half a trading year ahead of when the historical average suggests we might be ‘due’ for one”


SPX futures are still climbing, currently at 4631.00.  Should the rally persist, the Cycle Top may be the target at 4675.23.  However, the Cycle is stretched to an extreme and may be susceptible to a sudden reversal.

Today’s options chain shows possible Max Pain at 4620..00.  Long gamma starts at 4625.00 with an outlier at 4600.00.  Short gamma may begin at 4615.00, becoming strong beneath 4600.00.

ZeroHedge reports, “S&P 500 futures were little changed as markets enter the first of the two last big days of 2023, with CPI on deck today and the FOMC decision due tomorrow. As of 7:55am ET, S&P futures were up 0.1% to 4,683, trading in a very tight range overnight as equity traders were reluctant to make big bets ahead of this week’s heavy load of economic data and interest-rate decisions, Nasdaq futures gained 0.3% ahead of the November inflation report; The Bloomberg dollar index slipped 0.3%. Treasuries rose across the curve, with 10-year yields falling four basis points to 4.19%. The latest NY Fed survey showed a decline in year ahead inflation expectations, dovetailing the Univ. of Michigan print on Friday; today is all about the CPI.


VIX futures are hovering near the low.  The Master Cycle appears to have been made last Friday.  However, there may be room for another probe lower, as the structure may be incomplete.

Tomorrow’s options chain shows Max Pain at 16.00.  Short gamma extends from 12.00 to 15.00.  Long gamma may begin at 21.00.


TNX futures had been drifting lower, to 41.42 before the CPI report snapped it higher.  This may have been anticipated by the Cycles Model which had called for a burst of trending strength early this week.  TNX had made its Master Cycle low last Thursday and is due to rise until early January.

ZeroHedge observes, “In today’s second Treasury auction (as a reminder, thanks to the FOMC we are on a very truncated issuance schedule this week), and just 90 minutes after an ugly 3Y sale, moments ago the Treasury sold $37BN in 10Y paper in the form of  a 9 Year 11-Month reopening of Cusip CJJ1, which was almost as ugly as the day’s earlier auction.

The last 10Y auction of the year priced at a high yield of 4.296%, which while a notable drop from last month’s 4.519% and the highest since September’s 4.289%, also tailed the When issued 4.282% by 1.4bps, which as shown below, was the 3rd consecutive tailing 10Y auction, and the 9th tail in the past 10 auctions. An even more remarkable statistics, is that since the end of 2021, there have been 24 10-Year auctions, of which only 4 have not tailed, suggesting that demand for benchmark US paper is in a slow-motion collapse.”


USD futures sank to 103.07 and challenging mid-Cycle support at 103.34 before bouncing back above that support on the CPI report.  The Cycles Model calls for a renewal of trending strength this week.


Crude oil has declined this morning to 69.53.  It may be testing its Cycle low.  The likelihood is that last week’s low may remain intact as WTIC emerges from an oversold condition.  The Cycles Model infers that the new trend may be strengthened by the end of the week.


Posted in Published | 1 Comment