
8:25 am

Good Morning!
NDX futures declined to 16423.00 thus far, as it searches for Intermediate support at 16242.00. A bounce may normally occur at or above Intermediate support. However, should it decline through that support, the 50-day Moving Average lies at 15738.76 as the next level. The average target for this decline may be the October low at 14058.30. WE will monitor the decline to ascertain whether it goes deeper.
Today’s options chain shows Max Pain at 16575.00. Long gamma may start at 16000.00 while short gamma begins at 16570.00. Short gamma may rule the day.
ZeroHedge remarks, “The big short is now a big long
What a difference a year makes. Non dealers exposure in US equities is at the highest levels in “forever”.”


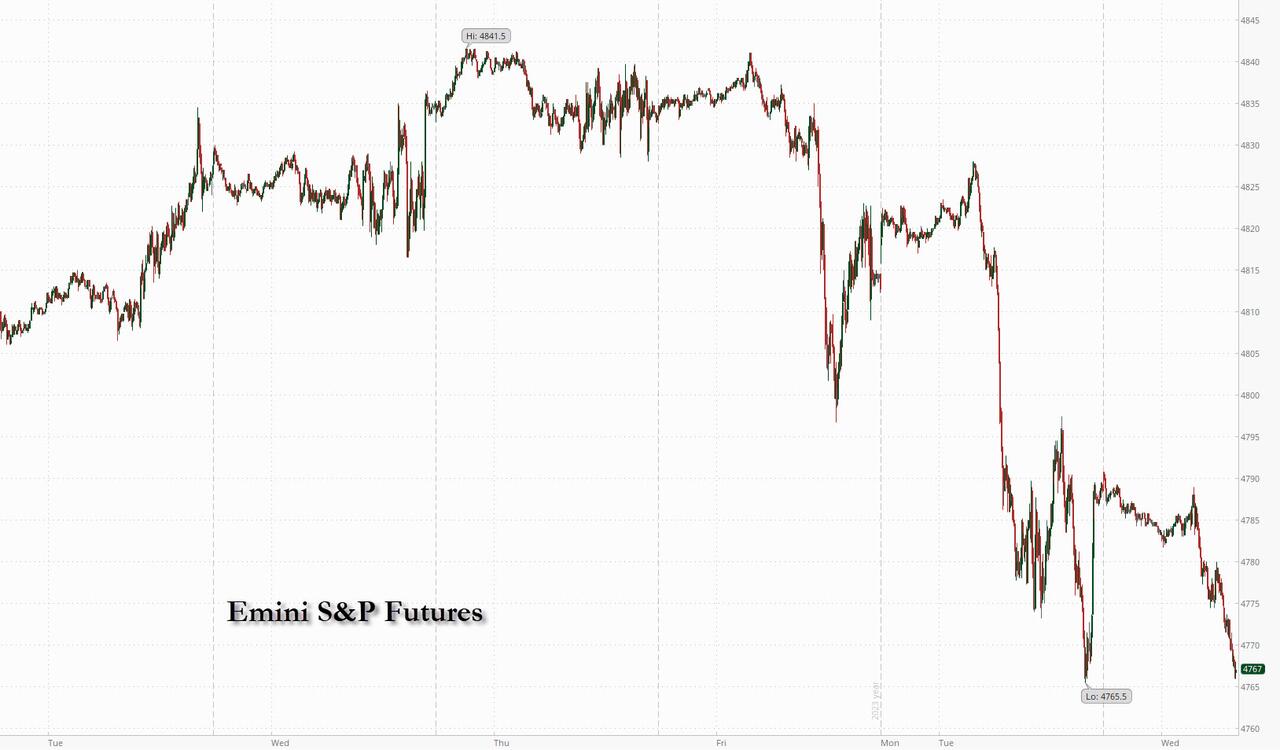
SPX futures declined to 4720.50 this morning as larger losses are consolidated. Overhead resistance is at 4750.00 where the short-term trendline, the 1987 trendline and the Cycle Top all reside. Should the decline continue, the next level of support is the Intermediate level at 4626.51 beneath which the sell signal is confirmed. The Cycles Model indicate that the next two weeks may be particularly bearish. The normal target may be the October low at 4103.78. However, the decline may go lower.
Today’s options chain shows Max Pain at 4745.00. Long gamma dominates above 4750.00. Short gamma reigns beneath 4735.00.
ZeroHedge reports, “The risk off tone that has dominated the 2024 mood so far extended into a second session, and this time in addition to selling in both stocks and bonds, we are seeing crypto join the fray (the reason being attributed to this tweet). US equity futures and global market are experiencing some selling and profit-taking after the recent torrid Santa Rally, as we enter the first of several important macro data days: today the focus will be on ISM Mfg report and the December Fed Minutes. Interestingly, despite the weakness, yesterday’s US session saw a $7.8bn MOC to buy, and in its market intel note this morning (available to pro subscribers), JPM writes that for all the weakness “it does feel like there are buyers below current levels as the SPX struggles to breach 4,800.” That said, as of 7:45am, S&P futures were down 0.4% to 4,765, near yesterday’s session lows; Nasdaq futures dropped 0.7%. Bond yields are higher as we see bonds come for sale alongside stocks globally. 10Y Treasury yields rose to 3.98%, the highest since mid-December and a move above 4% will likely add more volatility to equity markets; the USD extended its gains; Brent jumped to session high around $77, rising form a sub-$75 low after Libya’s Sharara oil field unexpectedly shutdown amid mass protests, removing some 265K bpd in daily output although commodities overall remain mixed on concerns about China’s economy.”

VIX is consolidating beneath the 50-day Moving Average at 14.49. Yesterday was a wake-up call with the sudden realization that stocks don’t only go up. A confirmed buy signal lies above the 50-day.
Wednesday’s op-ex shows Max Pain at 13.50. Short gamma rules between 12.00 and 13.00. Long gamma resides above 15.00 and runs to 30.00.

TNX rose to 40.08 this morning as rising rates attract attention. The Master Cycle low on December 27 gave traders a reversal and aggressive buy signal. Unfortunately, most do not see this as a positive because TNX is beneath the 200-day Moving Average at 40.40. Once above it, however, investors may take appropriate action.
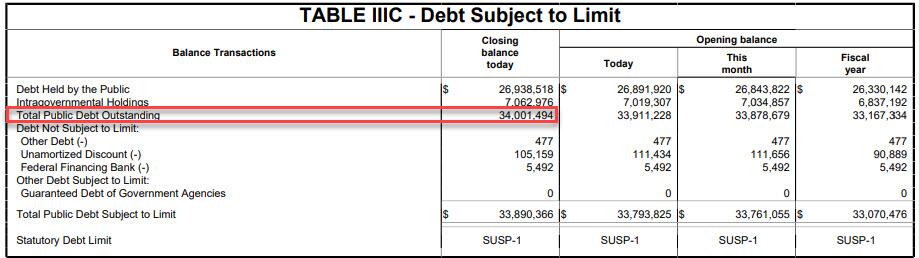
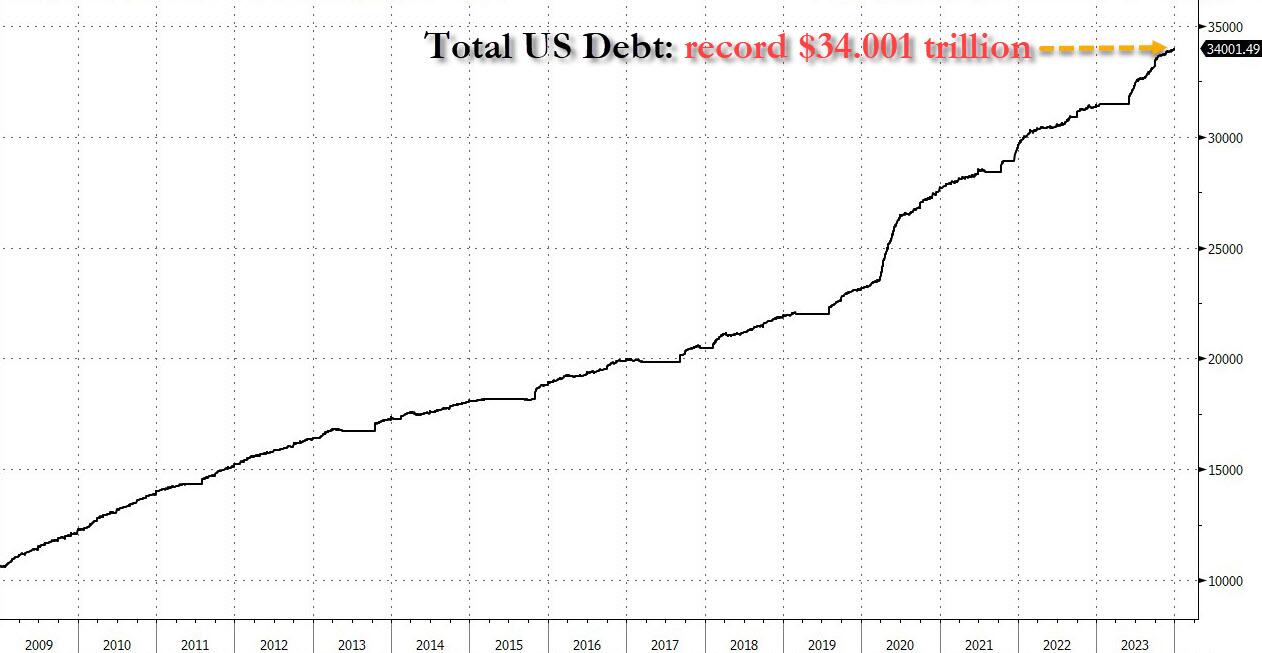
ZeroHedge observes, “The US Treasury has a morbid habit of revealing big, round numbers of debt around major calendar milestones, and the new 2024 year was no different because according to the latest Treasury Daily Statement published after the close today and reflecting the US Treasury’s financial statements as of Dec 29, 2023, total US debt as of the end of the year was – drumroll – just over $34 trillion for the first time ever, or $34,001,493,655,565.48 to be precise.
Since this is a topic we have covered more or less daily for our 15 year existence, we don’t need to say much suffice to show a chart of total US debt since zerohedge launched in Jan 2009, when total US debt was only $10.6 trillion. We sure have gone a long way since then.”

USD cash may be approaching Intermediate resistance at 102.82 after exploding out of its Master Cycle low on December 28. It is on an aggressive buy signal with confirmation of its buy at Intermediate resistance.