May 21, 2021

6:55 am

Good Morning!

SPX futures made a low of 4151.62 in the overnight session and is now hovering near 4165.00.  A view of the options chain reveals 1223 net put positions at 4175.00 while the strike at 4150.00 is now at breakeven.  Wave (c) of 2 equals wave (a) of 2 at 4178.00, so we may see a quick spike at the open.  Should the SPX sell of at the open, the dealers may have to sell up to $5.088 billion SPX contracts by the end of the day to gamma hedge the net put positions in SPX contracts.

Puts predominate the SPY options at 415.00 and below, suggesting that SPY must maintain its current position near 415.00 to the end of the day.  This is the Max Pain location where neither puts nor calls make money (collectively).  Equities are on tenderhooks today and the best the dealers can hope for is for the market to do nothing.

ZeroHedge reports, “S&P index futures ticked higher on Friday, alongside European and Asian stocks, and building on Thursday’s strong gains as bullish investor sentiment got a boost from strong global PMI surveys while reflation fears faded. Oil climbed while treasury yields and the dollar were little changed. Dow e-minis were up 150 points, or 0.4%, S&P 500 e-minis were up 18 points, or 0.43%, and Nasdaq 100 e-minis were up 51 points, or 0.4%.

Wall Street’s rebounded on Thursday following a three-day slump after data showed the fewest weekly jobless claims since the recession in 2020. The risk recovery was led by FAAMG gigacaps as inflation fears appear to have now peaked, putting the Nasdaq on course to snap a four-week losing streak as worries over higher interest rates weighed on the tech-heavy index.”


VIX futures are consolidating after options expiration on Wednesday.  It must stay at a low level today to support a calm equities market.


NDX futures are hovering near 13500.00 as options expiration nears.  Puts dominate the options at 13525.00 and below, while calls dominate above that level.  A quick spike to 13525.00 at the open may alleviate any pain to the dealers.

QQQ options show 12399 net put contracts over calls at 330.00.  QQQs are hovering near 328.00 as I write.  Should an accident happen, $4.1 billion of QQQ shares would need to be sold to cover that position alone.

ZeroHedge observes, “Nomura’s Charlie McElligott summarized things heading into the weekend perfectly for traders: “Op-Ex tomorow matters ‘bigly’ for Equities.

Critically, he explains, there remains likelihood of continued “chase-y” moves in both directions on dealer delta hedging due to the magnitude of the positioning out there:

  • Latest estimates show 31% of $Gamma set to drop-off in SPX / SPY consolidated options after Friday, but far more notably with 50% in QQQ and 55% in IWM ready to roll-off post Op-Ex.
  • SPX largest $Gamma strike is 4100 ($4.1B), and from there it’s the 4050 strike ($3.0B) to the downside and 4200 ($2.8B) and 4150 ($2.5B) to the upside.
  • Currently versus spot, we see SPX “short gamma (4175 flip), LONG delta (4096 flip)”; QQQ “short gamma ($326.25 flip), short delta ($329.77 flip)”; and IWM, “short gamma ($224.22 flip), short delta (224.66 flip)”.
  • Again, the most extreme reads are in legacy “duration-sensitives” macro-regime of “secular growth” Nasdaq / QQQ, where (negative) $Gamma of -$884mm is 0.7%ile since 2013, and where (negative) $Delta is -$18.7B / 2.0%ile since ‘13.

Nasdaq remains the most extremely positioned…”


USD futures made a new low at 89.65, extending the Master Cycle low to day 262.  Should the stock and bond markets remain calm today, so will the USD.  However, both are due for a reversal and a pickup in the USD may signal money flows to the USD as a safe haven.


TNX pushes lower, but still above Intermediate-term support at 16.13.  The period of weakness is about to expire, with strength roaring back for the next two weeks, according to the Cycles Model.


Posted in Published | 3 Comments

MAY 20, 2021

3:05 pm

SPX may have stalled at Short-term resistance at 4155.54 and mid-Cycle resistance at 4154.80.  The reason may be that most investors went short on the way down at these levels and now the short-covering rally has run out of fuel.  There may not be any appetite for any more risk.  The hourly Cycle stopped at hour 63 instead of hour 60.2.

ZeroHedge notes, “As discussed earlier, a quick look at the “gamma tilt” in markets, suggests that there is more downside risk than upside ahead of tomorrow’s sizable op-ex, which sees roughly 30% of dealer Gamma drop-off in SPX / SPY consolidated options, but even more notably, half to gamma in QQQ and 55% in IWM is also about to roll-off. Here are the details on the various gamma strikes and sizes courtesy of Nomura’s Charlie McElligott who notes that the largest SPX strike is at 4100 ($4.1B), and from there it’s the 4050 strike ($3.0B) to the downside and 4200 ($2.8B) and 4150 ($2.5B) to the upside.”

Regardless of options expiration, or maybe because of it, a repo crisis is looming.  ZeroHedge reveals, “As expected, today’s overnight reverse repo facility usage soared above $300 billion, surging $57BN from $293BN on Wednesday to a whopping $351BN as 48 counterparties parked their reserves with the Fed in exchange for a 0.000% rate.

The surge in usage pushed the total to not only well above the Covid crisis high of $285BN, but was the fifth highest on record!”


10:05 am

SPX has risen to the trendline thus far.  We may see a further extension to the combination Short-term resistance and mid-Cycle resistance at 4153.60.  Although not a new all-time high, this may also qualify for a Master Cycle high on day 260.  The alternate would be the May 7 high at 4238.04 on day 247.

The NDX may also rise to its 50-day Moving Average at 12428.00 for its Master Cycle high.  The daily Master Cycles, which I track, are subservient to the weekly and monthly Master Cycles, so the alternate Master Cycle high would be the May 7 high at 13814.00.


7:45 AM

Good Morning!

The battle for supremacy in the options market rages.  I dove into the NDX options chain to discover that there were 251 contracts of call open interest (OI) vs 192 contracts of put OI.  These contracts are very large and are the domain of institutional investors.  However, the OI in QQQ calls is 83,658 contracts vs the OI in puts is 152,281 for the May 21 contract.  These are cumulative contracts based on 4 strikes on either side of yesterday’s close.  Dealers have no wish to pay on these options, so they will bid up the price to the MAX PAIN area, where the least is paid on either side (Delta Hedged).  That is what is happening this morning.

After a brief decline, NDX futures are back to breakeven this morning.  The closer the NDX gets to the 50-day Moving Average, the less the dealers pay at expiration.  What they do not understand is that the first hourly Cycle is 60.2 hours in duration, of which 60 hours have transpired.  In other words, the rally may have approximately .2 of an hour to go.  Should selling resume this morning, dealers will have to Gamma Hedge, meaning they must sell the underlying futures to cover the put options’ potential payout.


SPX futures are hovering tantalizingly close to yesterday’s closing price after an overnight decline.   Should the rally resume, an effort may be made to close the gap at 4127.83 or the trendline at 4150.00.

Open Interest in SPX calls (within 4 strikes on either side of yesterday’s close) for May 21 stand at 23,932 while put OI stands at 36,689.  MAX PAIN stands near 4200.  SPY OI stands at 122,107 calls and 196,979 puts.  Should the equity indices decline beneath the 50-day Moving Average, it could turn into a panic as dealers must cover a huge number of maturing puts by Friday.

ZeroHedge reports, “While a far cry from yesterday’s morning rout, global stocks struggled for traction on Thursday after a jittery session on Wall Street where cryptocurrencies crashed and a hint of tapering talk from the U.S. Federal Reserve drove selling in the bond market and lifted the safe-haven dollar.

S&P futures dropped overnight for the 4th straight session after minutes from Fed’s meeting last month showed some officials were open to a debate at “upcoming meetings” on scaling back bond purchases if the U.S. economy continued to progress rapidly, while the ongoing rout in cryptos has not helped sentiment, and just like cryptos futures rebounded from their worst levels (yes, we once again live in a bizarro cojoined world where moves in cryptos move the broader market).

At 7:30 a.m. ET, Dow e-minis were down 100 points, or 0.32%, S&P 500 e-minis were down 8.25 points, or 0.20%, and Nasdaq 100 e-minis were down 7 points, or 0.06%. Treasuries were flat, the dollar and oil dropped.”


VIX futures eased back down to breakeven after spiking to 23.50 in the overnight market.  The VIX Master Cycle runs until June 1-2.  That gives this Cycle another 8.6 days to run its course.


TNX appears to be using Intermediate-term support at 16.49 as support.  It has approximately two weeks to the close of the Master Cycle.  This has the appearance of the calm before the storm.


USD futures tumbled to 89.9, but not to a new low.  This may be a normal retracement which lets us know that a further rally above yesterday’s high at 90.28 gives us a buy signal.


Posted in Published | 2 Comments

May 19, 2021

3:25 pm

BKX bounced off its trendline just above Intermediate-term support at 126.27.  There is some evidence that this may be the last bounce before oblivion.

ZeroHedge reports, “In today’s FOMC Minutes there was a brief section that received little focus amid the broader analysis of the Fed’s tapering, inflation language, yet which could be far more important in coming weeks in light of the violent move higher in overnight reverse repo usage.

This is what the Fed said in its discussion of money market rates and the Fed’s balance sheet:

Reserve balances increased further this intermeeting period to a record level of $3.9 trillion. The effective federal funds rate was steady at 7 basis points. However, amid ongoing strong demand for safe short-term investments and reduced Treasury bill supply, the Secured Overnight Financing Rate (SOFR) stood at 1 basis point throughout the period. The overnight reverse repurchase agreement (ON RRP) facility continued to effectively support policy implementation, and take-up peaked at more than $100 billion. A modest amount of trading in overnight repurchase agreement (repo) markets occurred at negative rates, although this development appeared to largely reflect technical factors. The SOMA manager noted that downward pressure on overnight rates in coming months could result in conditions that warrant consideration of a modest adjustment to administered rates and could ultimately lead to a greater share of Federal Reserve balance sheet expansion being channeled into ON RRP and other Federal Reserve liabilities. Although few survey respondents expected an adjustment to administered rates at the current meeting, more than half expected an adjustment by the end of the June  FOMC meeting.

This language confirms what we said last night when we discussed the spike in overnight reverse repo usage as part of the coming QE endgame…

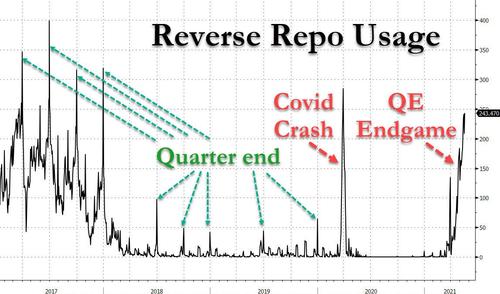
… and where we quoted from former Fed staffer Zoltan Pozsar, who warned that “The heavy use of the o/n RRP facility tells us that foreign banks too are now chock-full of reserves.”


3:10 pm

It appears that the first 8.6 days will not end at a low.  Instead, the SPX and NDX appear to be retesting the trendline that was just broken and fill the open gap.  That is a high probability sign that the decline may resume tomorrow morning.  That conflates with the indications of an extended decline.  Stay short.  This will get the maximum investors wrong-sided.

ZeroHedge remarks, “Update (1430ET): “You can’t make this shit up,” was the response we got when calling around to desks about the sudden utter panic-bid reversal from the ‘expected’ drop in stocks after The Fed began to hint at taper talk…

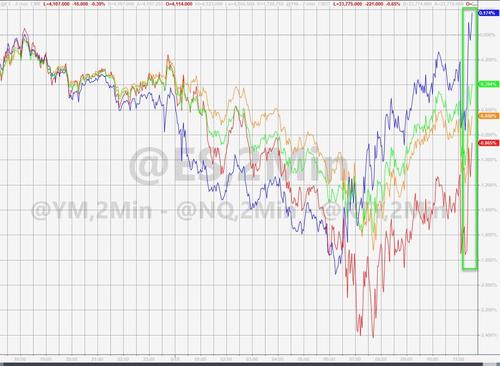
Yes, the Nasdaq is now well in the green for the day (after being down over 2%) and despite bond yields and the dollar remaining higher post-Fed.”


11:10 am

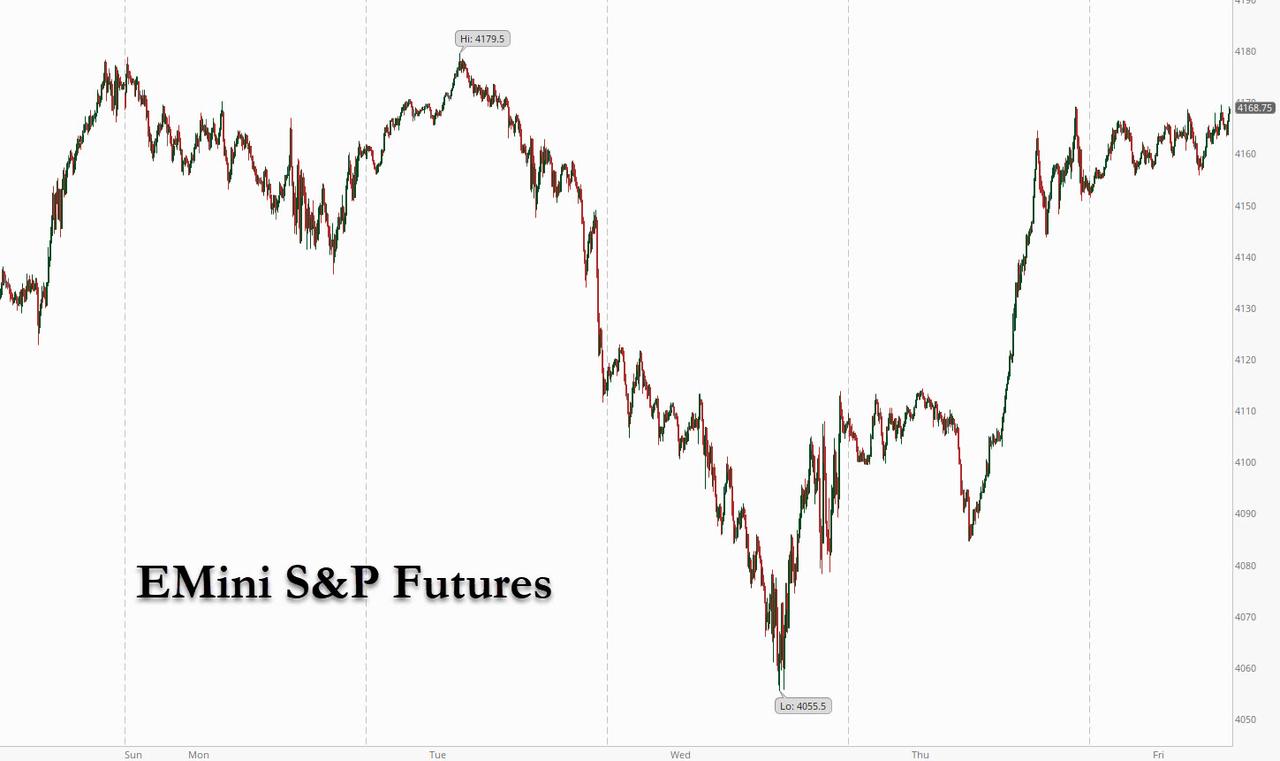
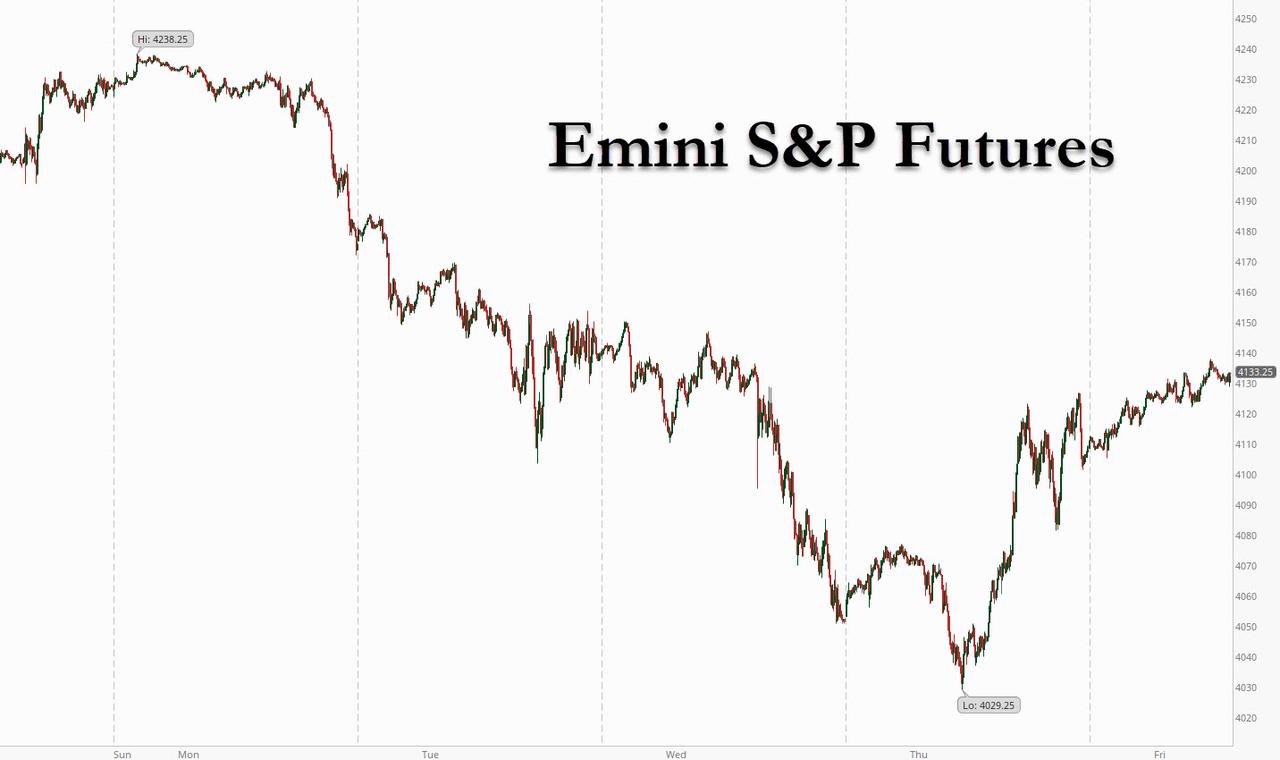
SPX challenged the 50-day Moving Average at 4168.82 before bouncing.  It is likely to rise back to the gap opening at 4098.45 before resuming its decline.  The low at the close may be near 4000.00.  It may be wise to take some of your short position off the table as the close will make an 8.6-day decline and there is likely to be a sharp rally into Options expiration.  Wall Street does not wish to pay either the longs or the shorts.  We could see a rally back to 4150.00 to reach neutral ground for options expiration.


11:00 am

WTIC futures have fallen beneath their Intermediate-term support at 62.88 and the 50-day Moving Average at 62.84 to give a confirmed sell signal.  The Cycles Model suggests the next Master Cycle low may be on June 3.  The pattern grows.

ZeroHedge remarks, “Much like the rest of the world’s assets (except gold), oil prices are plunging this morning as broader markets tumbled on inflation concerns (and liquidity-based stress from crypto/tech carnage) and talks over the Iran nuclear deal add to concerns over increased supplies as traders eye the potential for a recovery in the nation’s exports. That comes as the OPEC+ alliance loosens output curbs, and after U.S. crude stockpiles expanded. The rout in stocks is adding to investor caution. Additionally, a Chinese tax on three oil-related items that begins next month could shift crude flows and reduce some product exports.

This week’s data will likely be exaggerated by the impacts of the Colonial Pipeline closure.”


9:00 am

BKX appears to be in the final days of its Master Cycle (high).  Yesterday may have been the peak on day 257, but confirmation is needed.  A decline beneath the 6-month trendline and Intermediate-term support at 125.96 gives us a sell signal.  This is an extended Master Cycle so the new MC is due to bottom on June 9.  Liquidity ay disappear quickly, so make sure that you are positioned for this event.

ZeroHedge remarks, “One week ago we highlighted a growing challenge facing the US financial system, and especially the Fed: as a result of too many reserves being injected into the system, an extension of the Fed’s relentless monetization of $120BN in debt each and every month, not only had we just seen two 0.000% 4-week Bill auction, but overnight funding rates had collapsed with the fed funds rate well below the mid-point of the fed funds target range while the Repo GC rate is at zero; often trading negative. As a result of these zero percent interest rates, billions of dollars of cash were being pushed into the Fed’s RRP facility as no rational actor would take on counterparty risk if they could get the exact same rate (0.0%) when transacting with the central bank.

As Curvature’s Scott Skyrm put it, “while this is a delightful case of deja vu irony – the Fed is taking Treasurys out of the market through QE purchases and putting them right back in via the RRP – it is also distorting the Repo market, and although the Fed can fix this aberration by hiking the IOER or RRP rates, it has so far refused to do so.”

And speaking of reverse repo usage, its use of the facility has never been this high outside of quarter-end turns, or last year’s covid disaster.”


8:45 am

Despite the drought covering the western half of the United States, shortages of food in China and now a major drought in South America, GKX may still succumb to liquidity being drained from the markets.  The reason I say that is the next Master Cycle (low) is due on June 3.  The target is a retest of the Head & Shoulders neckline at 410.00.

Does anyone see a pattern here?

ZeroHedge reports, “Global crop and food prices are skyrocketing to multi-year highs, and the culprit could be due to La Nina, a weather pattern characterized by the cooling of the equatorial Pacific and triggers atmospheric shifts that cause droughts in some regions of the world and wetter conditions in others. The prospect of a severe drought in the US has already be outlined in previous notes. Now it appears the worst drought in 20 years has struck agricultural rich Brazil.

Over the last month, Brazil has been faced with drought during its traditional rainy season.

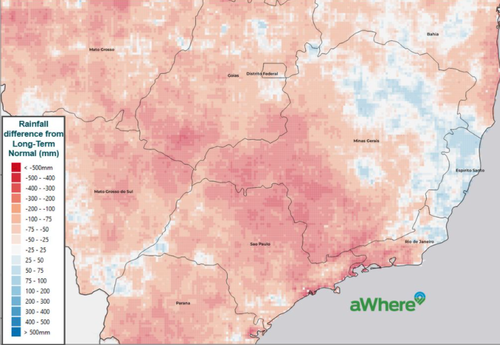
“Soils are parched, and river levels are low in the nation’s Center-South region, a powerhouse of agricultural output. The drought is so severe that farmers are worried they’ll run out of the water reserves that help keep crops alive over the next several months, the country’s dry season,” said Bloomberg. ”


7:40 am

Good Morning!

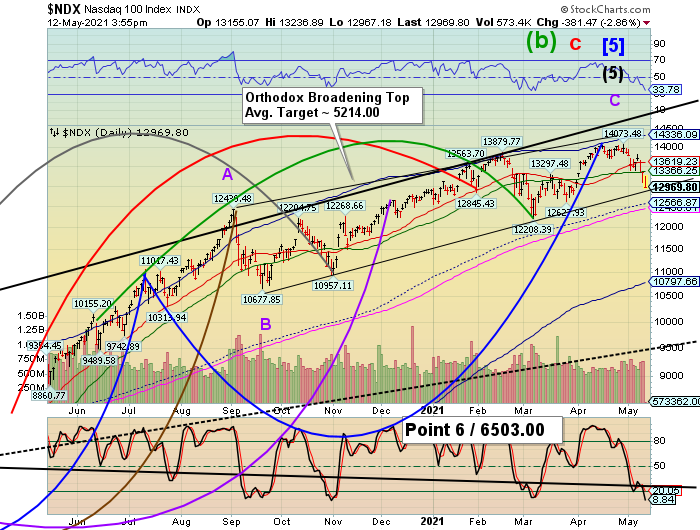
NDX futures are challenging the Ending Diagonal trendline at 13000.00 this morning.  Once accomplished, it’s immediate target is 12750.00 (at a minimum) to complete a leading Diagonal Wave 1.  Today is day 259 of the Master Cycle and a likely place for a bounce.  The 200-day Moving Average is at 12500.00, so there may be a little more depth to this decline.  Should the bounce occur, the target may be the 50-day Moving Average at 13370.92.

There is an alternate view that on May 12, the Master Cycle may have been completed on day 252 at 12967.20.  Should that be the case, the decline may get out of control.  Should a bounce occur from a lower level, the Ending Diagonal rendline may be the limit to the retracement.


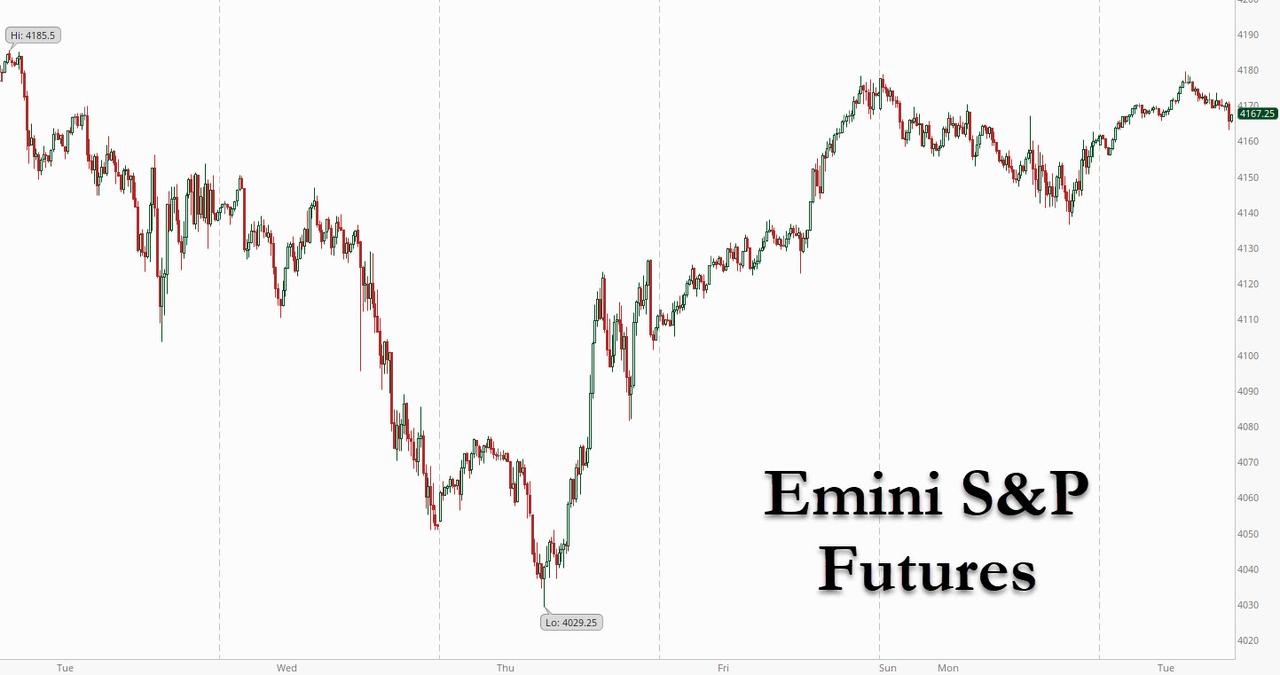
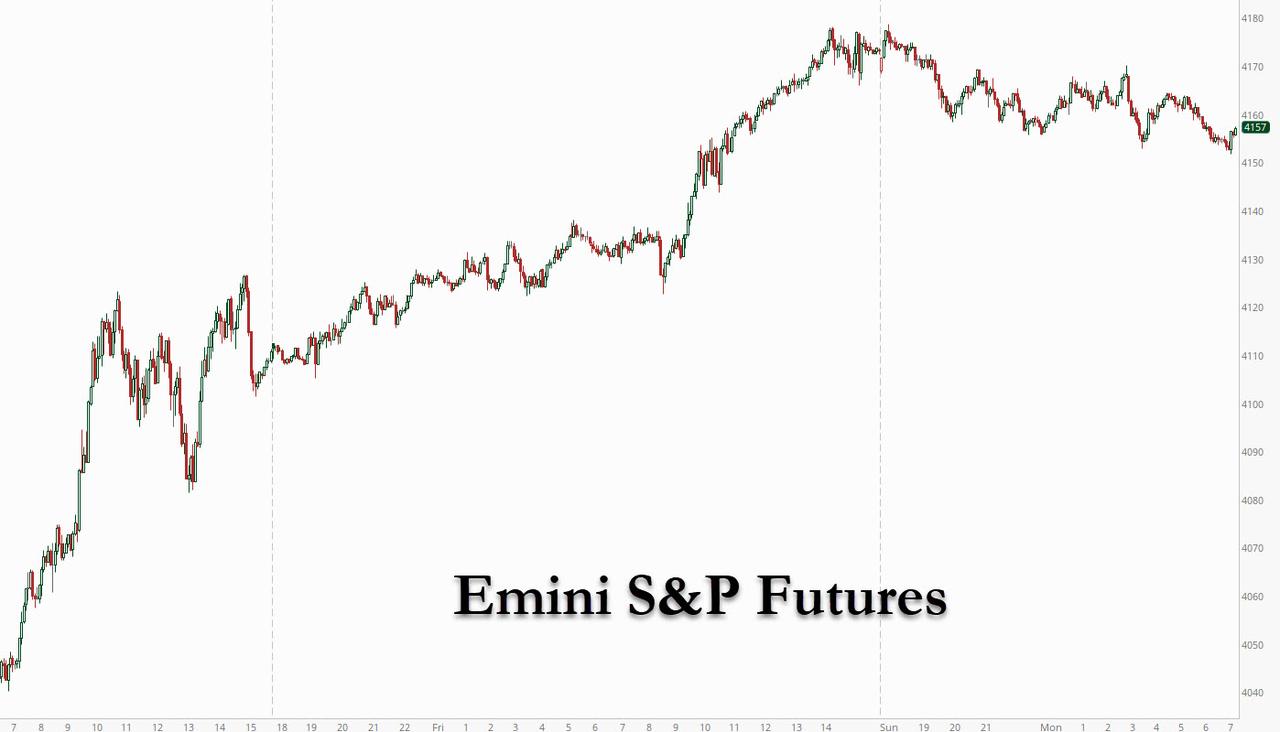
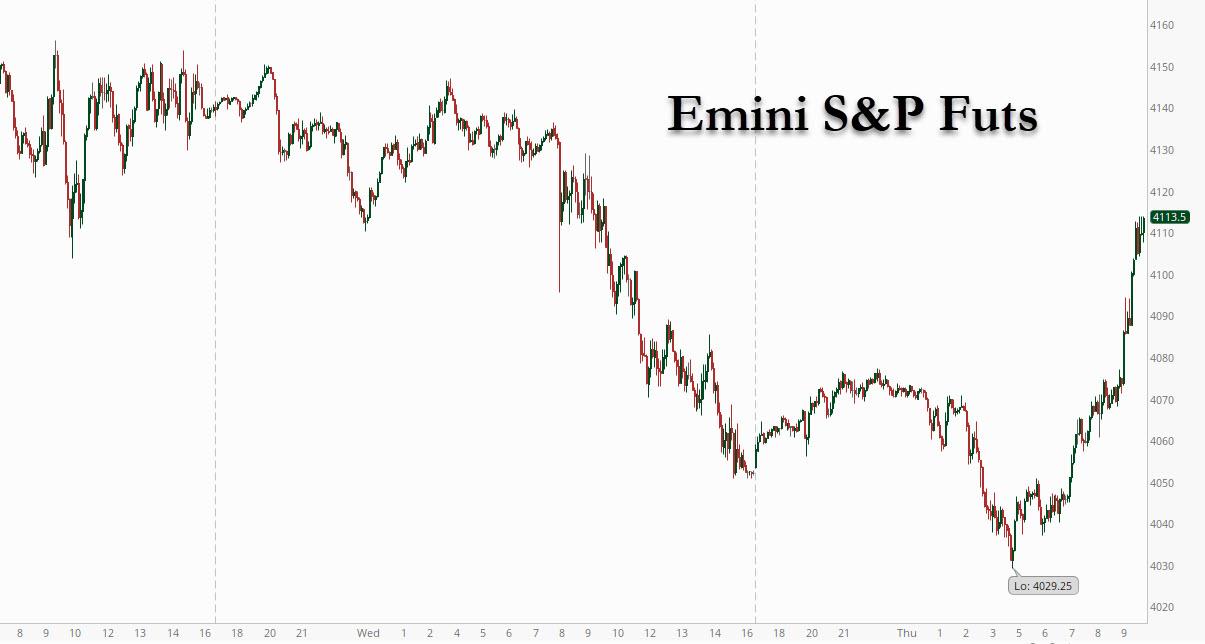
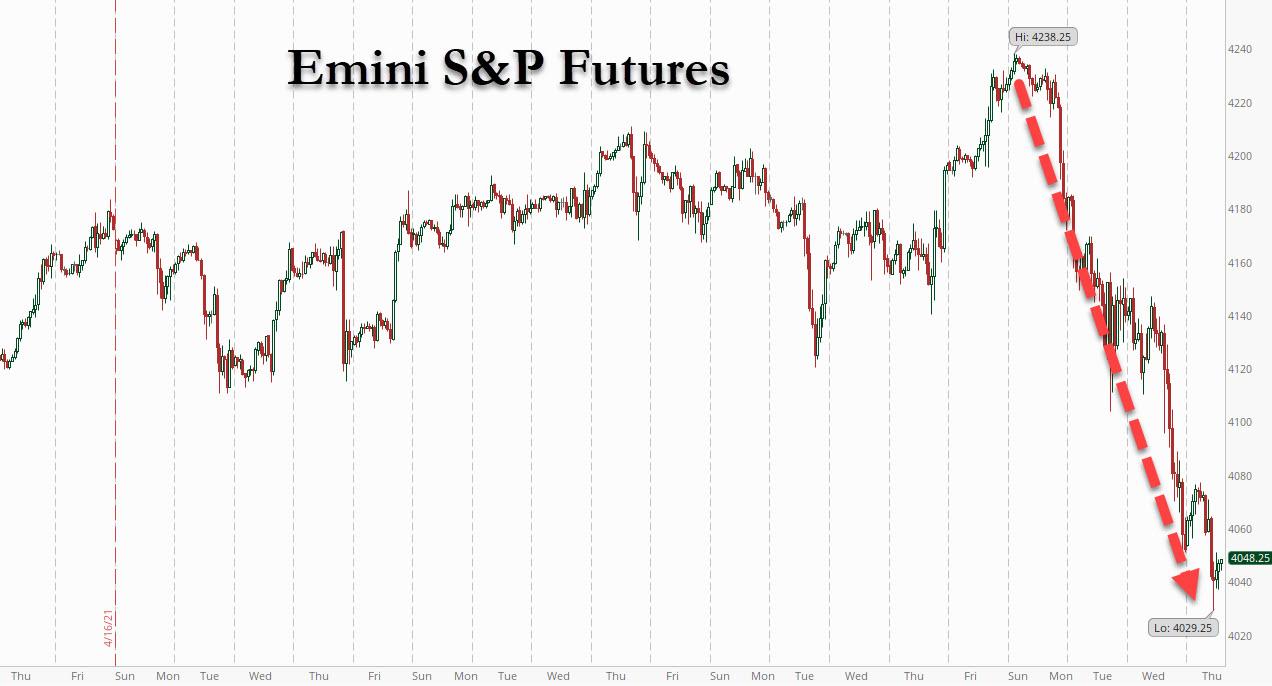
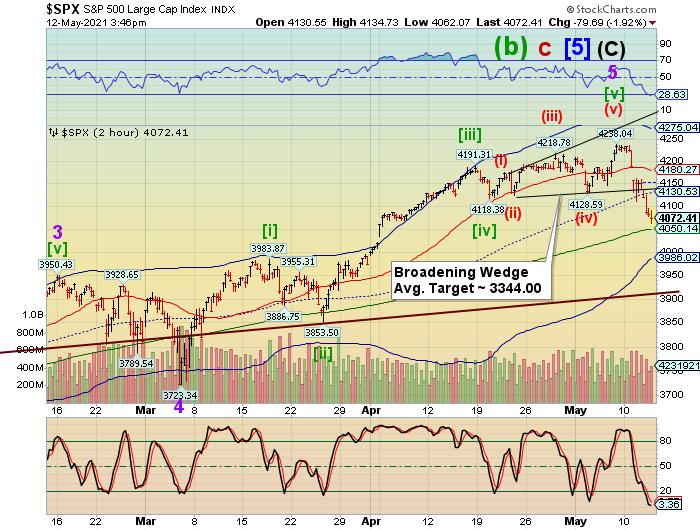
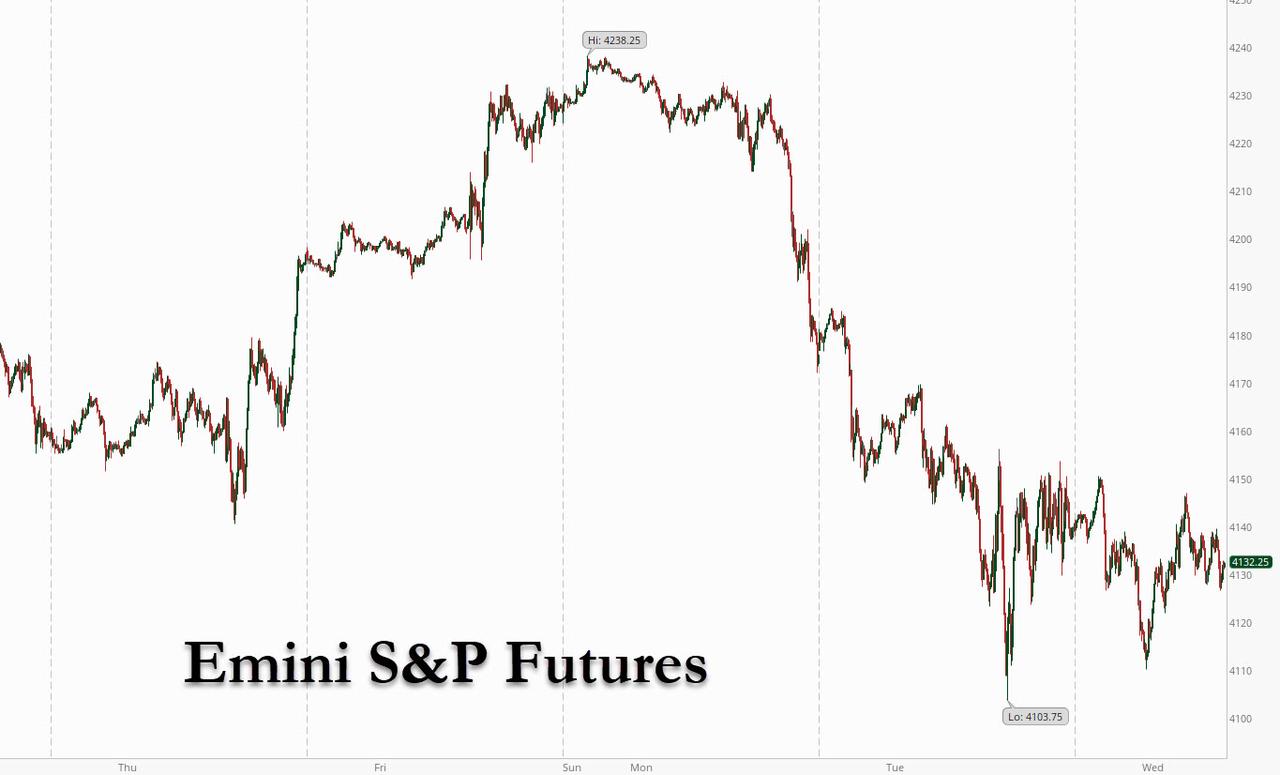
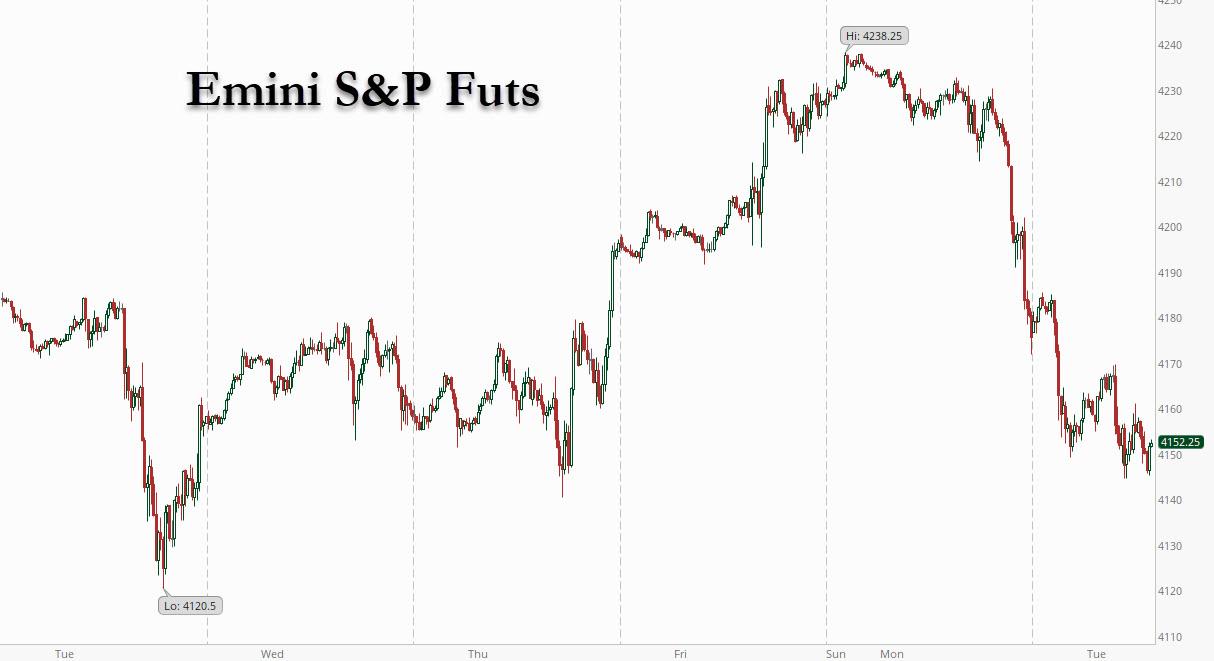
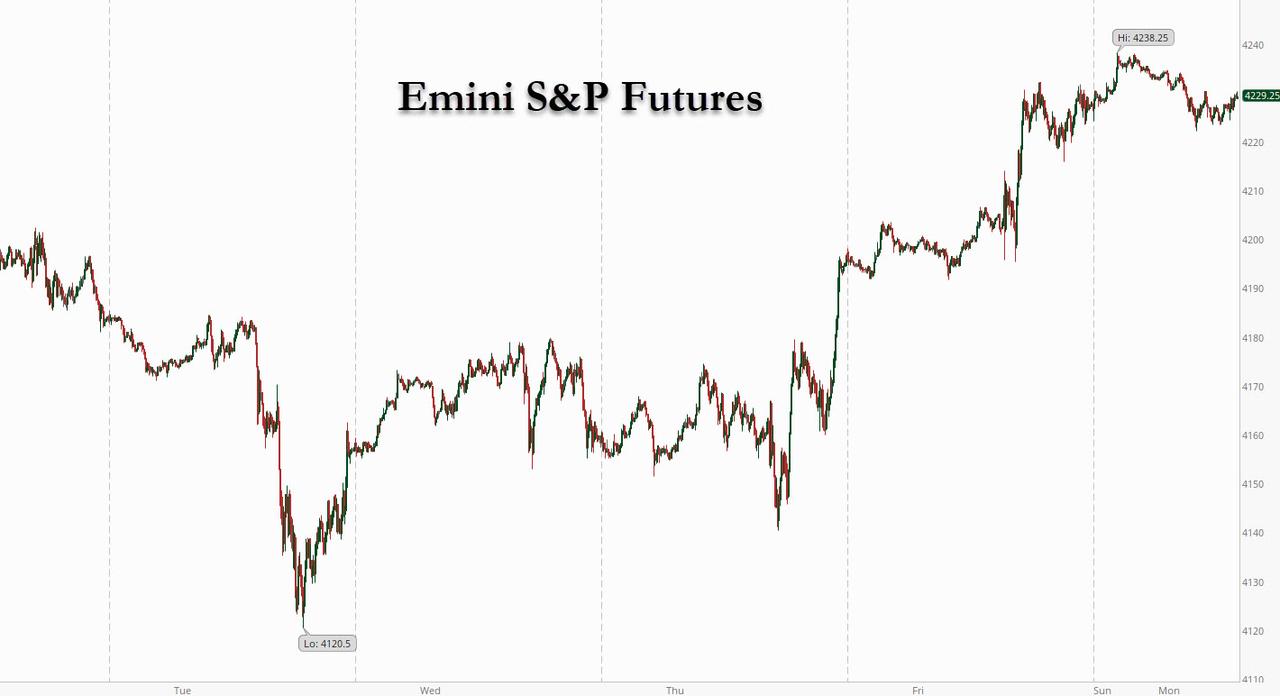
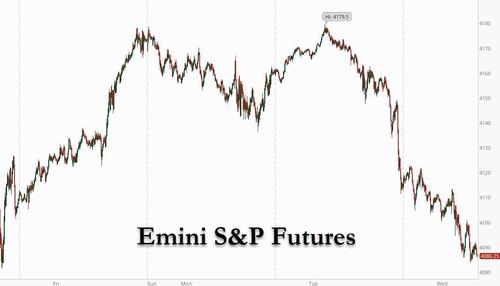
SPX futures may be testing the 50-day Moving Average at 4065.33 this morning as it hovers just above it as I write.  The immediate target appears to be the upper trendline of the 2 1/2 year old Orthodox Broadening Top.  There are two more Broadening Wedges within the 4-month chart that give the decline an abundance of targets.  For the moment, I am leaving the nearest target for reference.

There is an argument that the Master Cycle may have topped out on May 7 at 4238.04 (day 247).  The reason for being early is that a Monthly Master Cycle was due on May 8 that matched up with March 9, 2009 and March 23, 2000.

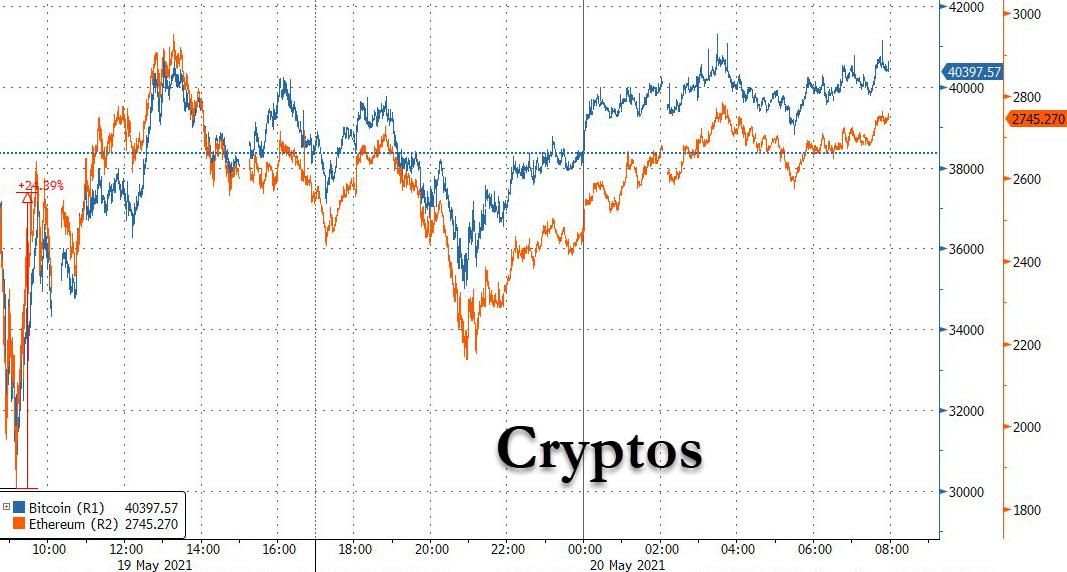
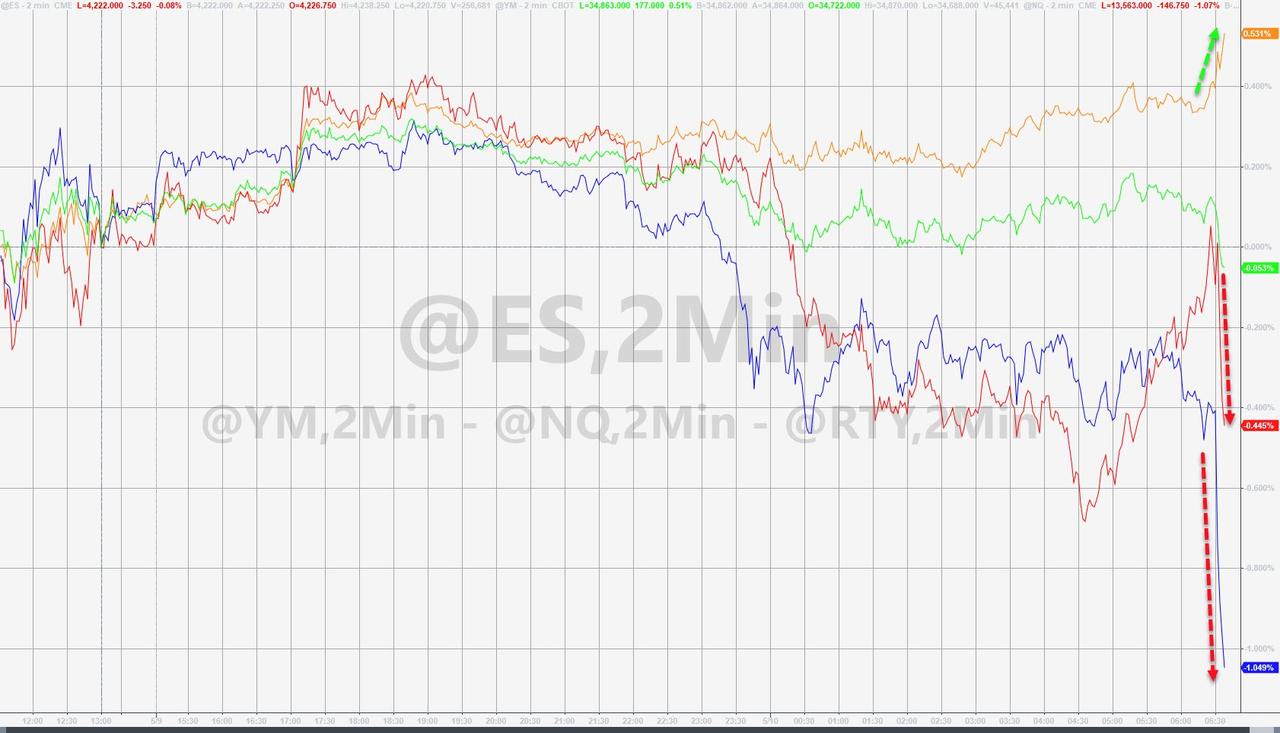
ZeroHedge exclaims, “Everything is tumbling!

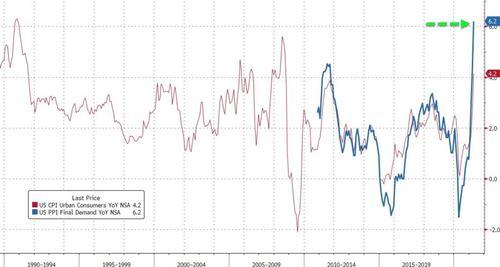
Global stocks and US index futures fell for the third straight session, led by the Nasdaq 100, bonds and commodities dropped and crypto crashed ahead of today’s release of the April Fed minutes after the ECB warned the euro-area faces elevated risks to financial stability as it emerges from the pandemic with high debt burdens and “remarkable exuberance” coupled with resurgent worries over inflation and coronavirus flareups.

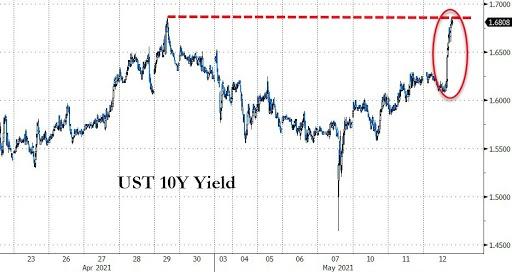
The yield on 10-year Treasury notes touched a one-week high of 1.67%, driving down shares of Apple, Microsoft and Facebook by about 1% premarket. Dow e-minis were down 252 points, or 0.65%, S&P 500 e-minis were down 42.25 points, or 1.0%, and Nasdaq 100 e-minis were down 170.75 points, or 1.24%.”


VIX futures made a morning high of 23.63 as it surges into a breakout position.  Its Cycles Model suggests two more weeks of rally, ending on or near June 2.  Should equities follow this model, the SPX/NDX Master Cycle low may also extend to that date as well.


TNX is rising and threatens to break out above its prior high at 17.00.  After having made its Master Cycle low on May 7, it may continue to rally until…June 2.


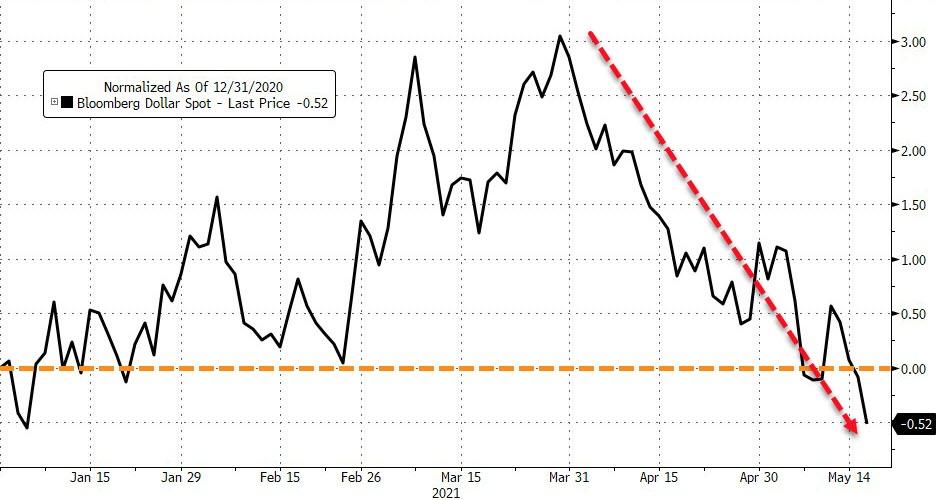
USD futures appear to be consolidating just above yesterday’s low, suggesting the Master Cycle low may have been made yesterday on day 259.  There are no signals to speak of, so we are neutral pending a clearer change of direction.


Posted in Published | Comments Off on May 19, 2021

May 18, 2021

3:53 pm

The trendline at 4140.00 is broken again.  The next target, but not the last, is the 50-day Moving Average at 4065.43.  The Broadening Wedge target may be the minimum for this decline.  This could be exciting…

I have mentioned several times that, despite the stock buybacks, the market is going nowhere due to selling by insiders and hedge funds.  The buybacks are their “golden parachute.”

ZeroHedge remarks, “When the country’s CEOs and billionaires start to head to the exits a little bit quicker than usual at the tail end of a 13 year bull market, it may be time to start paying attention.

That’s what we found noteworthy about a recent Bloomberg piece, which noted that stock sales by some of the world’s richest shareholders are “reaping a windfall”, thanks to our current inflated equity markets, “to the tune of trillions”.

Amazon.com’s Jeff Bezos and Google co-founder Sergey Brin are just two of the well known names that have been offloading stock. They are joined by names like Mark Zuckerberg and Larry Ellison.


10:15 am

Gold futures just made a new retracement high and appears to be in reversal as well.  It appears poised to make a 12.9 day decline in an Intermediate Wave (3) to its Master Cycle low.   The Head & Shoulders formation appears to be in its path, with the attending consequences.   No one sees the reversal just yet.  All the commentary appears to be on the new highs.  See the USD chart and commentary at the bottom of the page.


10:00 am

WTIC futures made a new high this morning at 67.00, completing a Minor or Intermediate Wave 2 and finishing its Master Cycle on day 266.  It has room to make a 12.9 day decline into its Master Cycle low.  It is hardly being noticed, but the decline has the potential of being a barn burner, falling in line with the VIX, USD and TNX.  It appears that everything will move together.


7:15 am

Good Morning!

NDX futures made a modest new high at 13431.88 in the early morning hours before easing back down.  Today is day 258 of the NDX Master Cycle and it is nowhere near completion.  The hourly chart suggests tomorrow may give us the Master Cycle low with the blue chip indices in sync at 8.6 days from the peak (the NDX will have made 12.9 days) to the close.   That is a short, but not uncommon, decline to a Master Cycle low.  Should the NDX decline in a zigzag fashion to a new low (beneath 12800.00), I would call it the end of the current Master Cycle.  There is always the option of the decline extending further through options expiration, but that may depend on how this decline unfolds.

ZeroHedge reports, “Last week we noted that one of the clear trends to emerge as a result of the recent horrific price action in tech stocks, was the continued aggressive selling – and shorting – of tech stocks by hedge funds. The latest weekly report from Goldman’s Prime Brokerage confirms this.

Starting at the macro level, Goldman Prime writes that the GS Prime book “was net sold for the first time in three weeks (-1.3 SDs), driven by short sales outpacing long buys 2.4 to 1. Single Names saw the largest net selling in two months, while Macro Products (Index and ETF combined) saw the largest net buying in seven weeks. Nearly all regions were net sold led by North America and EM Asia, while Europe was net bought for a 7th straight week and saw the largest $ net buying since Feb ‘18. 7 of 11 global sectors were net sold led by Info Tech, Consumer Disc, Financials, and Comm Svcs, while Health Care, Industrials, and Utilities were the most net bought.”

As noted previously, however, the real action was in the tech sector, with GS Prime noting that “Info Tech was net sold for a 4th straight week and saw the largest $ net selling in more than 5 years, driven entirely by short sales.”


SPX futures rose to an overnight high of 4179.30 before easing down beneath Short-term support at 4169.68.  The retracement exceeded the 61.8% Fib value of 4168.61, but also appears to have declined beneath it this morning.  The target for this decline is the trendline near 3925.00.  The trendline at 4146.00 needs to be broken to spark an acceleration of the decline.  SPX short gamma lies beneath 4150.00.

ZeroHedge reports, “US equity futures rose for the 3rd day in 4 and world stocks pushed higher on Tuesday while the dollar tumbled to three-month lows as  optimism that economic reopening will boost growth outweighed concern about a pick-up in virus cases in parts of Asia even if it leads to higher prices. Oil gained and 10Y yields dropped marginally.

At 7:30 a.m. ET, Dow e-minis were up 77 points, or 0.22%, S&P 500 e-minis were up 9 points, or 0.3%, and Nasdaq 100 e-minis were up 73 points, or 0.55%. Retailers Walmart and Macy’s jumped in premarket trading after raising their full-year guidance, while Home Depot gained as its results beat estimates. Commodity and automotive shares boosted the Stoxx Europe 600 Index, while Asian equities also climbed.”


VIX futures visited a low of 18.88 before rising back to the flat line this morning.  The VIX Master Cycle doesn’t terminate for two more weeks, which introduces the idea of an extended decline in stocks, should the VIX rise during that entire period.  While the Cycles Model is less clear for equities, the Model suggests something is afoot in the TNX, USD and VIX, all of which project new highs by the end of the month.  Follow the money.


USD futures made a new Master Cycle low this morning at 89.75 on day 259.  This may explain the hesitancy of stocks to decline.  Should that be the case, we may see the USD start ramping higher shortly.

ZeroHedge reports, “The USDollar index’s recent acceleration lower has pushed it into the red for 2021, erasing the 3% surge seen in the first few months of the year…

Source: Bloomberg

As Bloomberg notes, the recent weakness came after Fed officials reiterated (vehemently) on Monday that they see recent price pressures as transitory and intend to keep policy accommodative for some time to come. Meanwhile, investors are brushing off fears that the new Indian virus variant could threaten reopening drives in the U.K. and Europe, while a surge in raw materials from iron to oil and copper has buoyed commodity-linked currencies.”


TNX appears to be “hugging” the 50-day Moving Average at 16.29.  The current Master Cycle appears to run until June 2 with increasing strength over the next two weeks.  A breakout may be a catalyst for the next decline in equities.


Posted in Published | 2 Comments

May 17, 2021

7:00 am

Good Morning!

NDX futures slipped back beneath the .382 Fibonacci retracement level at 13381.39 and the 50-day Moving Average at 13369.92 this morning.  All in all, this was a weak retracement for the NDX, despite Friday’s algo-driven push higher.  The reason (IMO) why it stopped there is because most traders did not go short until the 50-day was broken.  At this point the majority of short-sellers have been hung out to dry.  That is why I have suggested aggressive short positions earlier, remaining above the fray of the short squeeze.

The EW pattern may be considered to be a Leading Diagonal formation that requires one more (zigzag) push down to the vicinity of 12700.00-12750.00.  That fits very well with the probability that the NDX has a potential Master Cycle low by Wednesday.   If so, be prepared for a monster rally on Thursday and Friday to bring the NDX  back above 13500.00 by Friday’s close.  Wall Street may be determined not to pay the put players (shorts) for their impertinence.  Remember, this is all speculation until it happens, but patterns can be revealing of the possibilities that may happen.  Keep in mind that Wall Street does its best to pay the fewest players.

ZeroHedge drops this nugget, ““What are you thinking about markets here?” asked the entrepreneur, wedging the question into our conversation, but working hard to sound barely interested.

I laughed, unable to contain it. “Oh, so you really called to ask about bitcoin,” I said, smelling his quiet panic.

“Well, you know, yeah basically, I mean what do think about all this stuff going on?” he asked, not wanting anything other than reassurance.

“You don’t get to make a lot of money without enduring an even greater amount of pain – that’s just the way the universe works,” I explained, having a little fun while trying to be helpful. Don’t get me wrong, I’m not someone who enjoys the suffering of others. It’s just that I’ve endured so much of it myself that when I observe it in people who casually trade, thinking it’s fairly easy, I find it funny they believe trading somehow defies natural law.”


The NDX Hi-Lo Index ramped back into positive territory on Friday with 81 new 52-week highs by Friday afternoon.  That number was adjusted down to a more acceptable 39.00 after the close.  The reasons for this adjustment are several, including the possibility that the buying algos that kept the sellers at bay all day shut off at 4:00 pm, allowing some after-hours sellers to prevail.  In addition, the Hi-Lo Indexes are laggards and are seldom accurate during actual trading.  Finally, ETFs may add to the double count and may be pulled out of the final tally.


SPX futures broke back beneath Short-term support at 4172.21 and may be approaching the trendline and mid-Cycle support at 4141.21.  This puts the short gamma beneath 4150.00 temporarily back into play, causing the dealers and hedge fund to sell/go short.  Friday’s rally was meant to nullify the effect of short gamma going into options expiration later this week.  However, should the decline continue, we may see a deeper short-term low late on Wednesday.  Be prepared to take short profits on Wednesday.

The May 7 peak occurred on day 247 of the Master Cycle.  Wednesday is day 259, a more likely place for a Master Cycle low.  The target for this low may be the trendline near 3900.00.  If so, be prepared for a barn burner of a rally going into options expiration.

ZeroHedge reports, “US equity futures and European stocks dipped in a quiet overnight session to start the week amid renewed concerns about rising inflation and a spike in Covid-19 cases in parts of the world. Gold briefly reached a three-month high, while oil and the dollar were little changed; 10Y TSY yields rose after dropping earlier in the session.

At 715am ET, Dow e-minis were down 125 points, or 0.36%, S&P 500 e-minis were down 17 points, or 0.39%, and Nasdaq 100 e-minis were down 46 points, or 0.34%, reversing much of Friday’s rebound.”


VIX futures are back above the 50-day Moving Average, reaching a high of 20.95.  The Cycles Model suggests extra strength in the VIX today and Tuesday while current options expire on Wednesday.  The VIX Master Cycle comes to a close at the end of May.  Currently there are mixed signals of what happens after options expiration.


TNX appears to be rising from the 50-day Moving Average at 16.24 in the next surge higher.  There appears to be a spike of strength that may drive it into a breakout above the March high by Thursday in the Cycles Model.  This fits with the probability of stocks selling off into the close on Wednesday.


USD futures made a low of 90.18 over the weekend but have begun to rally again.  This fits with the Master Cycle calling for a rally in the USD into early June.

Enough said for now.


Posted in Published | 1 Comment

May 14, 2021

9:15 am

GKX stalled at the mid-Cycle support at 442.41 yesterday, suggesting a bounce may be imminent.  That suggests the correction may be an expanded formation, allowing GKX to move even higher.  The Cycles Model shows an unusual strength in the next week, which supports higher food prices.  Then there is the following article…

ZeroHedge reports, “Earlier this week, in a routine bridge inspection, an engineer climbed onto the section of the Interstate 40 bridge over the Mississippi River and spotted a massive fracture in the frame that resulted in the immediate shutdown of the bridge on Wednesday. Traffic is being rerouted to Interstate 55 Memphis & Arkansas Bridge, creating traffic jams in the Memphis area. On the Mississippi River, the situation is much worse. Hundreds of barrages are piling up on either side of the bridge as the US Coast Guard has closed the critical waterway.

After a routine inspection, officials with the Tennessee Department of Transportation (TDOT) announced that the Hernando de Soto Bridge would be closed due to a crack on the bottom side of the bridge truss. ”


7:20 am

NDX futures reached a high of 13259.50 this morning, a mere 26% retracement of the decline from April 29.  The bounce may be over or nearly so, since retracement Wave (c) equals retracement Wave (a) at 13271.00.  Should the retracement extend, the 38.2% Fibonacci level is just above the 50-day Moving Average at 13359.58.


The NDX Hi-Lo closed at -161.00, clearly indicating massive selling in the NDX.  This indicator tells us the weakness, if not outright panic selling, may continue.


SPX futures reached an overnight high of 4137.88, revisiting the Broadening Wedge trendline for the third time.  A standard retracement Wave (c) equals retracement Wave (a) at 4159.00.  A 50% retracement occurs at 4147.17.  A 61.8% retracement occurs near Short-term resistance at 4168.61, should an extra push be contemplated.

ZeroHedge reports, “US index futures rose with for a second day alongside global markets as a continued drop in commodity prices helped ease fears about inflation risks. Treasuries advanced, cryptocurrencies rebounded from a Thursday rout while the dollar slumped. After a bruising week that saw the biggest one day drop for the S&P since February, higher S&P 500 and Nasdaq 100 contracts signaled a market recovery was gaining momentum.

The three main U.S. stock indexes snapped a three-day losing streak on Thursday after better-than-expected weekly jobless claims data while ignoring the highest annual PPI increase on record. At 7:15a.m. ET, Dow e-minis were up 150 points, or 0.44%, S&P 500 e-minis were up 26 points, or 0.63%, and Nasdaq 100 e-minis were up 132 points, or 1.00%.”


The NYSE Hi-Lo Index closed beneath thee lower trendline of the Orthodox Broadening Top, indicating another sell signal.  The target of this decline lies beneath the March 2020 low of -2375.00.


VIX futures made an overnight low of 21.91, remaining above the 50-day Moving Average at 19.79.   The retreat of the VIX has lulled investor sensibilities to  the breakout, which promises more to come.  Some see the danger, but it does not appear imminent to them.

ZeroHedge observes, “There is a high likelihood that in the ultimate bubble crash of the global financial system that is going to occur sometime over the next 5 to 10 years, that we take out the 100 level in the VIX Market. The central banks and governments around the world have kicked this can as far down the road as is possible given the fundamentally poor circumstances facing the global financial system. We are at terminal lift off at this stage from a historical timeframe standpoint, and it will not take much to light the final fuse regarding the ultimate destruction of global finance as we know it. ”


TNX appears to be lingering just above the 50-day Moving Average at 16.29 as it gathers strength for the next push higher.  Treasuries appear to be especially vulnerable to a sell-off over the weekend and early next week, according to the Cycles Model.

ZeroHedge reports, “In stark contrast to yesterday’s stellar 10Y auction, moments ago the Treasury concluded its refunding issuance when it sold $27BN in 30Y paper in an ugly, tailing auction that was disappointing in every category.

The High Yield of 2.395% was the highest since November 2019, and tailed the When Issued 2.377% by 1.8bps, the biggest tail since August 2020. The bid to cover of 2.219 was a big drop from 2.466 last month, and also well below the 6-auction average 2.36%.”


USD futures continue their consolidation this morning.  Tuesday’s Master Cycle low appears to be the real thing, despite being a week early.  Options week appears to be ready to give the USD a double boost as short sellers cover.  The next Master Cycle high may not occur until early July, giving the rally time to reach its Broadening Wedge target at 96.00.


Posted in Published | Comments Off on May 14, 2021

May 13, 2021

11:38 am

Food prices are taking a breather that may last through early June, per the Cycles Model.  The downside target is near the 50-day Moving Average at 410.00.  Crops and livestock are being affected by the soggy southeast and the hot, dry western part of the country.  It can only get worse as some farmers debate planting at all rather than running up expenses to plant only to have a meager harvest.

ZeroHedge observes, “Triple-digit heat will hit truckers across the Southwest over the next couple of days.

From the Central Valley of California to southern Arizona, temperatures will soar into the 90s to above 100 degrees in many spots Thursday and Friday. This includes places in California like Redding, Stockton, Fresno, Bakersfield, El Centro and Death Valley; Phoenix, Tucson and Yuma in Arizona; as well as Las Vegas.

This won’t be a record-breaking heat wave, but these highs will be anywhere from 7 to 15 degrees above normal for mid-May. Even though the high may only reach the upper 80s in Sacramento, California, this would be 10 degrees above normal.”


11:32 am

While the SPX acts like it may recover to the untrained eye, the NYSE Hi-Lo Index says, “Nope!”  This is the hallmark of a short squeeze, where no new highs are being made, just losses for the shorts.


11:23 am

A retracement to the Broadening Wedge trendline was in order this morning before the short squeeze ran out of fuel.  The bounce this morning overlapped the initial decline, suggesting an extended decline may still be ahead.

ZeroHedge observes (tongue in cheek), “It seems that the “non-transitory” inflation panic that gripped markets yesterday, resulting in the biggest one-day drop in the S&P since February, is gradually transitioning to “transitory” again, and even though today’s y/y PPI print of 6.2%, the highest on record, reaffirmed the soaring prices narrative…

… today the “transitory” inflation mood is reasserting itself, with Emini futures surging almost 100 points from the overnight lows…

… and the battered FAAMG sector is solidly in the green as closely watched 5Y breakevens slide and nominals are down to session lows:”


7:40 am

Good Morning!

NDX futures bounced after a further decline to 12915.00, as suggested yesterday afternoon.   The bounce may go as high as the 50-day Moving Average at 13366.86.  The structure of this decline appears to be a Leading Diagonal which may have yet another leg down as low as the 200-day Moving Average at 12450.77 after the bounce.

I have been been looking for an explanation of why the top occurred on May 7.  The daily Master Cycles Model suggested either a top or a bottom might occur nearer to May 19.  (It still may show up in the NDX.)  So this is a little out of character.  It turns out that May 7 may have been the end of a Monthly Master Cycle.  The span from March 23, 2000 to May 7, 2021 is 253 months!  The Actual 258 month Cycle ends in mid-October, where another Master cycle low is anticipated.  Interesting…

ZeroHedge reports, “US equity futures fluctuated – first rising then sliding for a 4th session – in a volatile overnight session which saw global stocks fall to a six-week low as inflation fears continued to depress investor sentiment. One day after the S&P suffered its biggest one-day percentage drop since February it feels almost impossible how quickly sentiment has shifted and that the S&P hit an all time high just 4 days ago on Monday. It’s been non-stop selling since then.

Losses this week have pulled the S&P 500 4% off its record closing high on Friday, while the tech-heavy Nasdaq is about 8% below its April 29 all-time high. At 700 a.m. ET, Dow e-minis were down 144 points, or 0.43%, S&P 500 e-minis were unchanged and Nasdaq 100 e-minis were up 40.25 points, or 0.29%.The dollar rose to a one-week high and yields were stable, as investors awaited producer prices data, another inflation gauge, to see if a rise in prices would be strong enough to prompt a sooner-than-expected increase in interest rates.  ”


The NDX Hi-Lo Index cratered at the close at -63.00.  What bid there might have been at mid-day evaporated by the close, leading to further losses and a possible break of the underlying trendline.


SPX futures declined further overnight to 4029.38 challenging the 50-day Moving Average at 4043.96 before bouncing to 4077.00 this morning.  The bounce may go a bit higher this morning, but the decline does not appear to be over.

Investors are being told to “tough it out.”  “It won’t last.” they say.  But everyone has their selling point.  Insiders and smart money have been piling toward the exits for weeks, which explains why stock buybacks have not had a positive effect.  Unfortunately, the average investor will worry, but do nothing until they cannot stand the pain any more.  Their selling point may be too little, too late.


Yesterday afternoon I reported that the NYSE was being bid and to expect a bounce.  The bid disappeared by the close with the NYSE Hi-Lo Index closing at 17.00, clearly on the sell side.  This may explain the rather lackluster bounce this morning.


VIX futures rose to an overnight high at 28.93 before easing back down above the trendline at 25.00.  The VIX still has room to move higher.  The next resistance appears to be at the January high at 37.31.  Thus far, the spike in the VIX has raised speculation that it may go down again, giving a boost to to stocks.


TNX rose to 17.00 in the early morning session.  The Cycles Model shows another spike of strength to end the week which could easily break above the previous high at 17.65.

ZeroHedge reports, “With the 10Y yield trading right on top of last week’s high…

… many traders were expecting a relatively smooth sailing for today’s 10Y refunding auction in light of the sharp jump in yields which built in a generous concession ahead of today’s $41 billion auction.

And they were right: printing at a high yield of 1.6840%, today’s auction was virtually unchanged from April’s 1.680% and stopped through the When Issued 1.697% by an impressive 1.3bps, the biggest stop through since February.”


USD futures made a shallow decline, then appear to have recovered in the overnight session.  Tuesday’s proposed Master cycle low occurred on day 252 in the current run.  The new Master Cycle may run nearly eight weeks, with an especially strong start this next week as investors seek to avoid a nasty short squeeze going into options expiration.

ZeroHedge observes, “Last Friday’s shockingly bad payrolls report is fading into the memory following a blistering CPI report, a hot PPI and moments ago, another very strong initial jobless claims report according to which adjusted initial claims dropped to just 473,000, a decrease of 34,000 from the previous week’s revised level, stronger than the 490K expected…

… and the lowest level for initial claims since the last pre-covid print on March 14, 2020 when it was 256,000. The previous week’s level was revised up by 9,000 from 498,000 to 507,000. The 4-week moving average was 534,000, a decrease of 28,250 from the previous week’s revised average. This is the lowest level for this average since March 14, 2020 when it was 225,500. The previous week’s average was revised up by 2,250 from 560,000 to 562,250.”


The Nikkei 225 Index plummeted over 1000 points in this morning’s session to 27132.50 before a small bounce.  It is interesting that Monday’s reversal in the Nikkei cut short (truncated) a potential rally to new heights.  This shows that the turn in the markets is worldwide.


Posted in Published | 2 Comments

May 12, 2021

4:00 pm

The VIX has pushed through its declining Wedge trendline and may have reached a point of recognition by those buying “protection.”  This breakout holds a promise for more rally to come.


3:55 pm

NDX is also approaching a 7-month trendline that may cause a bounce.  Should it decline through it, the mid-Cycle support lies at 12567.00.  The decline does not appear complete in the  NDX.  The NDX Hi-Lo is at 6.00.  Not a good sign.


3:45 pm

The SPX appears due for a bounce at the 50-day Moving Average at 4050.00.  Should it do so, it may rally back to the Broadening Wedge trendline and mid-Cycle resistance at 4130.53.   The NYSE Hi-Lo Index has risen to 85.00, indicating a growing bid under this sell-off.  However, it may not be enough to stop the decline from resuming.  The buyers are still being overwhelmed at this point.


8:45 am

US Core Consumer Prices Explode Higher At Fastest Pace Since 1981

ZeroHedge reports, “After March’s blowout 0.6% MoM surge in headline CPI, analysts expected a modest slowdown MoM, but surge YoY due to the base-effect comps from April 2020’s collapse. However, it appears analyst massively underestimated as headline CPI surged 0.8% MoM (4 times the +0.2% expected) and exploded 4.2% YoY. That is the biggest YoY jump since Sept 2008 (and biggest MoM jump since June 2008)”

Source: Bloomberg


7:15 am

NDX futures made a low of 13185.00 shortly after midnight, then attempted a bounce back.  It is currently down 85 points, solidly beneath the 50-day Moving Average and on a confirmed sell signal.  Big Tech panic bid the decline with stock buybacks, but the sellers, including insiders, did not relent.

ZeroHedge observes, “After yesterday’s ugliness in big-tech and small-caps, many hoped for a bounce today. But the combination of ARKK gamma and CTA deleveraging meant the pain was not over and both Nasdaq and Russell 2000 plunged into the cash market open (after getting hit as the Asia open and European open)…


But that puke into the cash open was one for the history books as NYSE companies trading on downticks exceeded those on upticks by 2,069 at one point. That was the most widespread bout of selling in the history of the indicator…”


The NDX Hi-Lo Index went deep yesterday, not only giving the standard sell signal (below zero) but also triggering a Broadening formation sell signal, as well.  This year’s target may be as low as -2310.00,compared to last year’s low of -2087.00.


SPX futures visited yesterday’s low at Intermediate-term support at 4115.88 shortly after midnight before a bounce that regained a part of the losses.  It appears that it may retest the low during the cash market today.  The daily chart shows a monster gap of nearly 40 points left open after yesterday’s rout.

ZeroHedge reports, “US equity futures continued their slide, and a sell-off in global shares extended to its longest losing streak in two months on Wednesday as investors awaited the latest inflation figures to assess the risk that soaring prices will snuff a recovery in the world’s biggest economy, prompting bets on earlier interest rate hikes and higher bond yields.

At 7:15am Dow e-minis were down 136 points, or 0.4%, S&P 500 e-minis were down 17 points, or 0.42%, Nasdaq 100 e-minis were down 84 points, or 0.62% while futures tracking the small-cap Russell 2000 index dropped 1%. The dollar advanced with Treasuries.”


The NYSE Hi-Lo Index crashed from Monday’s high at 927.00 to yesterday’s low of -20.00, where it closed.  A cross of the lower trendline of the Broadening formation appears imminent, with a probable target beneath last year’s low at -2375.00.  The Hi-Lo Index may not reach that low until the end of June.


At 8:00 am I reported, “ VIX futures reached an overnight high of 22.69 thus far.  A breakout above the mid-Cycle resistance at 23.71 appears imminent, confirming the buy signal.  Most investors don’t recognize a change in the VIX until it exceeds 25.00.  Of course, that is near the upper trendline of the declining Wedge formation, which suggests a target near or above 90.00.”

At 9:00 am the VIX futures made a high of 23.80, overcoming mid-cycle resistance at 23.71 and on its way to a breakout above the declining Wedge trendline.


At 8:24 am I noted, “TNX appears to be coiling between the 50-day Moving Average at 16.10 and Intermediate-term resistance at 16.24.  The Cycles Model suggests it may break out above resistance in strength in the next two days.  A breakout above the prior high at 17.65 would put the stock market on edge for further declines.”

At 8:40, the breakout began in strength, hitting 16.50.


USD futures appear to be consolidating near the low made yesterday at 89.96 on day 251 of the Master Cycle.  There is no clear directionality yet, so we remain neutral on USD.


The Nikkei 225 Index suddenly reversed in the overnight market on Tuesday , leaving a truncated Wave (5) in its wake.  This morning it declined further, confirming the reversal.  The everything bubble is popping worldwide.

ZeroHedge reports, “Something took place on Tuesday that has happened just once since 2016: Japan’s Topix index (which is widely viewed as more representative of Japanese equities than the Nikkei) tumbled by 2% in the morning session…. and the BOJ did not intervene.

Why is this notable? Because – in a world where everyone is now completely used to Plunge Protection Teams and central bank bailouts as if it is a perfectly expected event –  this was only the second time since at least 2016 that the Bank of Japan did not make an ETF purchase after the Topix fell more than 1% in the morning session. The only other time? April 21, when the Topix also tumbled 2% in the morning session and the BOJ was nowhere to be seen.


Posted in Published | 1 Comment

May 11, 2021

12:15 pm

I was dubious about the NDX filling the gap this morning.  However, it managed to bounce back to the 50-day Moving Average as resistance, just a dozen points short of yesterday’s close at 13359.40.  The selling pressure may not be over if the 50-day cannot be breached.

ZeroHedge remarks, “Nomura’s “futures imbalance” monitor showed enormous sell pressure all day in NQ futs across all lots sizes (the largest in at least 1m), but particularly in our medium- and large- lot buckets, proxies for large HFs and Asset Managers aggressively selling / shorting…

Two things were behind the QQQcrash – ARKK’s vicious circle and CTA Deleveraging.

Nomura’s Charlie McElligott warns that the monstrous ~$20B ARKK active ETF is getting absolutely torched in recent weeks amid a negative feedback loop from the mega-high growth / high multiple / “unprofitable” single-names.

Critically, he explains, the ETF itself now acting “shadow leverage” pressuring this selloff, especially with their dubious risk management practice of heavily concentrated positioning into what are extraordinarily illiquid names.”

Additionally, ZeroHedge observes, “Late on Monday, we made two important observations: i) hedge funds had never been more levered to market moves, with gross leverage at all time highs, as hedge funds strive to extract every last ounce of beta from the market (net leverage was also extremely high, but not record high, and is more a reflection of any given hedge fund’s alpha preference)…

… and ii) hedge funds had scrambled to short tech shares explaining the recent decline in the Nasdaq, with Goldman Prime pointing out that Info Tech stocks were net sold for a third straight week and saw the largest week/week $ net selling since last August, and that Info Tech was by far the most net sold sector on the GS Prime book driven by short sales outpacing long buys 7 to 1.

One day later and the bearish pile up is reaching epic proportions.”


9:40 am

The NDX Hi-Lo Index plummeted to -91.00 this morning, effecting the confirmed sell signal in the NDX.  The VIX and VXN both climbed above their respective 50-day Moving Averages, confirming the SPX/NDX sell signals.  Volatility is high, so pick your  entry carefully.

The NYSE Hi-Lo opened at -6.00 and barely climbed to 1.00 at this time.  We have selling confirmation on all fronts.

7:30 am

Good Morning!

NDX futures again lead the decline and is now beneath the 50-day Moving Average, plunging to a low (thus far) of 13079.88.  It is on a confirmed sell.  The Cyclical path becomes more certain, with a minimum decline to Wednesday of options week.  It may go much further, but we will have to monitor it for progress during this time.  This may be a vicious decline, since virtually no one has been short until a few days ago.  Options may play a big influence on the decline, with a possible extension of the decline through options week.

ZeroHedge observes, “Hedge funds had another rough week according to Goldman’s Prime Brokerage, with the GS Equity Fundamental L/S  Performance Estimate falling -1.68% between 4/30 and 5/6 (vs MSCI World TR -0.33%), driven by alpha of -1.11% – the worst weekly alpha in two months – and to a lesser extent beta of -0.57% (from market exposure and the market sensitivity factor combined). As a result, global fundamental equity L/S hedge funds lost almost two-thirds of their YTD gains in just the past week, bringing their total YTD return to just 0.97% in what is setting up as another dismal year for the 2 and 20 crowd.”


The NDX Hi-Lo has been predominantly been resisted at the mid-Cycle line at 175.00, but it has not declined beneath 0.00 for more than a day.  That should change today.


SPX futures have declined thus far to 4127.62, approaching the Broadening Wedge trendline, which may confirm the sell signal today.  As mentioned previously, as the NDX becomes less liquid, the selling migrates to the more liquid indices.

ZeroHedge reports, “Yesterday was bad, but not too bad, and we titled our morning market wrap “Futures Flat As Soaring Commodities Depress Tech Stocks.” 24 hours later it’s much worse, as the rout that hammered US tech stocks on surging inflation fears (see “This Is Not Transitory”: Hyperinflation Fears Are Soaring Across America“) has now gone global, with markets in Asia and Europe hammered and S&P futures sliding 0.8%, while Nasdaq futures tumbled by another 1.3% after Monday’s 2.6% rout. Treasuries were steady ahead of today’s 3Y auction while the dollar erased its gains and dropped to session lows.

Here are some of the notable bloodbath highlights: the Hang Seng Tech Index sank as much as 4.5%, extending its tumble from a February high to about 30%. In Europe, the Stoxx 600 Index fell the most since January as tech sector losses drove the gauge lower. One of the biggest winners over the past year, Cathie Wood’s Ark Innovation ETF, was down more than 3% in pre-market trading after plunging 5.2% yesterday.

“It seems to be a combination of inflation fears making a comeback and some market participants moving higher along the value spectrum, cutting their exposure to anything with a stretched valuation,” said Marios Hadjikyriacos, investment analyst at online broker XM in Cyprus.

In a late session reversal on Monday, inflation jitters drove investors away from growth stocks to cyclicals, which benefit the most as the economy reopens, resulting in the S&P 500 logging its worst day in nearly eight weeks. At 700 am ET, Dow e-minis were down 159 points, or 0.46%, S&P 500 e-minis were down 31.5 points, or 0.75%, and Nasdaq 100 e-minis were down 169.25 points, or 1.27%.”


The NYSE Hi-Lo illustrates the move over to value vs growth.  However, the Orthodox Broadening Top formation shows a potential for a very deep dive.  The entire market may be about to have its Wile E. Coyote moment.


VIX futures rose to 22.60, potentially breaking above its previous high.  The rally above the 50-day Moving Average at 19.94 confirms the VIX buy signal (SPX sell signal).  This is not at the broad recognition point for a market sell signal.  It is likely that that may come above the upper trendline near 25.00.


TNX is challenging the 50-day Moving Average at 16.07 this morning.  A close above that level produces a buy signal.  The Cycles Model affirms that the rally may continue through the month of May.


USD futures appear to have consolidated near the bottom that was made yesterday on day 251.  It is not clear whether that is the Master Cycle low or not.  Time will tell, so I am assigning a neutral stance to the USD for the week.


Light crude oil futures declined this morning as (lack of) liquidity affects all classes of assets.  Crude has quit making new highs since March 8, leaving it in a vulnerable position to decline more radically than one would expect.  There may be, literally, no bottom in oil.


Commodities have reached their Master Cycle high in the past few days.  In addition, they may also have reached their secular high, as well.  Copper futures peaked at 4.89 yesterday and appears to have begun their decline.  This is not a new super Cycle.  It is an errant Cycle Wave b that drank too much Fed juice.  Wave c of II may end up near .73 for a low.

ZeroHedge reports, “There was some good news for the (transitorily hyper)inflation-ravaged US economy today when copper, wheat and lumber futures all fell after days of surging – in the case of the latter, the first drop in 13 days…

… pushing the Bloomberg commodity index lower after six straight days of gains.”


Posted in Published | Comments Off on May 11, 2021

May 10, 2021

10:15 am

The Dow Jones Industrials Exceeded 35000.00 and may briefly touch the Fibonacci 3.25 X Wave [1] at 35152.00 today.  It is also up against the 1987 trendline that has defined tops and bottoms for the past 33.54 years.  The trendline may trump Fibonacci, so don’t expect a perfect target acquisition.


10:05 am

NDX has declined beneath the mid-Cycle support at 13599.56, giving a potential sell signal.  It is likely that resistance will be retested before proceeding further down.  The NDX Hi-Lo Index is at 119.00, not confirming the sell signal, while the VIX  (VXN) are alsl hovering near their lows.  I would be very careful with this move until it declines beneath the 50-day Moving Average at 13351.35.

ZeroHedge warns, “After a relatively calm overnight session, all hell broke loose at the US cash open with The Dow (new record high) bid while Big-Tech and Small Caps puked hard…

While the S&P is more neutral, Nomura’s Charlie McElligott’s options in both “Secular Growth” QQQ and “Cyclical Value” IWM implying Dealers remaining incrementally “SHORT Gamma vs spot” (QQQ “gamma neutral” line flips up at 335.34, IWM “gamma neutral” line flips up at 226.50), thus at current levels, both are susceptible to “accelerant” –type moves in both directions…”


7:30 am

Good Morning!

NDX futures made a low of 13639.88 thus far, declining toward the mid-Cycle support at 13592.59.  Should it remain above that support, there may be an outside chance of a panic rally to a high of 14450.00.  Beneath that support reinforces the sell signal.

The current Master Cycle ends during options week.  Both the NDX and SPX a possible low on Wednesday of options week.  However, that may become a high, should the other indices continue to make new highs.  A panic decline will settle the issue.

ZeroHedge observes, “Earlier today, Morgan Stanley’s chief equity strategist Michael Wilson looked at what was likely the highlight of Q1 earnings season, pointing out that “the vaunted FAANMG stocks sold off on terrific 1Q earnings results after an outsized run into the event. This was… a reminder that stocks often peak on good news.”

Not to make a too fine point out of it, suddenly everyone is focusing on the performance of the FAAMG stocks which, after soaring for much of 2020 when they returned 56% and accounted for 7% of the 18% S&P 500 return last year, have gone nowhere in recent months prompting concerns that it’s all downhill from here.

Not surprisingly, FAAMGs were also the topic of the latest weekly note from Goldman’s chief equity strategist David Kostin, who writes that confronted with the prospect of decelerating US economic activity, the bank’s clients are suddenly freaking out about a breakdown in the 5 Generals, and are “asking about the potential for a transition in market leadership” even as “many investors have expressed the view that economic deceleration should support the outperformance of the largest “Big Tech” stocks in the market”, a topic which Goldman analyzed recently and which view the bank supports.”


After making a new high at 4237.88, SPX futures have settled down to a nearly flat regimen.  However, it appears to be forming a Broadening Wedge which may still be incomplete.  Adding to the mix is the Industrials, still making new all-time highs in the futures.

ZeroHedge reports, “S&P futures started the weak flat with Nasdaq futures falling offset by surging commodity stocks as a new record in copper and iron ore prices stoked concern about whether inflation will derail a growth rebound in the world’s largest economy and spoil a record stock rally.  Metal producers were among the biggest gainers in premarket trading, with Freeport-McMoRan, Cleveland-Cliffs and United States Steel all up at least 3%.

At 715 am ET, Dow e-minis were up 109 points, or 0.31%, S&P 500 e-minis were up 3.25 points, or 0.08%, and Nasdaq 100 e-minis were down 35.5 points, or 0.26%. The tech-heavy index has been whipsawed by the prospect of inflation which threatens longer-term profit expectations typical of the industry A downgrade by Citi of Internet stocks such as GOOGL did not help. Treasury yields steadied as traders brace for a busy week of auctions.”


VIX futures have firmed up, but still beneath the trendline near 18.00.  The VIX has made an 8% retracement of the rally from its Master Cycle low.  Should it be able to gain traction above the bottom trendline, it may see a Master Cycle high by late May or early June.


USD futures have made a new low at 90.10 this morning.  USD is in the latter part of the next Master Cycle, due to bottom out during options expiration.


TNX has bounced off Friday’s Master Cycle low after bottoming on day 274.  The new Master Cycle appears to project a high in early June.  I see this as one of the disrupters that will affect the market


Posted in Published | Comments Off on May 10, 2021