4:00 pm

The VIX has pushed through its declining Wedge trendline and may have reached a point of recognition by those buying “protection.” This breakout holds a promise for more rally to come.
3:55 pm
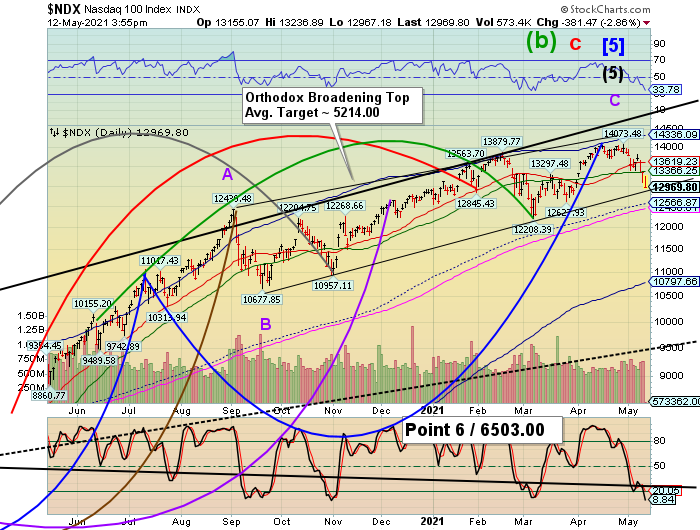
NDX is also approaching a 7-month trendline that may cause a bounce. Should it decline through it, the mid-Cycle support lies at 12567.00. The decline does not appear complete in the NDX. The NDX Hi-Lo is at 6.00. Not a good sign.
3:45 pm
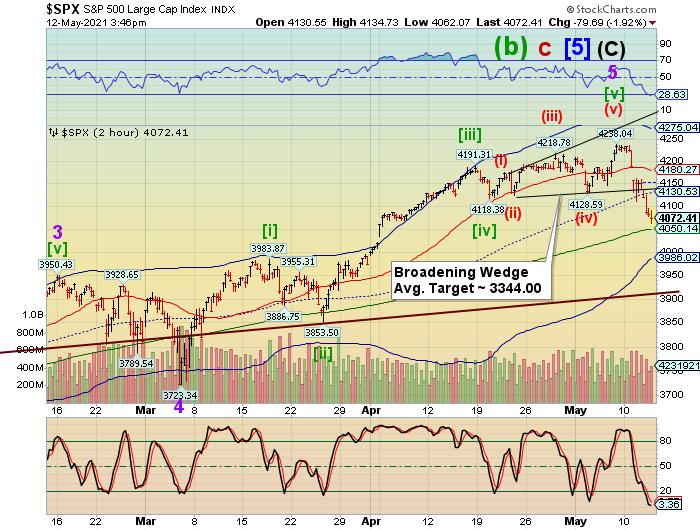
The SPX appears due for a bounce at the 50-day Moving Average at 4050.00. Should it do so, it may rally back to the Broadening Wedge trendline and mid-Cycle resistance at 4130.53. The NYSE Hi-Lo Index has risen to 85.00, indicating a growing bid under this sell-off. However, it may not be enough to stop the decline from resuming. The buyers are still being overwhelmed at this point.
8:45 am
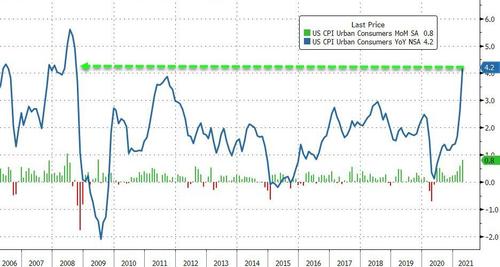
US Core Consumer Prices Explode Higher At Fastest Pace Since 1981
ZeroHedge reports, “After March’s blowout 0.6% MoM surge in headline CPI, analysts expected a modest slowdown MoM, but surge YoY due to the base-effect comps from April 2020’s collapse. However, it appears analyst massively underestimated as headline CPI surged 0.8% MoM (4 times the +0.2% expected) and exploded 4.2% YoY. That is the biggest YoY jump since Sept 2008 (and biggest MoM jump since June 2008)”
Source: Bloomberg
7:15 am

NDX futures made a low of 13185.00 shortly after midnight, then attempted a bounce back. It is currently down 85 points, solidly beneath the 50-day Moving Average and on a confirmed sell signal. Big Tech panic bid the decline with stock buybacks, but the sellers, including insiders, did not relent.
ZeroHedge observes, “After yesterday’s ugliness in big-tech and small-caps, many hoped for a bounce today. But the combination of ARKK gamma and CTA deleveraging meant the pain was not over and both Nasdaq and Russell 2000 plunged into the cash market open (after getting hit as the Asia open and European open)…
But that puke into the cash open was one for the history books as NYSE companies trading on downticks exceeded those on upticks by 2,069 at one point. That was the most widespread bout of selling in the history of the indicator…”

The NDX Hi-Lo Index went deep yesterday, not only giving the standard sell signal (below zero) but also triggering a Broadening formation sell signal, as well. This year’s target may be as low as -2310.00,compared to last year’s low of -2087.00.

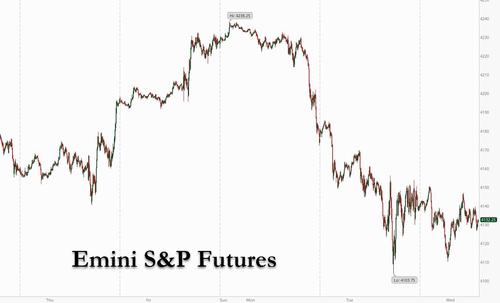
SPX futures visited yesterday’s low at Intermediate-term support at 4115.88 shortly after midnight before a bounce that regained a part of the losses. It appears that it may retest the low during the cash market today. The daily chart shows a monster gap of nearly 40 points left open after yesterday’s rout.
ZeroHedge reports, “US equity futures continued their slide, and a sell-off in global shares extended to its longest losing streak in two months on Wednesday as investors awaited the latest inflation figures to assess the risk that soaring prices will snuff a recovery in the world’s biggest economy, prompting bets on earlier interest rate hikes and higher bond yields.
At 7:15am Dow e-minis were down 136 points, or 0.4%, S&P 500 e-minis were down 17 points, or 0.42%, Nasdaq 100 e-minis were down 84 points, or 0.62% while futures tracking the small-cap Russell 2000 index dropped 1%. The dollar advanced with Treasuries.”

The NYSE Hi-Lo Index crashed from Monday’s high at 927.00 to yesterday’s low of -20.00, where it closed. A cross of the lower trendline of the Broadening formation appears imminent, with a probable target beneath last year’s low at -2375.00. The Hi-Lo Index may not reach that low until the end of June.

At 8:00 am I reported, “ VIX futures reached an overnight high of 22.69 thus far. A breakout above the mid-Cycle resistance at 23.71 appears imminent, confirming the buy signal. Most investors don’t recognize a change in the VIX until it exceeds 25.00. Of course, that is near the upper trendline of the declining Wedge formation, which suggests a target near or above 90.00.”
At 9:00 am the VIX futures made a high of 23.80, overcoming mid-cycle resistance at 23.71 and on its way to a breakout above the declining Wedge trendline.

At 8:24 am I noted, “TNX appears to be coiling between the 50-day Moving Average at 16.10 and Intermediate-term resistance at 16.24. The Cycles Model suggests it may break out above resistance in strength in the next two days. A breakout above the prior high at 17.65 would put the stock market on edge for further declines.”
At 8:40, the breakout began in strength, hitting 16.50.

USD futures appear to be consolidating near the low made yesterday at 89.96 on day 251 of the Master Cycle. There is no clear directionality yet, so we remain neutral on USD.

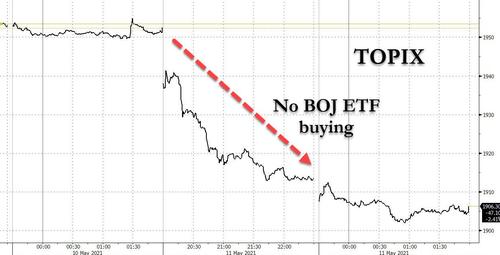
The Nikkei 225 Index suddenly reversed in the overnight market on Tuesday , leaving a truncated Wave (5) in its wake. This morning it declined further, confirming the reversal. The everything bubble is popping worldwide.
ZeroHedge reports, “Something took place on Tuesday that has happened just once since 2016: Japan’s Topix index (which is widely viewed as more representative of Japanese equities than the Nikkei) tumbled by 2% in the morning session…. and the BOJ did not intervene.
Why is this notable? Because – in a world where everyone is now completely used to Plunge Protection Teams and central bank bailouts as if it is a perfectly expected event – this was only the second time since at least 2016 that the Bank of Japan did not make an ETF purchase after the Topix fell more than 1% in the morning session. The only other time? April 21, when the Topix also tumbled 2% in the morning session and the BOJ was nowhere to be seen.


Great info. Lucky me I found your website by accident (stumbleupon). I have book-marked it for later!