October 28,2021

10:01 am

BKX, our liquidity proxy, has fallen beneath its Cycle Top at 139.91, putting it on an aggressive sell signal.  The tightening trading bands suggest a strong move down should the Cycle Top resistance hold.  This is the one indicator that supports the everything bubble.

ZeroHedge gives us a potential catalyst for a liquidity drain, “Last night we noted the Czechs had the dubious honor of suffering the first yield curve inversion of this cycle…

Then overnight saw the stress spread to Australia’s bond market, as a massive move higher in 2Y Yields undoubtedly triggered chaos in risk control departments.

And that VaR shock is now spreading to the US, where for the first time ever the yield on the 30Y UST is below the yield on the 20Y UST…”

ZeroHedge remarks further, “What a day on so many fronts! Let’s start with the staid world of bond markets. The last 24 hours have seen huge swings in yield curves: in Australia, due to a slight overshoot in two of three official CPI measures (all the way to 2.1% y/y!); then the UK, due to the Budget, more on which later; then Canada, due to the BOC winding down QE and talking about a rate hike; and then the US, on further filleting of the Biden fiscal proposal: at this stage, so much has been taken out of the “$3.5 trillion” package we are no longer sure what is in it.

Short yields up, long down sharply, and curves flattening like a pancake is a reminder that raising rates against a structural inflation supply-shock and high energy prices, and without fiscal support in the US, is not a good idea. At least not for an asset-based, financialized ‘economy’. (Indeed, Q3 US GDP today is expected at only 2.6% q/q annualised.) You can make a valid argument it’s time to raise rates: just not do that and prop up our current idiotic system. As such, expect further market swings on a scale that are capable of wiping out those with strong, levered views on matters. And wait until we see a real central bank surprise!”


9:55 am

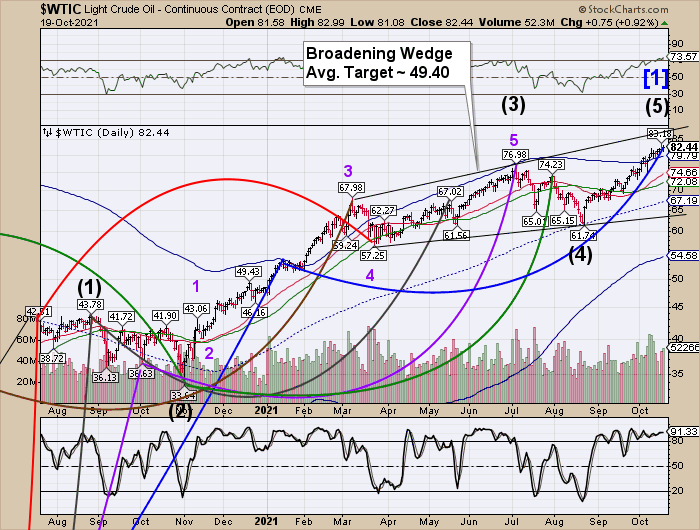
Crude oil futures dropped to a low of 80.67 this morning, crossing beneath the Cycle Top support at 81.01 and giving an aggressive sell signal.

TheEpochTimes reports, “The White House on Tuesday promised to put pressure on members of the Organization of the Petroleum Exporting Countries (OPEC) to increase production amid declining supplies and rising energy prices.

Press secretary Jen Psaki told reports at a press briefing that the president is “mindful” of the increased prices consumers are facing when it comes to their energy bills and that he “reserves a range of options,” to combat the situation.”


9:42 am

The GSCI Ag Index is beginning to show strength as it lifts off its cluster of supports.  This weekend shows a triple whammy  on GKX, suggesting a huge rush to stockpile ag products.  I have no idea what the catalyst may be.  Perhaps the following news release may shed some light.

OilPrice.com observes, “Oil and gas prices have risen dramatically this year as a result of underinvestment and recovering demand.

  • Higher fuel prices are weighing on global food supply chains, with transportation and farming costs continuing to climb.
  • The hardest hit will, once again, be those living in developing economies that are still struggling to recover from the impact of the pandemic.

The potential for a knock-on effect of rising fuel prices to be felt by other industries is becoming more likely, as oil and gas prices continue to rise to an all-time high, companies are finding it hard to maintain their costs and may have to shift this burden to the consumer any day now. ”


8:30 am

Good Morning!

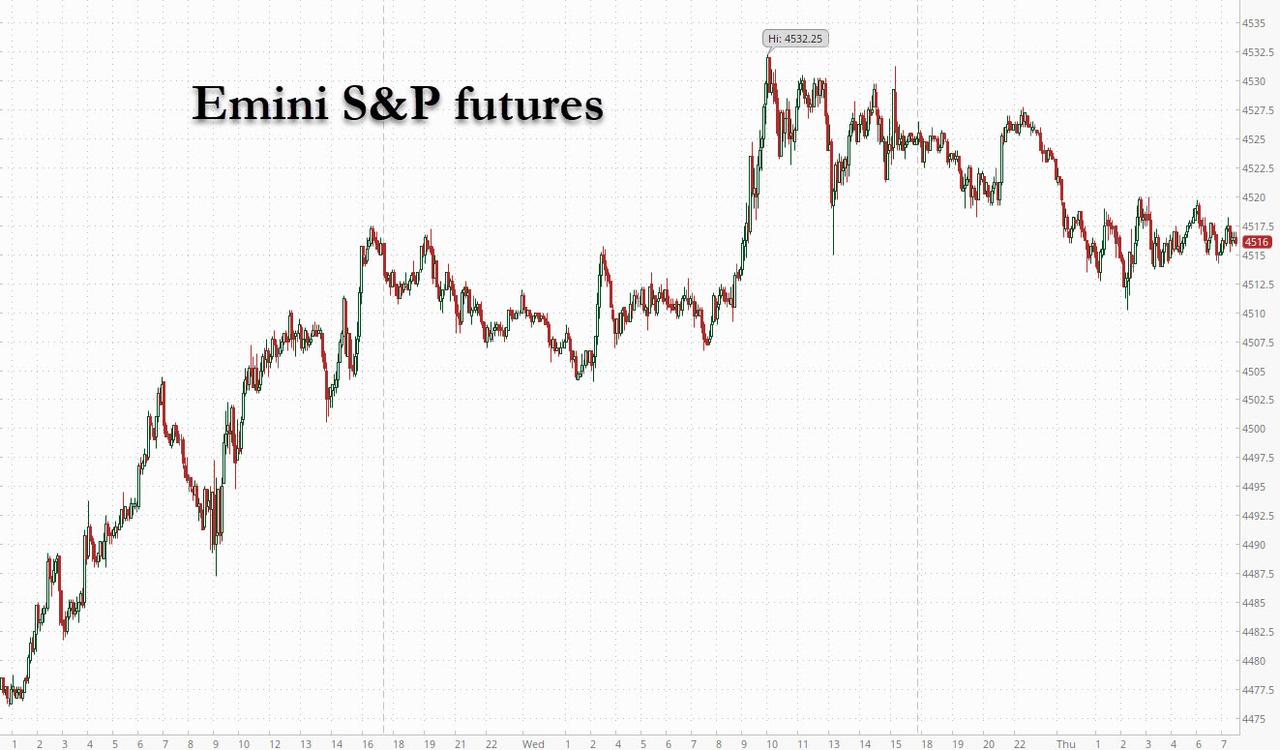
SPX futures made an overnight high at 4570.60 before easing down.  Tuesday’s high at day 270 remains the topof the Master Cycle .  The potential closing of the window for a new high is likely to be Friday (day273).  Friday’s options expiration remains modeately bullish above 4530.00, but turns negative quickly beneath it.  We have an aggressive sell signal beneath  the Cycle Top resistance.

ZeroHedge reports, “US equity futures rebounded from yesterday’s late-day selloff when a collapsing yield curve sent recessionary/policy-error shockwaves across market, as investors pointed to solid earnings to indicate that a slowdown is nowhere near. Nasdaq 100 futures led gains among other key U.S. gauges after setting an intraday record on Wednesday. Dow Jones and S&P 500 futures gained too. The 10-year Treasury rate was flat, while the two-year yield added five basis points. Oil was lower and the dollar was steady, while Bitcoin rebounded after the liquidity-draining Shiba Ina meltup finally cracked overnight.”


NDX futures made an overnight high at 15702.00 before easing down, leaving yesterday’s high as the Master Cycle top.

Charles Hugh Smith remarks, “While Corporate America is focusing on preserving its precious profits, its customers and workforce are rebelling by walking away.

We all see shrinkflation on a daily basis: the 16 ounce container is now 13 ounces, the breakfast cereal box is now so narrow it topples over, and so on.

More subtly, the quality of ingredients is also diminishing: sharp-eyed consumers note that salt, sugar and “artificial flavors” are increasingly used to mask the decline of quality as producers scrape the bottom of the barrel to eke out a profit.

A recent NPR article proposes another form of untracked inflation: Skimpflation, the decline of services as prices march higher. Meet Skimpflation: A Reason Inflation Is Worse Than The Government Says It Is (via C.A.).”


VIX futures consolidated at the upper range of yesterday’s highs and lows.  A buy signal may be generated at the confluence of the mid-Cycle resistance at the 50-day Moving Average at 18.97.  Hedge funds are buying protection despite the high elevaion of stocks.

The NYSE Hi-Lo index closed at 43.00 yesterday, beneath the 50-day Moving Averagae at 69.18.  We await a decline beneath 0.00 to produce a sell signal in equities.


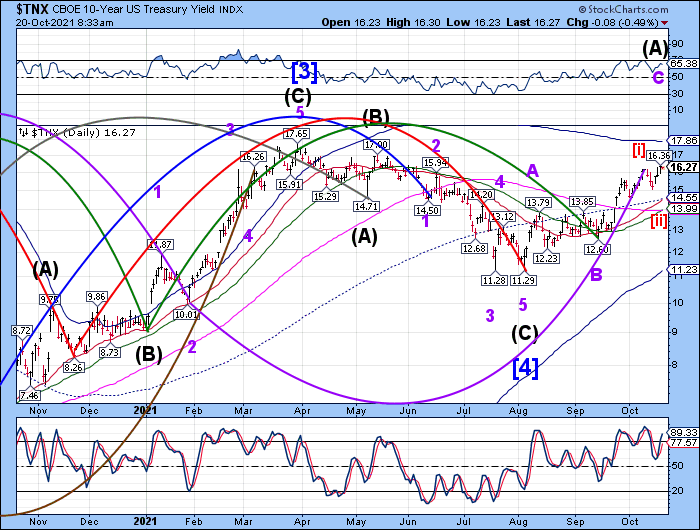
TNX began its first day of stength by rebounding from yesterday’s Trading Cycle low.   However, there may be antoehr short squeeze at today’s 7-year note auction.  This market is getting shook up by sudden reversals.  Who or what is generaing these short squeezes in highly suspect, as there is a larger than usual treasury note auction today.


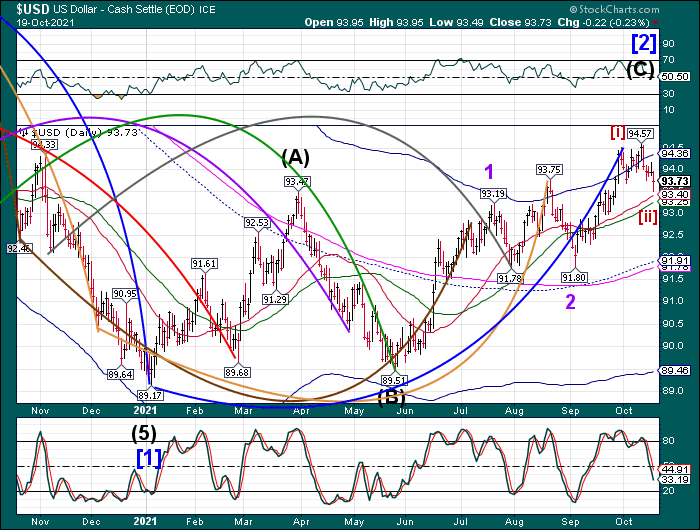
USD futures declined benath Intermediate-term support at 93.64 this morning, possibly touching the 50-day Moving Average at 93.35.  Once this move is accomplished, we may see strength return as it is due for a Master Cycle high during the second week of November.


Posted in Published | 3 Comments

October 27, 2021

3:45 pm  A website outage occurred shortly after this was posted.

6:00 pm, TNX futures dropped to 15.20 before bouncing to 15.50 this evening, possibly completing its Wave [ii] correction.  This prepares it for the burst of strength tomorrow and the follow-through that may bring it to a new high by the monthly options week in November.   Nothing like a short-squeeze to find money for the 5-year treasury auction.


ZeroHedge observes, “Similar to yesterday’s stellar 2Y auction, which many were worried would see a drop in demand only to be silenced by the burst in demand due to a furious scramble for physical paper on the back of a record front-end short (which we previewed earlier in the week), so a quick look at just how special the 5Y TSY had become ahead of today’s $61BN 5Y auction hinted that we would see another blockbuster sale.

That’s precisely what happened moments ago when the Treasury announced that demand for today’s 5Y auction was absolutely off the charts.

The high yield of 1.157%, while well above last month’s 0.99% and the highest since Jan 2020, stopped through the When Issued 1.182% by a whopping 2.5bps, which is the biggest stop through since we started compiling the data in 2015. It may be the biggest stop through in history.”


7:50 am

Good Morning!

SPX futures are hovering within 10 points of 4575.00, the Max Pain level for today’s expiring options.    Cycle Top support/resistance is at 4577.00 as the Master Cycle begins day 271.00 of an aging rally.  The Wave structure appears complete

ZeroHedge reports, “One day after US equity futures hit an all time high, rising to a record 4,590, risk sentiment has reversed and overnight index futures fluctuated and stocks in Europe retreated from a near-record on Wednesday after a flare up in U.S.-China tensions, signs of further regulatory crackdowns from Beijing, a decline in commodity prices, renewed concerns about economic growth and a rise in short-dated U.S. Treasury yields doused the equity market rally on Wednesday. At 7:45 a.m. ET, Dow e-minis were up 27 points, or 0.07%, S&P 500 e-minis were down 2.50 points, or -0.06%, and Nasdaq 100 e-minis were down 15.5 points, or 0.09%. Bonds and the dollar gained and bitcoin stumbled.”


NDX futures stumbled to a low of 15520.10 this morning on China woes.  QQQ (close: 379.12) futures are currently near 378.00 with Max Pain at 381.00.  At 380.00 there is open interest in puts at 14,602 while open interest in calls are at 5,629.

ZeroHedge mentions, “Risks, A Few, But Then Again, Too Few To Mention…

Markets will probably never go down again in our life-time. Stocks have of course reached a permanently high plateau. You know the drill…However, at fresh all-time-highs it is always prudent to re-visit the “risks” to the market. Please see a quick run-down of what the consensus risks to the equity bull are right now.

COVID Comes Back

Seems pretty clear that COVID “is coming back” again in some form over the next few weeks. Questions is, to what magnitude and will there be new restrictions? UK was early in the Delta wave. Now the number of UK Covid-19 hospital patients is highest since early March. And new restrictions are being discussed.”


VIX futures are consolidating inside yesterday’s trading range.  The decline to Friday’s low appears complete.  The current Cycles Model suggests further consolidation, but strength reappearing with a vengeance next week.

Businessinsider proclaims, ”

  • The stock market could still have more upside ahead if Wall Street’s fear gauge falls below a key technical level.
  • If the VIX undercuts 15, Katie Stockton of Fairlead Strategies expects a continued low-volatility environment for stocks, according to a Monday note.
  • The volatility index fell half a percent to the 15.34 level on Monday.

The stock market’s record-setting year could continue into year-end if Wall Street’s fear gauge falls below a key technical support level, Fairlead Strategies founder Katie Stockton said in a Monday note.

The CBOE Volatility index, known as the VIX, helps gauge the level of fear among investors and recently traded at 15.29 Monday morning.”


TNX slipped lower, increasing the probability of a low near 15.07, its Wave (a) low.  Yesterday’s 2-year auction turned out favoring the bulls.  However, the trend is up, and the current Master Cycle is due to end during the week of November 15.  The Cycles Model also suggests a dramatic increase in trending strength starting tomorrow.  Perhaps a failed 5-year or 7-year note auction (due at the end of the month) may set off a reversal higher.

ZeroHedge observes, “Amid growing concerns that today’s 2Y auction could be a disaster as a result of the recent push wider in short-dated yields, yesterday we noted that demand to borrow 2022-2024 maturities spiked since last week, while investor demand to get hold of cash securities to be short either outright or against futures has made specified collaterals more expensive, and the decline in those financing rates has trickled into the general collateral market.

In other words, everyone wanted to be short bonds but few had actual physical locate to short against.

Which brings us into today’s 2Y auction when the tenor was trading super special in repo, suggesting there would be major squeeze come the auction. That’s precisely what happened because contrary to fears of a disappointing auction, demand for 2Y paper was absolutely stellar (if for all the wrong reasons).”


Posted in Published | Comments Off on October 27, 2021

October 26, 2021

11:44 am

VIX did not make a new low this morning and does not appear to agree with the ramp in the SPX.  Wave (C) of Primary Wave [3] are wonders to behold, paraphrasing from Robert Prechter in Elliott Wave Principle (page 78).  “Third Waves are strong and broad, and the trend is unmistakable.”

ZeroHedge observes, “Realized Volatility Is Low

S&P 500 5-day realized volatility is below its 10th percentile since 1970. S&P 500 5-day realized volatility since 1970.”


10:35 am

SPX may have completed its rally at 4598.53 this morning.  If not, round number resistance at 4600.00 appears to be a strong reversal point.  It may be a fight to see if the Wednesday call options at 4600.00 will amount to anything.  Dealers may be resisting it.

ZeroHedge remarks, “Yesterday, we highlighted the ‘gamma bomb’ that sent TSLA stock soaring above $1000 and the company’s market cap above $1 trillion as total options volume of 3.55mm contracts in TSLA was also a single-day record.

However, as Nomura’s Charlie McElligott notes, most stunning was the fact that 54% of yesterday’s record options volume / flow was concentrated in the 10/29 weekly options, including 1.2mm Calls for just this Friday’s expiration… while the $5.11B of total Call premium vs the $279mm of total Put premium was an unheard of 18 :1 ratio.”


8:15 am

Good Morning!

SPX futures rose to a new all-time high at 4589.10 this morning as it stretches into day 270 of the Master Cycle.    The Elliott Wave structure suggests a Wave [v] of C of (5) may have begun with a potential target of 4650.00.  Wednesday’s options expiration shows little conviction with Max Pain near 4550.00.  Should the SPX rise above 4600, it may trigger positive gamma, since there at a net 3100 calls there.   It is possible that this trend may be over at Wednesday’s close.  Volume in this rally is declining, showing some skepticism about this leg higher.

ZeroHedge reports, “The wall of worry that preoccupied traders just weeks ago has melted away, and has been replaced with a global market melt up (just as Goldman predicted again this weekend), which pushed US index futures to a new all time high this morning when spoos hit 4,580.75, while propelling European and Asian stocks higher as corporate earnings helped boost sentiment amid lingering concerns about inflation and growth. As of 715am ET, US equity futures were up 0.42% or 19.25 points, Dow Jones futures were up 126 points or 0.35% and Nasdaq futures jumped 0.61%, extending cash market gains boosted by Tesla’s rally to a $1 trillion market value on a big order and Facebook’s results announcement revealing strong user growth and a $50 billion stock buyback. 10-year Treasury yields dropped by 1 basis point while the dollar slid to session lows. Bitcoin traded around $63,000.”


NDX futures rose to 15625.00 this morning.  There is still the real possibility of non-confirmation of the DJIA and SPX, especially should the reversal happen in the next 24-36 hours.  The Wave structure appears complete at the September 7 high.

ZeroHedge reports, “A powerful earthquake struck Taiwan Sunday and reportedly knocked some of Micron Technology Inc.’s facilities offline, according to Bloomberg.

On Sunday, an earthquake of magnitude 6.5 struck northeastern Taiwan. The quake was large enough to affect Micron’s facilities in the northern Taiwanese city of Taoyuan.

Micron is still evaluating the impact and “determining the appropriate steps to return to full production.” The statement by one of the top computer memory and computer data storage companies was vague and didn’t detail what exact product lines were impacted.

Micron is a top producer of semiconductor chips, and the ongoing shortage in the industry and new developments arising from Taiwan could darken the outlook for chips. Expectations for the chip shortage to normalize could be at least another year. ”

Charles Hugh Smith opines, “When the wreck is recovered, witnesses will wonder why they took such heedless, foolish risks.

You’re in the back seat wedged between tipsy revelers, the driver is drunk and heading into Deadman’s Curve at 90 miles per hour. Nobody’s worried because the driver has never crashed. Before they slid into euphoric incoherence, the other passengers answered your doubts with statistics and pretty charts showing that the driver had never had an accident, so there was nothing to worry about.

They also said that the driver’s Uncle Fed had rigged the vehicle with an anti-accident device, so a crash was impossible. One passenger blurted out that a fellow named Goldy Sacks said the driver could easily “melt up” and take Deadman’s Curve at 120 miles per hour without any trouble.

You see the problem here: the risk of crashing and expiring is soaring but the giddy occupants are completely confident there’s no risk, and this confidence is the source of the danger. If you’re sure Uncle Fed’s device can protect the vehicle from any crash, then why not take Deadman’s Curve at 90 miles per hour?

And if Goldy Sacks says you could actually take it at 120 miles per hour, then taking it at 90 MPH is actually quite prudent and cautious.”


VIX futures hovered above Friday’s low, briefly touching 14.90.  Today is day 258 for the current VIX Master Cycle, so it is possible for a new low.  Should it occur, the foray to a new low may be brief.

Bloomberg reports, “Two infamous stock volatility strategies on Wall Street look set for a comeback — with protective buffers this time round.

The U.S. Securities and Exchange Commission has approved rule changes that pave the way for a pair of ETFs from Volatility Shares LLC to list and trade. The two products will offer leveraged bets on the Cboe Volatility Index, or VIX.

The first will allow investors to short VIX futures — a popular way to bet on calm markets. The second is an amplified wager on the opposing trade: a jump in volatility.”


TNX may be in its final leg of a “running correction.”  A normal correction may revisit the Wave (a) low at 15.07 for completion.  However, this trend is strong enough to truncate Wave (c) at today’s low.  The reason is a burst of trending strength due today in the TNX Cycles Model.  In addition, Thursday and Friday also indicate potential stength.  TNX may be the runaway train that crashed the equities markets.

CNBC reports, “U.S. Treasury yields moved lower in volatile trading on Monday to start the final week of October

The yield on the benchmark 10-year Treasury note fell nearly 2 basis points to 1.636%. The yield traded as high as 1.673% earlier in the session. The yield on the 30-year Treasury bond slipped less than 1 basis point to trade at 2.086%. Yields move inversely to prices and 1 basis point is equal to 0.01%.”


USD futures appear to be consolidating above Intermediate-term support at 93.57.  The correction appears to be over and the rally may resume imminently.  There are two weeks left in this Master Cycle with strength surging in the second week of November.


Posted in Published | Comments Off on October 26, 2021

October 25, 2021

7:40 am

Good Morning!

The Dow Jones Industrials made a new all-time high on Friday, but the weekend futures only managed to consolidate within Friday’s trading range.  It is possible that Friday’s high on day 266 of the Master Cycle may be the top.  A breakdown beneath the Cycle Top support at 35650.00 may provide the first clue of a reversal.


Following up on Dow Theory, the Transports are not providing the confirmation needed by the DJIA to extend its highs much higher.  Both indices making new all-time highs are needed to declare the uptrend as healthy.  As you know, logistical errors and bottlenecks are  causing a slowdown in the delivery of goods across the nation at a reasonable price.  As a result, the economy is showing signs of stress.  Not only are grocery shelves going bare, but there are work stoppages due to the lack of parts and strikes due to labor restrictions and inadequate pay.


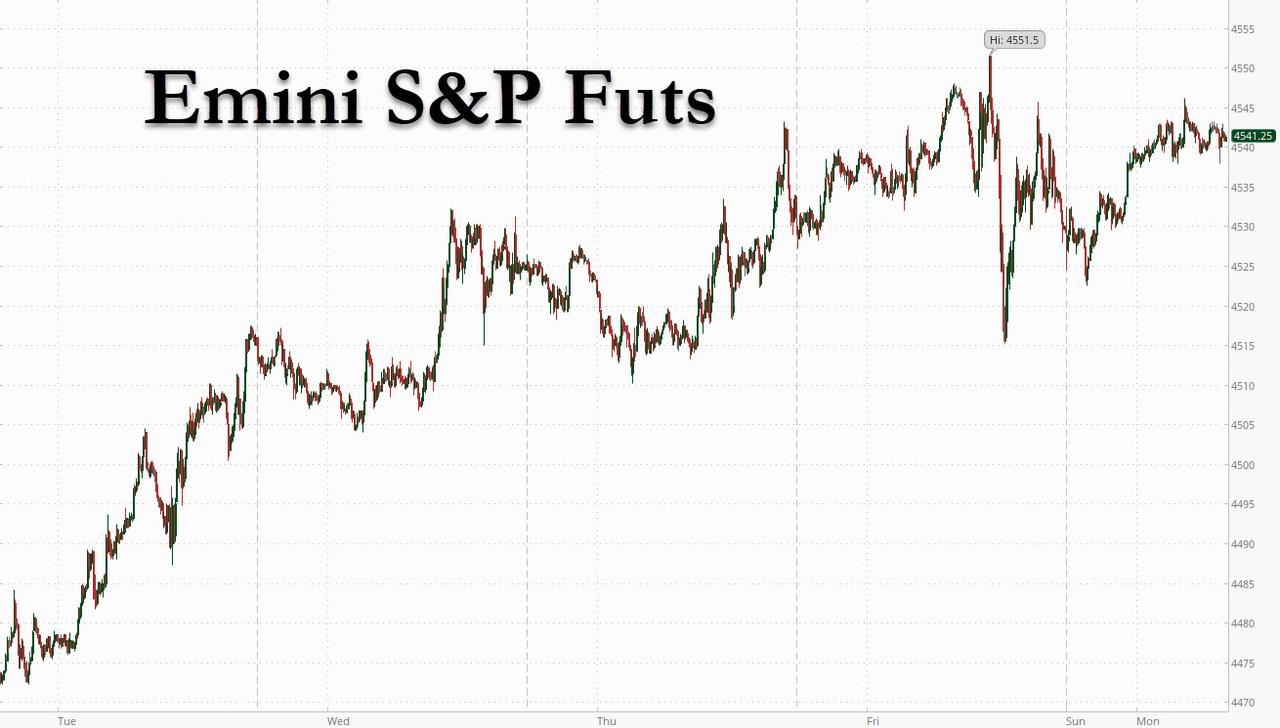
SPX futures hovered between 4531.00 and 4554.50 over the weekend.  Today is day 269 of the Master Cycle.  Today’s options expiration may remain at Max Pain at 4545.00, but beneath that it runs the risk of negative gamma building as it goes lower.  It’s a light option day, so dealers and hedge funds may not see the need to alter their holdings until SPX ventures beneath 4500.00.  Having entered the “positive season,” institutions see little reason to hedge against a possible sell-off.  A friendly reminder theough…the positive season going into year-end normally starts at a seasonal low, not a high.

ZeroHedge reports, “One day after Goldman doubled down on its call for a market meltup into year-end, futures on the Nasdaq 100 edged higher, while contracts on the S&P 500 were modestly higher on Monday, approaching record highs again as investors braced for a flood of earnings (164 of 500 S&P companies report this week) while weighing rising inflation concerns, Covid-19 risks and China’s deteriorating outlook (Goldman slashed China’s 2022 GDP to 5.2% from 5.6% overnight). The FOMC enters quiet period ahead of next week’s FOMC meeting, which means no Fed speakers as attention shifts to economic data and corporate earnings. At 745 a.m. ET, Dow e-minis were up 3 points, or 0.01%, S&P 500 e-minis were up 4.25 points, or 0.1%, and Nasdaq 100 e-minis were up 36.25 points, or 0.25%. Bitcoin bounced back over $63,000 after sliding below $60,000 over the weekend, the 10-year US Treasury yield rose and the dollar also rose after Federal Reserve Chair Jerome Powell flagged that inflation could stay higher for longer, fueling investor concern that sticky price increases may force policy makers to raise borrowing costs.”


VIX futures also consolidated within Friday’s trading range, neither going higher nor lower than Friday’s possible Master Cycle low on day 254.  The VIX and SPX Cycles don’t match, making the top in equities sloppy.    Last Wednesday’s high in the Hi-Lo makes Friday’s high in the DJIA and SPX and low in the VIX a likely scenario for the top in equities.

RealInvestmentAdvice observes, “Market Surges Toward Previous Highs

Last week, we discussed the “correction being over” for the time being.

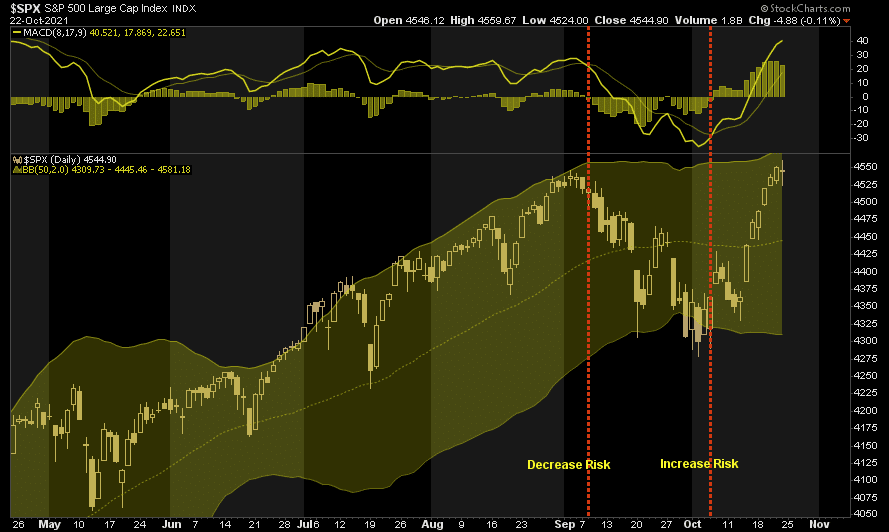
“While the market started the week a bit sloppily, the bulls charged back on Thursday as earnings season officially got underway. With the market crossing above significant resistance at the 50-dma and turning both seasonal “buy signals” confirmed, it appears a push for previous highs is possible.

Two factors are driving the rebound. Earnings, so far, are coming in above estimates. Such isn’t surprising as analysts suppressed estimates going into reporting season. Secondly, bond yields declined.“

Chart updated through Friday.

Stocks Earnings Risk, Stocks Surge As Earnings Roll-In, But Is Risk Gone?

However, to expand on a point from last week, breadth remains dismal, with only 60% of stocks above their respective 50-dma even though the index is at all-time highs.”


TNX appears to be consolidating near Friday’s high.  This week it is due for a minor pullback but not likely to go far.  Trending strength may come back on Wednesday, so a trade may not be warranted.


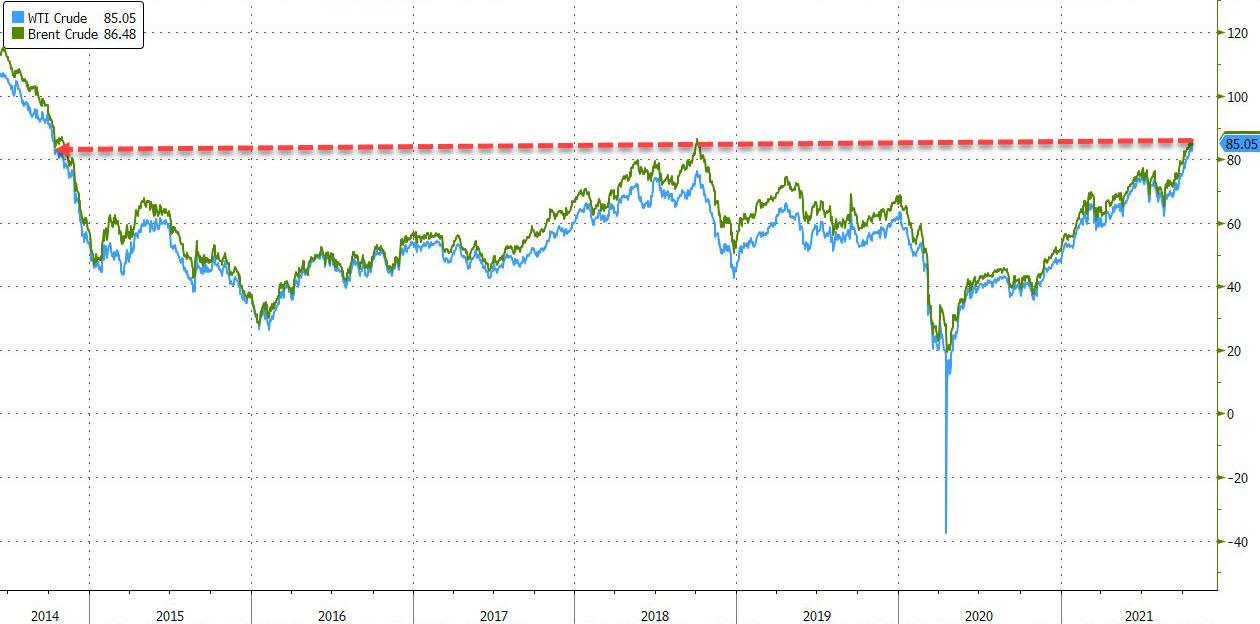
Crude oil futures continue to rise to new highs at 85.36, exceeding its 2016 high on Friday.  Crude may have completed a running correction, with a practically non-existent pullback last week.  The Cycles Model favors a continuation of this rally for the next 4 weeks before a larger pullback may be made.

ZeroHedge observes, “It’s remarkable that just last April, West Texas Intermediate crude was trading at a negative $40. Well, fast forward to today when moments ago, the US black gold grade just topped $85 for the first time since 2014, the landmark in a global energy crunch that has seen prices soar. Brent traded about 150 cents higher as the spread between the two grades has narrowed sharply in recent weeks.

Oil has jumped in recent weeks as natural gas prices hit records; as a result of rising gas-to-oil switching overnight Goldman forecast that the surge in gas prices could add at least 1 million barrels a day to oil demand “with current gas forwards incentivizing this through winter.” In the note from Goldman commodity analyst Callum Bruce, the bank also estimated that global oil demand has surpassed 99 mb/d and will shortly hit its pre-COVID level of 100 mb/d as Asia rebounds post the Delta wave.”


Posted in Published | Comments Off on October 25, 2021

October 22, 2021

8:00 am

Good Morning!

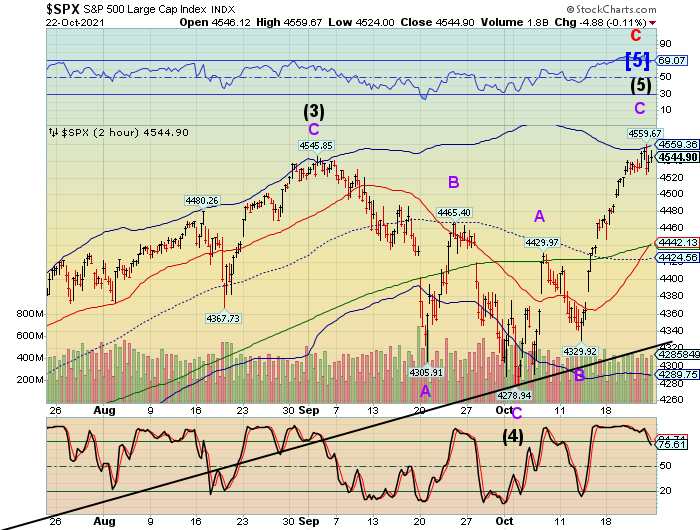
SPX futures are now testing the Cycle Top resistance at 4555.49 on day 266 of the Master Cycle.  Though unexpected, this should not be considered out-of-the ordinary as Cycles may expand or contract based on various inputs.   The single most obvious input today is options expiration.  Since dealers and hedge funds are net long, today’s options expiration may be a way to reduce long exposure without massive sales.  The shares are simply transferred to the options holders, who then may hold or sell.  In the meantime, the dealers book a profit at all-time highs.

ZeroHedge reports, “S&P 500 futures traded to within 2 points of their September all time high, rising 0.12% to 4547, just shy of their 4549.5 record after China’s Evergrande unexpectedly made a last minute coupon payment, averting an imminent weekend default and boosting risk sentiment. But while spoos were up, Nasdaq futures edged -0.18% lower after Intel warned of lower profit margins, while Snap crashed 22%, leading declines among social media firms after flagging a hit to digital advertising from privacy changes by Apple. Intel plunged 10% in premarket trading as it missed third-quarter sales expectations, while its Chief Executive pointed to shortage of other chips holding back sales of the company’s flagship processors. 10Y yields dropped 2bps, the dollar slumped and bitcoin traded above $63,000. Fed Chair Powell is scheduled to speak at 11am ET. “


VIX futures tested yesterday’s low at 14.92 this morning but has not gone lower.    Today is day 254 of the VIX Master Cycle.  While it may go lower, the June low appears to be the limit.

ZeroHedge asks, “What If COVID Rears It’s Ugly Head Again?

The financial market focus on COVID has been much lower over the past few weeks. But what if COVID will be like the Halloween monster that always comes back? We now had the first major new lock-down in a “European” country – Latvia – that closes for 4 weeks. Latvia is “early” in entering the dark, cold and depressing northern hemisphere autumn & winter season…Now, Latvia has a pretty poor vaccination rate (just touching 50%) but so do many other countries around the world. Can COVID be the real “I will be back” monster for this Halloween?”


TNX futures climbed to a morning high of 16.99, suggesting the cash market may do the same.  If you think this is crazy, the Cycles Model calls for a triple play of trending strength next week.  If the media doesn’t report it, will it go away?


USD futures appear to be consolidating after yesterday’s corrective low.  The consolidation may not last, as the Cycles Model suggests trending strength comes roaring back as early as today.


Posted in Published | Comments Off on October 22, 2021

Ocober 21, 2021

10:20 am

SPX may have made its secondary high this morning, exactly 34.4 market days from its all-time high.  Noting confirmed yet.  Just though you’d like to know.


8:20 am

Good Morning!

The Industrials made a new all-time high yesterday, above the August 16 high of 35631.91, but was not accompanied by the other indexes.  US 30 futures made a morning low of 35483.20, having made no follow-through to yesterday’s high.  In addition, none of the other indices followed the DJIA to a new all-time high.  Dow Theory states that a new high must be confirmed by another index making a similar breakout to a new high.  The reversal without confirmation of a new high by other indices is problematic.  Note the declining volume after the September 20 low, giving us another non-confirmation.


Dow Theory takes its primary confirmation from the Dow Jones Transportation Average, which is lagging substantially behind the Dow 30 Industrials.  Logistical problems, high fuel costs and lack of manpower all suggest that the Transports may continue to lag the Industrials.  While Dow Theory is not a foolproof means of judging the markets, it still may be used as a guide to the market’s health.


SPX futures slid to a morning low of 4518.80.  Not enough to call it a reversal, but intriguing that it stopped short of a new high yesterday and has lost momentum.  4500.00 is still the critical juncture for tomorrow’s options, with the Max Pain zone at 4485.00.  While the primary dealers and hedge funds are interested in the least payout, they are still primarily long, with hedge funds being leveraged long.

ZeroHedge reports, “US index futures dropped after IBM and Tesla fell after their quarterly results, with investors turned cautious awaiting more reports to see the see the adverse impact of supply chain disruption and labor shortages on companies even as jitters remained over elevated inflation and the outlook for China’s property sector. The dollar reversed an overnight drop, while Treasuries fell pushing the 10Y yield to a 5-month high of 1.68%. At 745 a.m. ET, Dow e-minis were down 98 points, or 0.3%, S&P 500 e-minis were down 14 points, or 0.31%, and Nasdaq 100 e-minis were down 49.25 points, or 0.32%.”


VIX futures climbed to 16.11 in the overnight session.  The 50-day Moving Average is at 18.84 and may be used as a buy signal.

RealInvestmentAdvice asks, “Is A Volatility Storm Coming?

“Volatility often refers to the amount of uncertainty or risk related to the size of changes in a security’s value. A higher volatility means that a security’s value can potentially be spread out over a larger range of values. This means that the price of the security can change dramatically over a short time period in either direction.”    – Investopedia

Federal Reserve Bond Tapering & Interest Rate Hikes Reduce Liquidity

Federal Reserve liquidity injections have bailed out the economy and equity markets for the last 18 months. And as a result, the bailout created a relatively low volatility environment for equity and bond markets.  Will the announced withdrawal of Fed injections of $120B per month set up the monetary system for higher volatility?  We see major economic forces combining in the intermediate future to create a possible ‘volatility storm’ driving valuations down. These economic forces include:

  • Fed tapering
  • Interest rate hikes
  • Inflation
  • Labor wage increases.

One of these macro factors is a challenge for monetary policymakers to mitigate damage to the financial system.  But, a combination of these factors already building may overwhelm the monetary system. Further, markets are at historic high valuations today. But, market weaknesses and structure, along with valuations may create optimal conditions for a volatility storm.”


TNX has reached a new 5-month high at 16.75 (16.82 in futures) this morning.  Normally we would see a pullback in the next day or two before new highs are made, but the strength of the rally is evident and even more strength appears to be due starting Tuesday of next week.

ZeroHedge reports, “After last week’s solid auctions, traders were optimistically eyeing today’s 20Y auction – in the form of a 19-Yyear 10-Month reopening – as some speculated that just because this may be the last fully-sized, $24BN auction before the Treasury starts shrinking the notional next month, demand would be stellar. It wasn’t.

Stopping at 2.100%, more than 30bps above the September 1.795% high yield, the auction not only had the highest yield since June, but tailed dramatically to the 2.075% When Issued, the biggest tail in the 20Y auction history (which, of course, is not that long since the first auction was just last May).

The ugliness spread to the bid to cover, which slumped to 2.25 from 2.36, well below the six auction average of 2.36 and also the lowest since May.”


USD futures tested Intermediate-term support at 93.41 this morning, but appears to be on the rise again.  The Cycles Model calls for a Master Cycle high in the week of November 8.


The GSCI Ag Index climbed above its 50-day Moving Average at 414.25 and is on a buy signal.  The Cycles Model implies a continued uptrend until mid-December.  Serious flooding in China and India have exaserbated food shortages in Asia and

ZeroHedge remarks, “US restaurant chain Caribou Coffee Co. is panic hoarding coffee beans as a global supply deficit grips the world and fuels inflation.

“We continue to increase safety stock on key items,” CEO John Butcher told Bloomberg. Besides coffee beans, he said the company is loading up on cups, lids, packaging, chocolate, and anything that comes to mind as supply chains remain snarled.”


Posted in Published | Comments Off on Ocober 21, 2021

October 20, 2021

3:05 pm

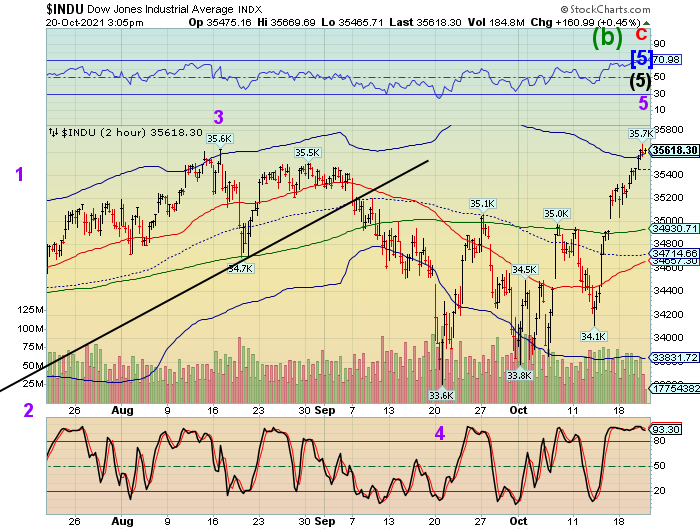
You may recall that in early September when the SPX finished its 5th Wave, I noted that it was missing in the DJIA.  Well, here it is.  The SPX, while very close, has not made a new high.  This created an interesting divergence.  The Wave structure now agrees that both indices may go down in unison.


8:15 am


Good Morning!

SPX futures are flat on day 264 of the Master Cycle.  In today’s expiring options, calls dominate above 4500.00.  Puts gain ascendance at 4475.00 and lower.  Max Pain lies somewhere between those two points.  This is where either the bulls take over and make new highs or an “accident” happens that causes a panic over the next week.  The 1987 crash happened in 4.3 days.

ZeroHedge reports, “US index futures were little changed as investors weighed the start of the earnings season against growing stagflation, tightening, energy crisis, China property and supply risks. S&P 500 futures were flat after the cash index edged closer to a record on Tuesday, rising above 4,500. Contracts on the Nasdaq 100 were also unchanged after the main index rallied for the past five days. At 7:30 a.m. ET, Dow e-minis were down 8 points, or 0.02%, S&P 500 e-minis were down 1 point, or 0.03%, and Nasdaq 100 e-minis were up 5 points, or 0.03%. Oil was down and the dollar steadied. Bitcoin traded just shy of its all time high overnight, and was last seen around $64,000.”


VIX futures made a morning low of 15.60, not breaking yesteray’s low.  Today is day 252 of the VIX Master Cycle.  Should it repeat the pattern of 8.6 months ago, a slingshot move may be in the making.

The NYSE HiLo Index closed at 104.00 yesterday after reaching a high of 183.00.  Although it closed 10 points higher than the day before, the trend is lower.

ZeroHedge warns, “He just called us…

Yesterday, before the market closed, our “VIX guy” called us explaining the case for a continuation of the VIX collapse.

Arguments are basically that everything is awesome and no risks can affect this market as strong seasonality is upon us.

We agree on the seasonality factor, but when the VIX guy calls us explaining why VIX should go even lower post this last volatility reset we get “uneasy”. He continues to hold a 100% inverse track record.

It is probably time to look at some cheap protection trades.”


TNX appears to be in a short-term decline, perhaps to the mid-Cycle support at 14.55 in the next few days.  The reason?  Should equities sell off, the knee-jerk reaction would be to buy treasuries.  The Cycles Model suports that thesis with a triple dose of strength roaring back early next week.

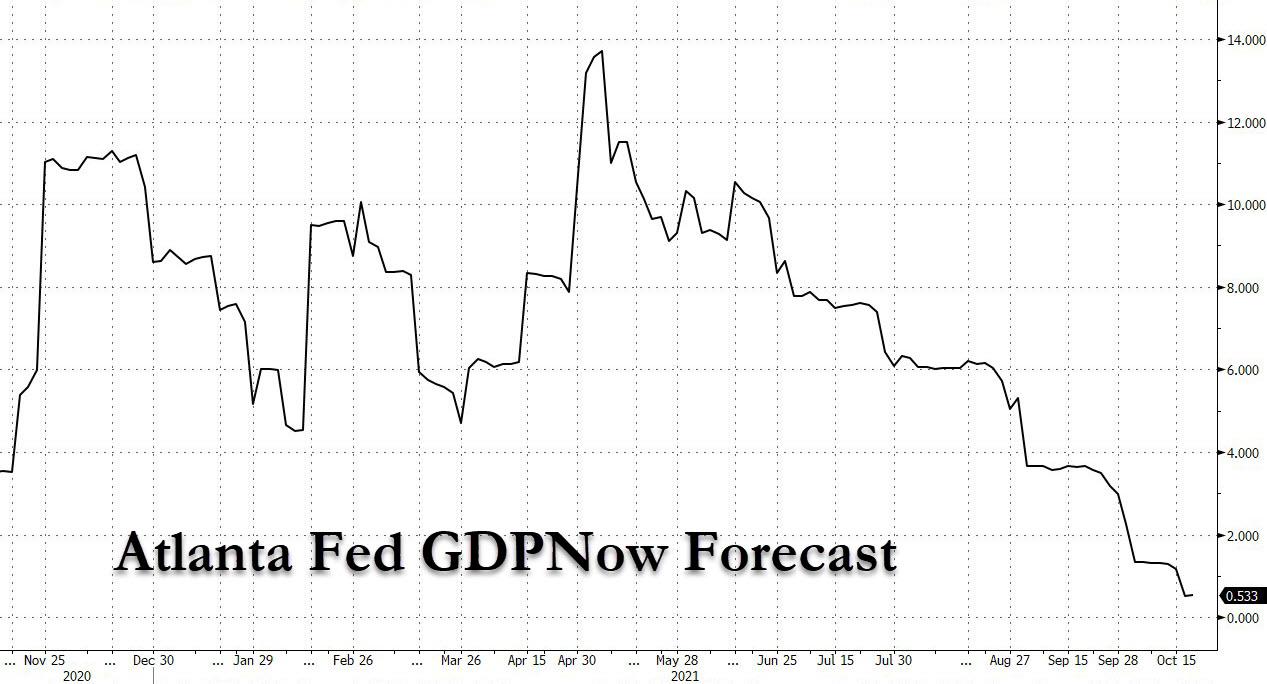
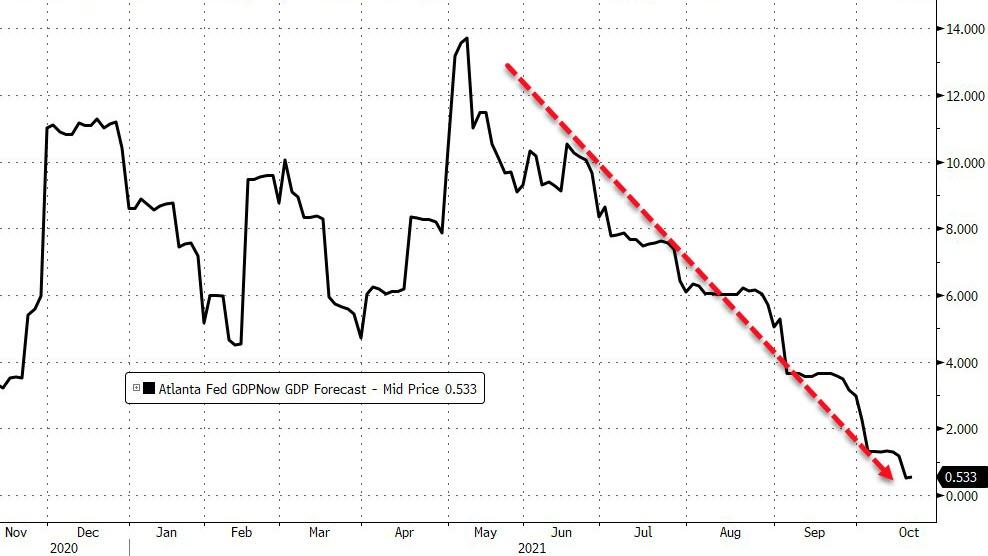
ZeroHedge observes, “t a time when the Wall Street banks are scratching their heads for credible explanations why they are keeping (or raising) their year-end S&P targets at a time when economic growth is in freefall and inflation is soaring (read: stagflation), an unexpected source of honesty has emerged – the Atlanta Fed, which now sees the US on the verge of contraction.

In its latest GDPNow forecast published moments ago, the Atlanta Fed slashed its estimate for real GDP growth in the third quarter of 2021 to just 0.5%, down from 1.2% on October 15, from 6% about two months ago, and down from 14% back in May.

Remarkably, the GDPNow tracker is about to turn negative even as the average “blue chip” Wall Street baank has a Q3 GDP forecast of just below 4%.”


USD futures appear to be re-testing yesterday’s low which may have completed the correction to the rally.  This may be suported by the Cycles Model which suggests strength building over the weekend and coming into full bloom by mid-November.


WTIC futures appear to be coming down from Monday’s high, an unusually long Master Cycle of 278 days.  The call for $100.00 oil or even $200.00 oil may be a bit premature.  While shortages of oil derivatives (propane) are appearing and gasoline prices have exceeed their 2018 highs, there is a possibility of a slowdown large enough to correct the current trend.

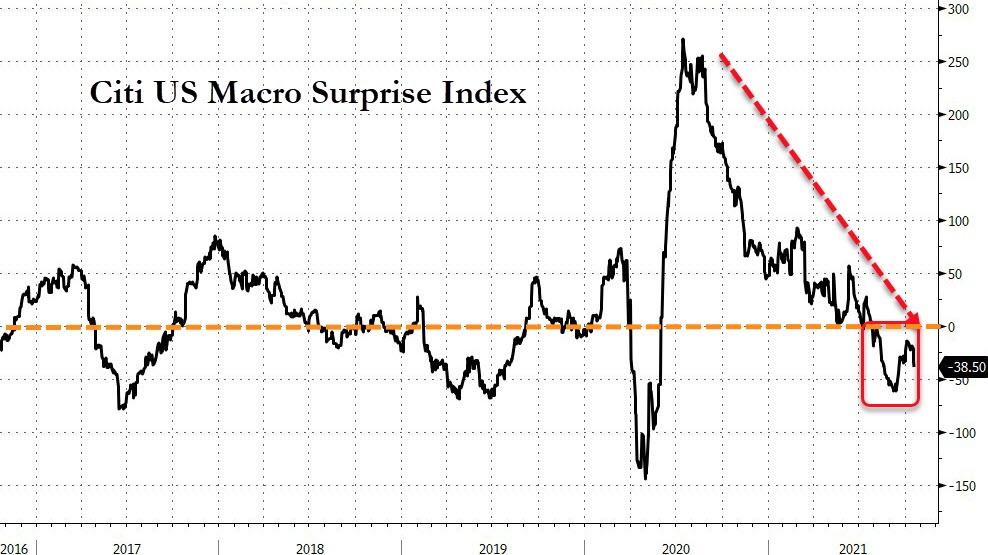
ZeroHedge observes, “US macroeconomic data has been broadly disappointing for months…

Source: Bloomberg

And that has driven forecasts for GDP growth into the floor. Just yesterday, The Atlanta Fed’s GDPNOW model adjusted to forecast just 0.5% GDP growth…

Source: Bloomberg

And at the same time, the market is pricing in an increasingly hawkish trajectory for taper and rate-hikes from The Fed…”


Posted in Published | 1 Comment

October 19, 2021

8:00 am

Good Morning!

SPX futures are now above 4500.00 as Intermediate Wave (B) continues its ascent on borrowed (literally) time.  Today is day 262 of the current Master Cycle.  Since Cycles are organic, so inputs, such as cash, tend to lengthen the growing season.  Wednesday’s options expiration is light, but calls dominate above 4425.00.  Hedge funds and dealer banks are surprisingly long and the talk on Wall Street is bullish.

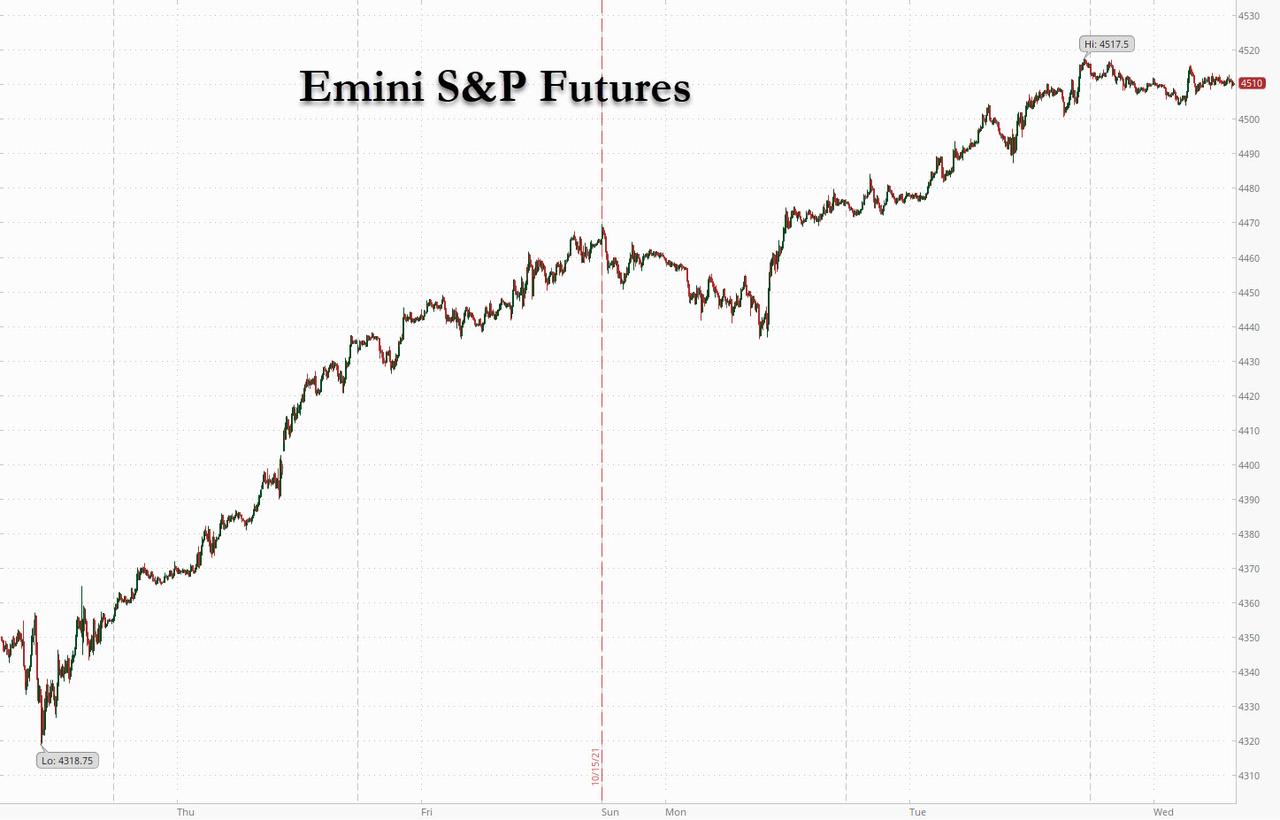
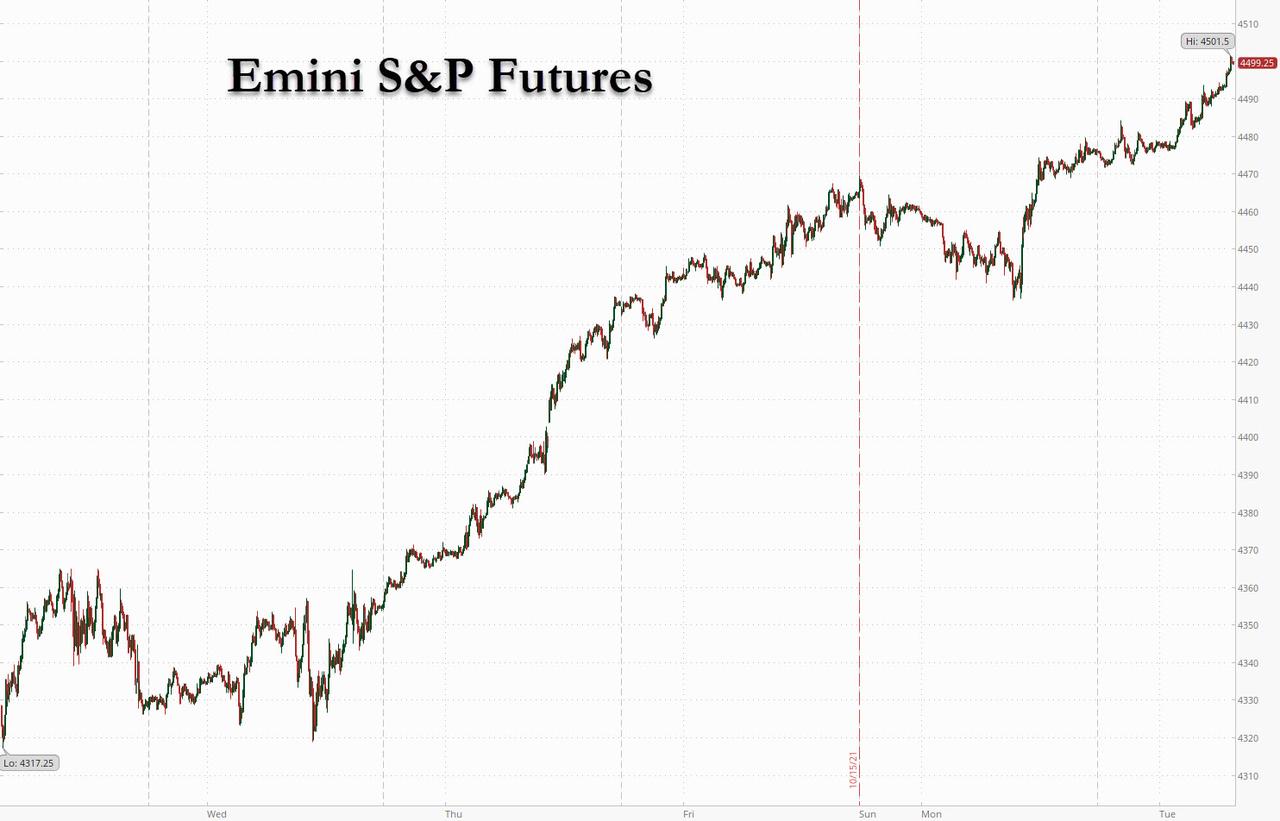
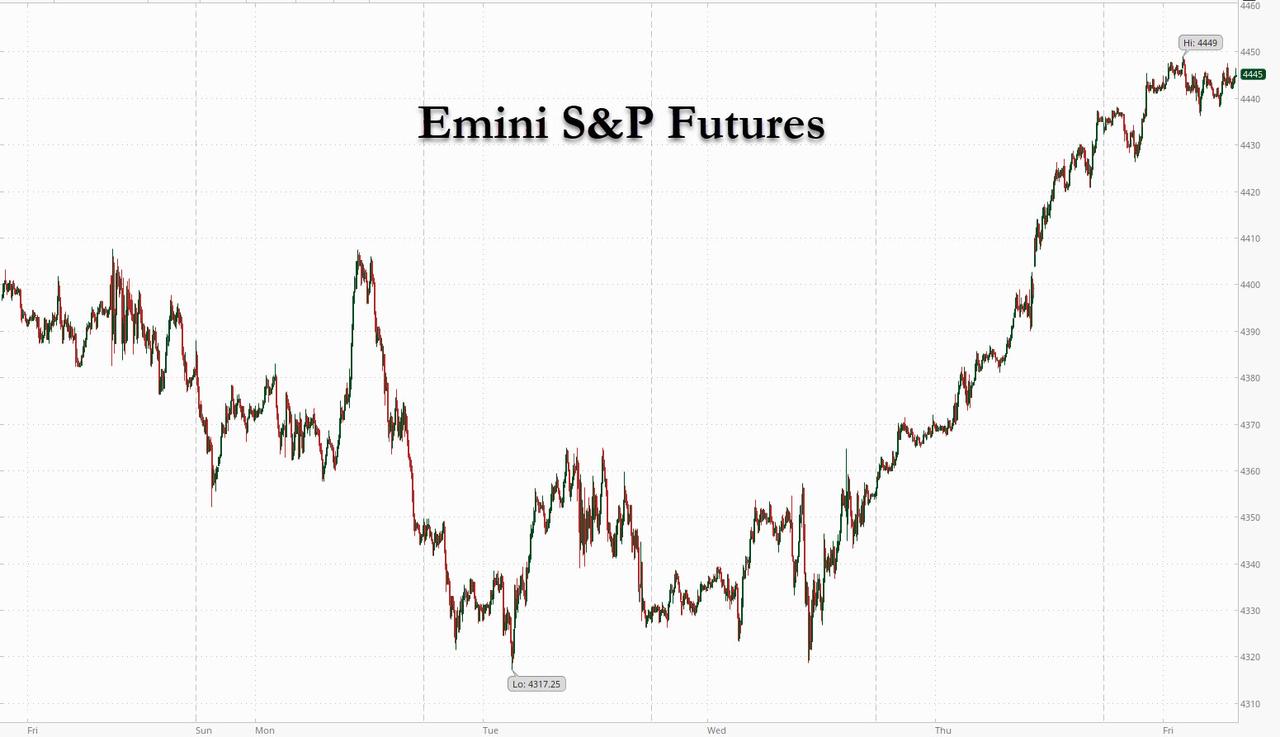
ZeroHedge reports, “Over the weekend, a Goldman flow trader explained why it expected a powerful market meltup to emerge in coming days, and this time Goldman was right because after trading at 4317 just one week ago, spoos are now almost 200 points higher, rising above 4500 this morning after a powerful ramp pushed US equity futures and global markets as an upbeat profit forecast from Johnson & Johnson which boosted (get it “boosted”) its Revenue and EPS guidance, added to the positive momentum in corporate earnings generated by big banks last week and helped counter concerns about elevated inflation. At 715 a.m. ET, Dow e-minis were up 183 points, or 0.52%, S&P 500 e-minis were up 22.75 points, or 0.51%, and Nasdaq 100 e-minis were up 61.75 points, or 0.40%. Treasury yields were unchanged at 1.60% and the dollar slumped to a 4 week low.


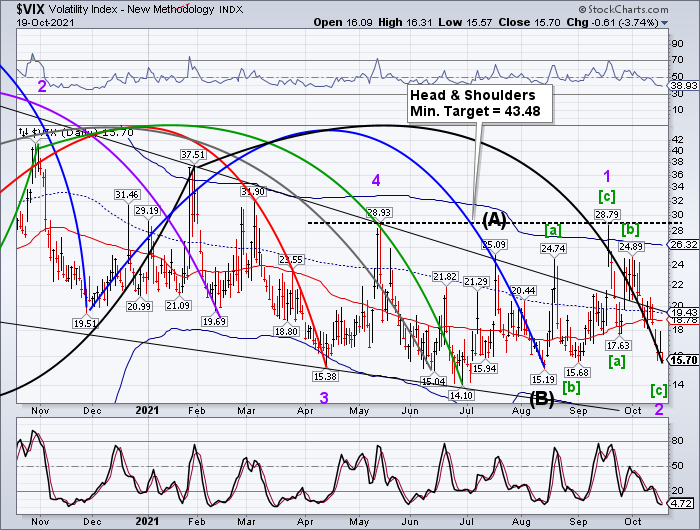
VIX futures traded at a low of 15.95 this morning, possibly verifying Friday’s Master Cycle Slingshot low.  Traders often misread the VIX, conflating a low VIX with a rising market.  However, the market rises “best” with a declining VIX.  Once the decline has stopped, the risk of a reversal rises.  In addition, the Cycles propose a possible “slingshot move” that may be aimed at the Head & Shoulders target within 8.6 market days.

Yesterday’s NYSE Hi-Lo closed at 94.00, 81 points beneath Friday’s close.


TNX made a new corrective low, but quickly recovered.  Wave [ii] corrections may go higher than the Wav e[i] high.  The Cycles Model suggests a brief pullback this week, but trending strength may return next week.


USD futures made a low of 93.49, which may complete the corrective pattern.  If not, any further decline may be short-lived, as trending strength may re-emerge early next week.  A Master Cycle high may be due the week of November 8.


Posted in Published | 4 Comments

October 18, 2021

7:50 am

Good Morning!

SPX hit its lesser targer at 4475.00 on Friday, day 259 of the Master cycle.  Friday was calendar day 43 from the all-time high.  Now for the decline.

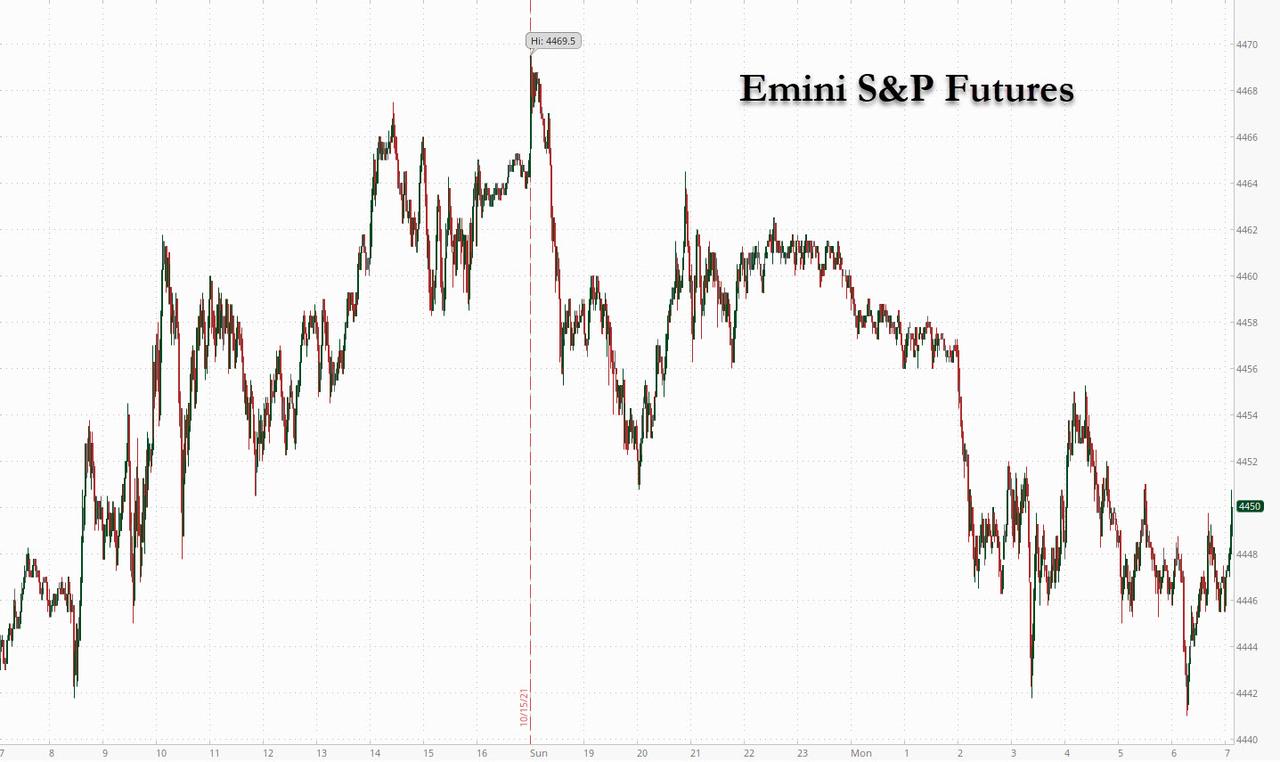
SPX futures made a low of 4450.10 this morning before a minor bounce.  It renews its sell signal beneath the 50-day Moving Average at 4437.67.  Today’s options expiration still appears to dominate trading.  The Max Pain zone is at 4465.00 with calls dominating above and puts in charge below.  The 50-day Moving Average is at 4437.67 with a second bearish cross in place.

ZeroHedge reports, “US equity futures and world shares drifted lower following poor Chinese macro data which saw the country’s GDP slide to a weaker than expected 4.9%, and as surging energy prices and inflation reinforced bets that central banks will be forced to react to rising inflation and hike rates faster than expected. Calls by China’s President Xi Jinping on Friday to make progress on a long-awaited property tax to help reduce wealth gaps also soured the mood. With WTI crude rising to a seven-year high, and Brent back over $85, investors remain concerned that living costs will be driven higher. The economic recovery also remains uneven with China’s gross domestic product slowing more than expected in the third quarter, increasing aversion to riskier assets. The dollar rose against all of its Group-of-10 peers as concerns about an acceleration in inflation damped risk appetite, while bircoin traded above $61K and just shy of an all time high ahead of the launch of the Proshares Bitcoin ETF on Tuesday.

An MSCI gauge of global stocks was down 0.1% by 0808 GMT as losses in Asia and a weak open in Europe erased part of the gains seen last week on a strong start to the earnings season. U.S. stock futures were also lower with S&P 500 e-minis last down 0.2%, while Dow and Nasdaq e-minis were both down 0.3%.


VIX futures surged to a morning high of 17.70, still beneath the 50-day Moving Average at 18.84.

Friday’s low (day 247) may be part of a “Double Master Cycle” where we see a major high and low in very close proximity, known as a “slingshot move”.  Friday’s Cycle low originated 8.6 months ago as a Master Cycle high on January 29 (day 238).  8.6 market days later and nearly 50% lower, a second Master Cycle was formed on day 250.  We may now anticipate a similar move, in reverse, during the next 8.6 market days.  It may be an interesting trade, for those that can catch it.


TNX has just exceeded it prior Master Cycle high, creating what is known as a “running correction.”  The rally may continue in corrective form over the next two weeks.  Due to the strength of this rally, the new Master Cycle may end at a high at or above its November 2019 high at 19.71.

RealInvestmentAdvice considers, “Investors are slowly waking up to the realization that “stagflation” is a problem. For years, the term “stagflation” has been thrown around and dismissed like a sighting of “Bigfoot.” However, rising inflationary pressures are now colliding with slowing economic growth. This collision presents a challenge for Central Bankers and their monetary policy experiments.

Let’s start with a definition of “stagflation.”

“Stagflation is characterized by slow economic growth and relatively high unemployment—or economic stagnation—which is at the same time accompanied by rising prices (i.e. inflation). Stagflation can be alternatively defined as a period of inflation combined with a decline in the gross domestic product (GDP).” – Investopedia

As stated, many believe stagflation is impossible due to the economic theories that dominate academic and policy-making circles. The construction of the economic models ruled out the possibility that you could have slow economic growth and high inflation simultaneously.”


USD futures appear to be consilidating, although there may be a resumption of the rally.  The Cycles Model shows strength starting early this week and extending through mid-November.


Gold futures made a new low at 1760.35 this morning as it ventures lower to the trigger point of the Broadening Wedge formation at 1750.00.  The Cycles Model suggests that, once beneath the trigger, the decline may strengthen dramatically.  However, there may be yet another bounce at the neckline of the Head and Shoulders formation.


Posted in Published | 2 Comments

October 15, 2021

7:30 am

Good Morning!

My wife and I are leaving for a “destination wedding” at Boyne Falls this weekend.  The colors should be magnificent.

SPX futures rose to an overnight high of 4457.80 where Wave [v] of C is .62 times Wave [i] of C.  Wave [v] of C is often equal to Wave [i] of C at 4475.00.  Generally C Waves are equal to their corresponding A Waves which makes the potential target at 4480.00.  It appears that, while the time target has been made, the distance target may have another probe higher.  Today is day 259 of the current Master Cycle.  Up to a week ago, I could not imagine that this Cycle would end in a high.

In today’s options market, 4435.00 appears to be the Max Pain level, while options become bullish at 4450.00.  Positive gamma becomes irresistable at 4475.00.  In SPY (442.50), the battle rages with open interest at 75,326 at 440.00 calls in todays expiration, while open interest in puts is 84,369 puts at today’s expiration,  That may also be the Max Pain level, although the dealers and hedge funds that sold these option may be like a cat on a hot tin roof.  Which way to jump?

ZeroHedge reports, “One day after the S&P posted its biggest one-day surge since March, index futures extended this week’s gains, helped by a stellar bank earnings, while the latest labor market data and inflation eased stagflation fears for the time being. . The 10-year Treasury yield rose and the dollar was steady. Goldman Sachs reports on Friday. At 715 a.m. ET, Dow e-minis were up 147 points, or 0.42%, S&P 500 e-minis were up 16.5 points, or 0.37%, and Nasdaq 100 e-minis were up 42.75 points, or 0.28%.”


VIX futures made a new low this morning at 16.55.  While this looks like a Master Cycle low, today is only day 247.  It’s not impossible for a Cycle to go from low to high in 8.6 market days.  That puts us at Wednesday October 27 as a potential Master Cycle high.  The Wave structure is winding up for an upward probe that may be a multiple of Wave 1.


The KBW Bank Index has stopped making new highs on Monday, which is a puzzle after blow-out earnings being reported on all but Wells Fargo during the week.  I made comment on it earlier this week that the timing was noteworthy based on the Cycles.  Now we have something else to consider.

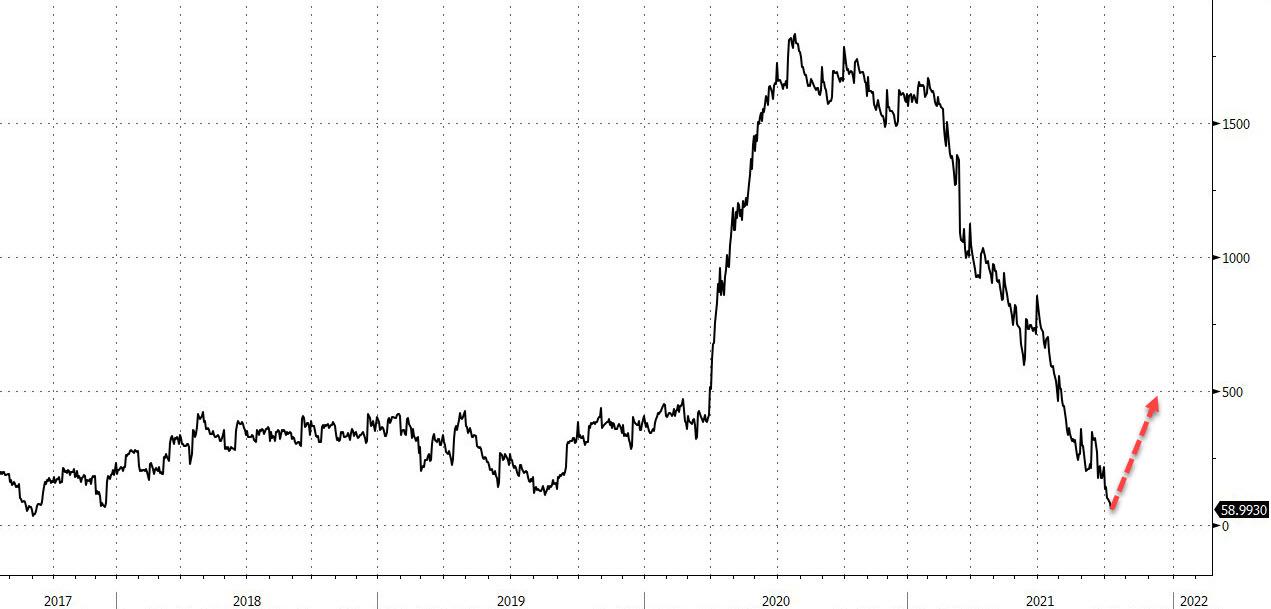
ZeroHedge remarks, “Back in February, when looking at the Treasury’s debt and cash projections, we warned that the market was about to be hit with “Mind-Boggling Liquidity” as the Treasury was about to release some $1.1 trillion in cash from its account at the Fed (the Treasury General Account or TGA), in effect conducting a parallel – and stealth – QE to the Fed’s own $120BN/month liquidity injections.

That’s precisely what happened, and since then, Treasury cash levels collapsed from an all time high of $1.8 trillion down to the previous target of $300 billion, and then continued dropping as the Treasury used up most of its cash to plug holes associated with the ongoing debt ceiling drama.

But that’s now over, at least until December, and with Treasury cash dropping to a 4 year low of $59 billion on Wednesday, the Treasury is now set for a sharp liquidity drain as it seeks to build up some $480 billion in funding through the early December debt ceiling reprieve, which is how much time and capacity Janet Yellen bought herself with the stop-gap debt ceiling deal that passed just in the nick of time last week when Senator McConnell caved to the democrats.”


TNX bounced this morning after the first leg of its correction.  The Cycles Model suggests TNX may ride on trending strength above last week’s high.  It also indicates the corrective phase may last until mid-November.


The GSCI Ag Index appears to have completed a Trading (minor) Cycle low and may break above its resistance area.  The current Master Cycle is due for completion in mid-December.  Don’t let the modest uptrend fool you.  We may see growing trending strength into the end of October.

ZeroHedge remarks, “At least someone is honest when it comes to soaring food inflation:

“Food is too cheap,” Ranjit Boparan, who is known as the “Chicken King” in the UK, was quoted by Reuters 

“In relative terms, a chicken today is cheaper to buy than it was 20 years ago. How can it be right that a whole chicken costs less than a pint of beer? You’re looking at a different world from now on where the shopper pays more,” Boparan said, who produces 33% of all poultry products in the country. ”

TheEpochTimes reports, “Compared with just one month ago, consumers are paying slightly more for most goods and services. Compared with a year ago, however, they’re paying significantly more, according to Labor Department data released this week.

The Labor Department reported that the consumer price index, a key inflation gauge that measures how much Americans pay for goods and services, rose about 0.4 percent in September. The year-over-year prices increased 5.4 percent, which some noted is the largest yearly increase since January 1991.”


Posted in Published | 1 Comment