
7:50 am

Good Morning!
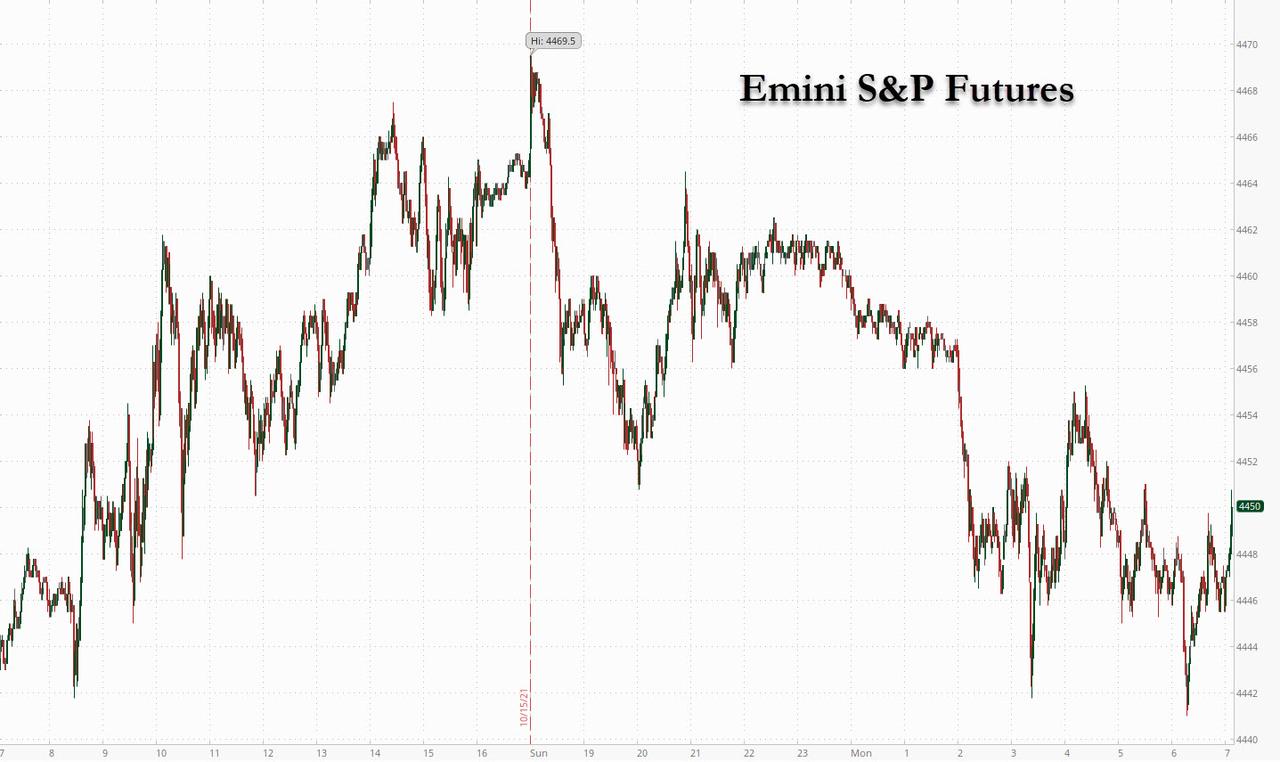
SPX hit its lesser targer at 4475.00 on Friday, day 259 of the Master cycle. Friday was calendar day 43 from the all-time high. Now for the decline.
SPX futures made a low of 4450.10 this morning before a minor bounce. It renews its sell signal beneath the 50-day Moving Average at 4437.67. Today’s options expiration still appears to dominate trading. The Max Pain zone is at 4465.00 with calls dominating above and puts in charge below. The 50-day Moving Average is at 4437.67 with a second bearish cross in place.
ZeroHedge reports, “US equity futures and world shares drifted lower following poor Chinese macro data which saw the country’s GDP slide to a weaker than expected 4.9%, and as surging energy prices and inflation reinforced bets that central banks will be forced to react to rising inflation and hike rates faster than expected. Calls by China’s President Xi Jinping on Friday to make progress on a long-awaited property tax to help reduce wealth gaps also soured the mood. With WTI crude rising to a seven-year high, and Brent back over $85, investors remain concerned that living costs will be driven higher. The economic recovery also remains uneven with China’s gross domestic product slowing more than expected in the third quarter, increasing aversion to riskier assets. The dollar rose against all of its Group-of-10 peers as concerns about an acceleration in inflation damped risk appetite, while bircoin traded above $61K and just shy of an all time high ahead of the launch of the Proshares Bitcoin ETF on Tuesday.
An MSCI gauge of global stocks was down 0.1% by 0808 GMT as losses in Asia and a weak open in Europe erased part of the gains seen last week on a strong start to the earnings season. U.S. stock futures were also lower with S&P 500 e-minis last down 0.2%, while Dow and Nasdaq e-minis were both down 0.3%.

VIX futures surged to a morning high of 17.70, still beneath the 50-day Moving Average at 18.84.
Friday’s low (day 247) may be part of a “Double Master Cycle” where we see a major high and low in very close proximity, known as a “slingshot move”. Friday’s Cycle low originated 8.6 months ago as a Master Cycle high on January 29 (day 238). 8.6 market days later and nearly 50% lower, a second Master Cycle was formed on day 250. We may now anticipate a similar move, in reverse, during the next 8.6 market days. It may be an interesting trade, for those that can catch it.

TNX has just exceeded it prior Master Cycle high, creating what is known as a “running correction.” The rally may continue in corrective form over the next two weeks. Due to the strength of this rally, the new Master Cycle may end at a high at or above its November 2019 high at 19.71.
RealInvestmentAdvice considers, “Investors are slowly waking up to the realization that “stagflation” is a problem. For years, the term “stagflation” has been thrown around and dismissed like a sighting of “Bigfoot.” However, rising inflationary pressures are now colliding with slowing economic growth. This collision presents a challenge for Central Bankers and their monetary policy experiments.
Let’s start with a definition of “stagflation.”
“Stagflation is characterized by slow economic growth and relatively high unemployment—or economic stagnation—which is at the same time accompanied by rising prices (i.e. inflation). Stagflation can be alternatively defined as a period of inflation combined with a decline in the gross domestic product (GDP).” – Investopedia
As stated, many believe stagflation is impossible due to the economic theories that dominate academic and policy-making circles. The construction of the economic models ruled out the possibility that you could have slow economic growth and high inflation simultaneously.”

USD futures appear to be consilidating, although there may be a resumption of the rally. The Cycles Model shows strength starting early this week and extending through mid-November.

Gold futures made a new low at 1760.35 this morning as it ventures lower to the trigger point of the Broadening Wedge formation at 1750.00. The Cycles Model suggests that, once beneath the trigger, the decline may strengthen dramatically. However, there may be yet another bounce at the neckline of the Head and Shoulders formation.