December 22, 2021

8:20 am

Good Morning!

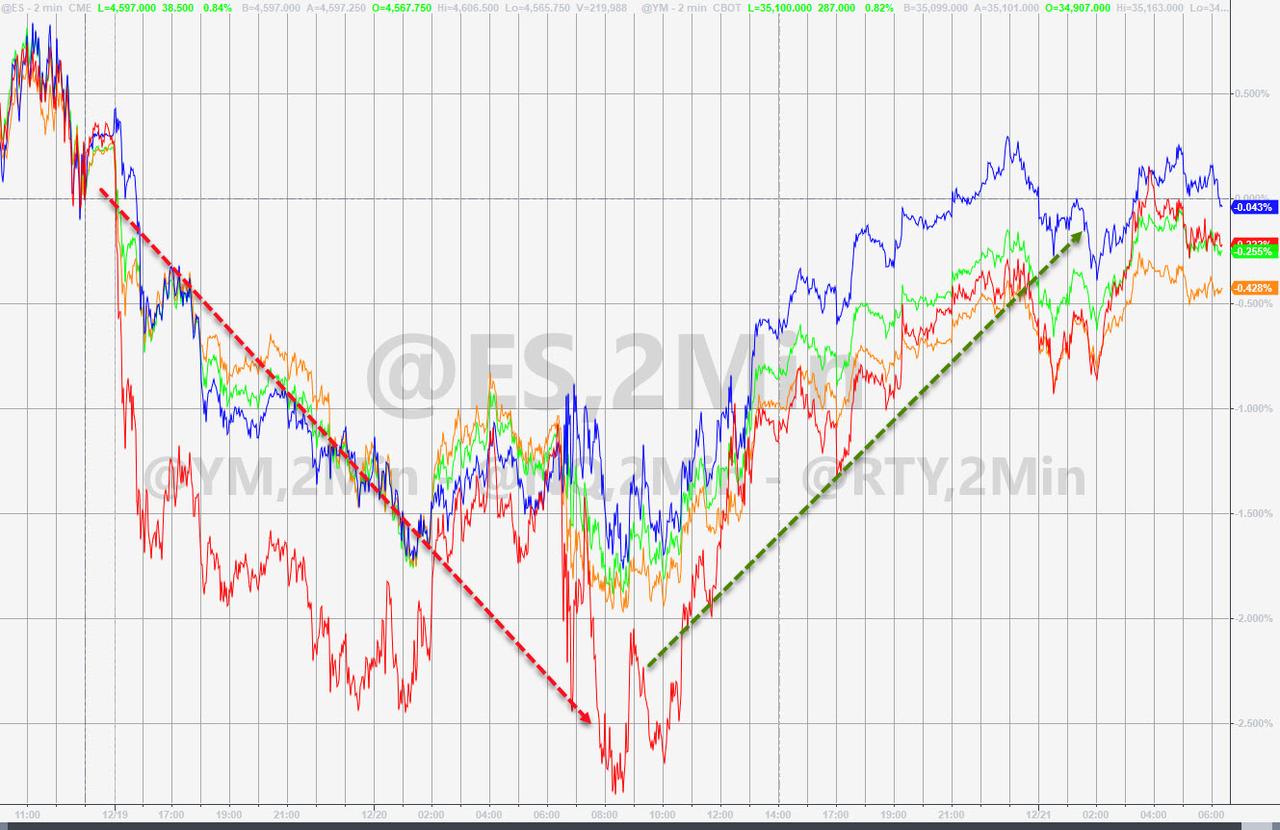
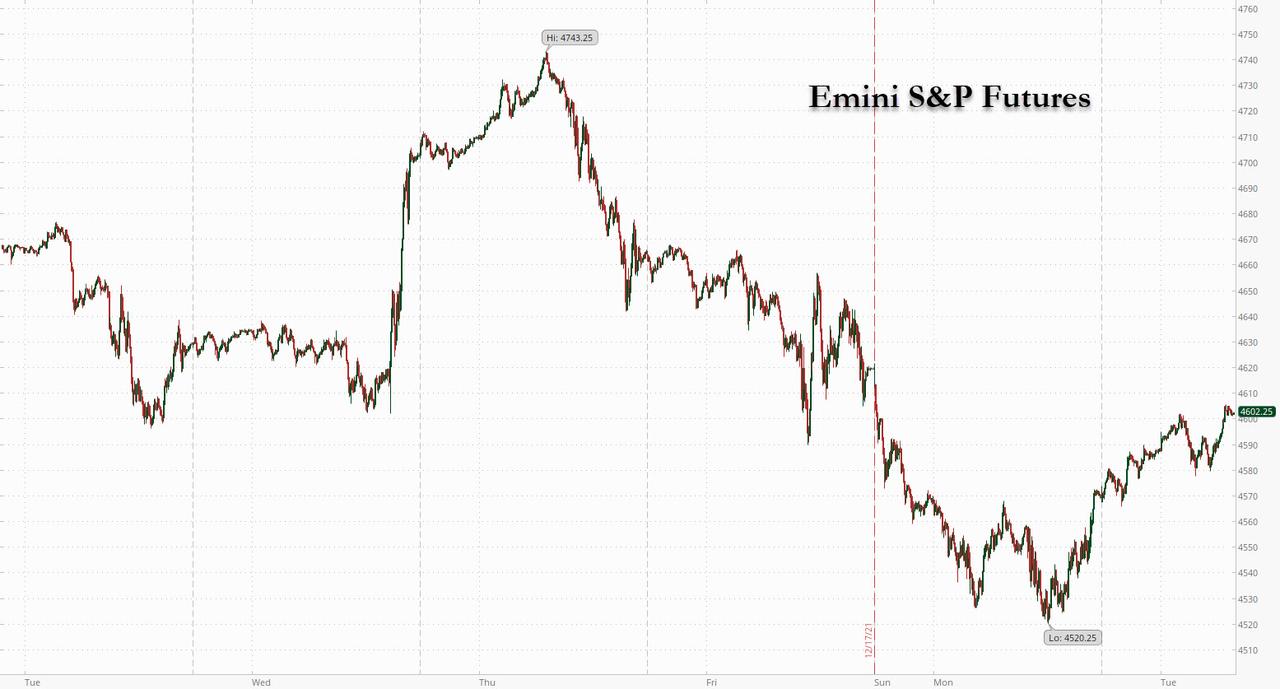
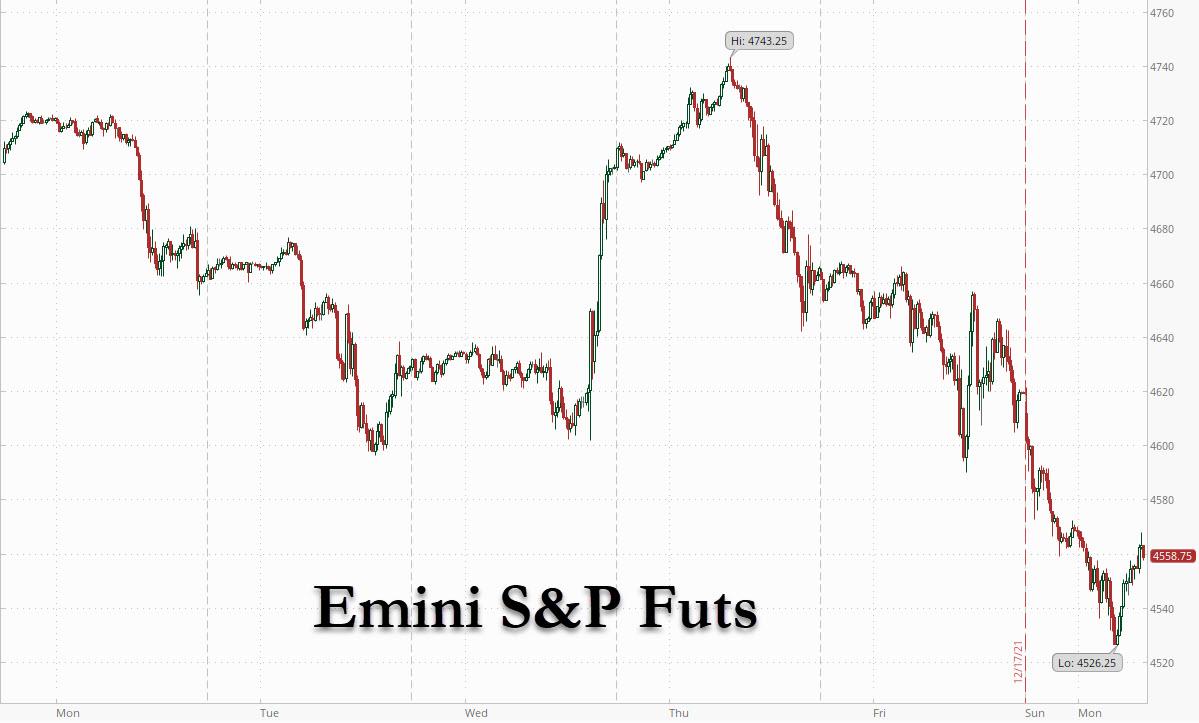
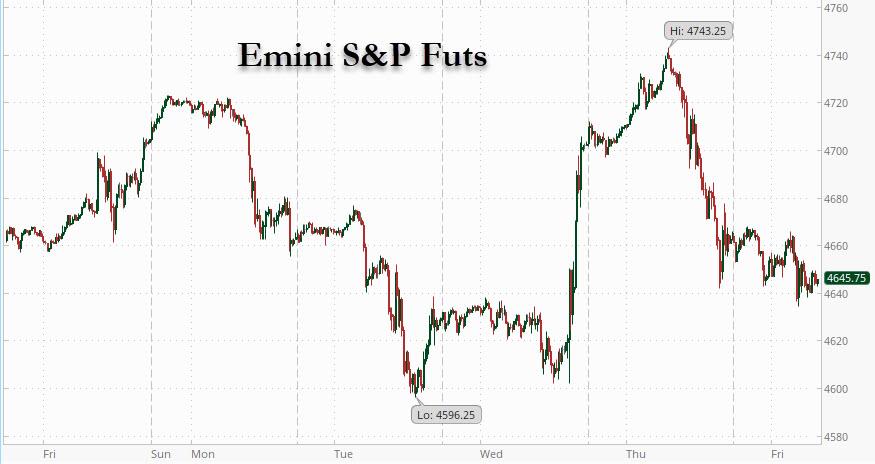
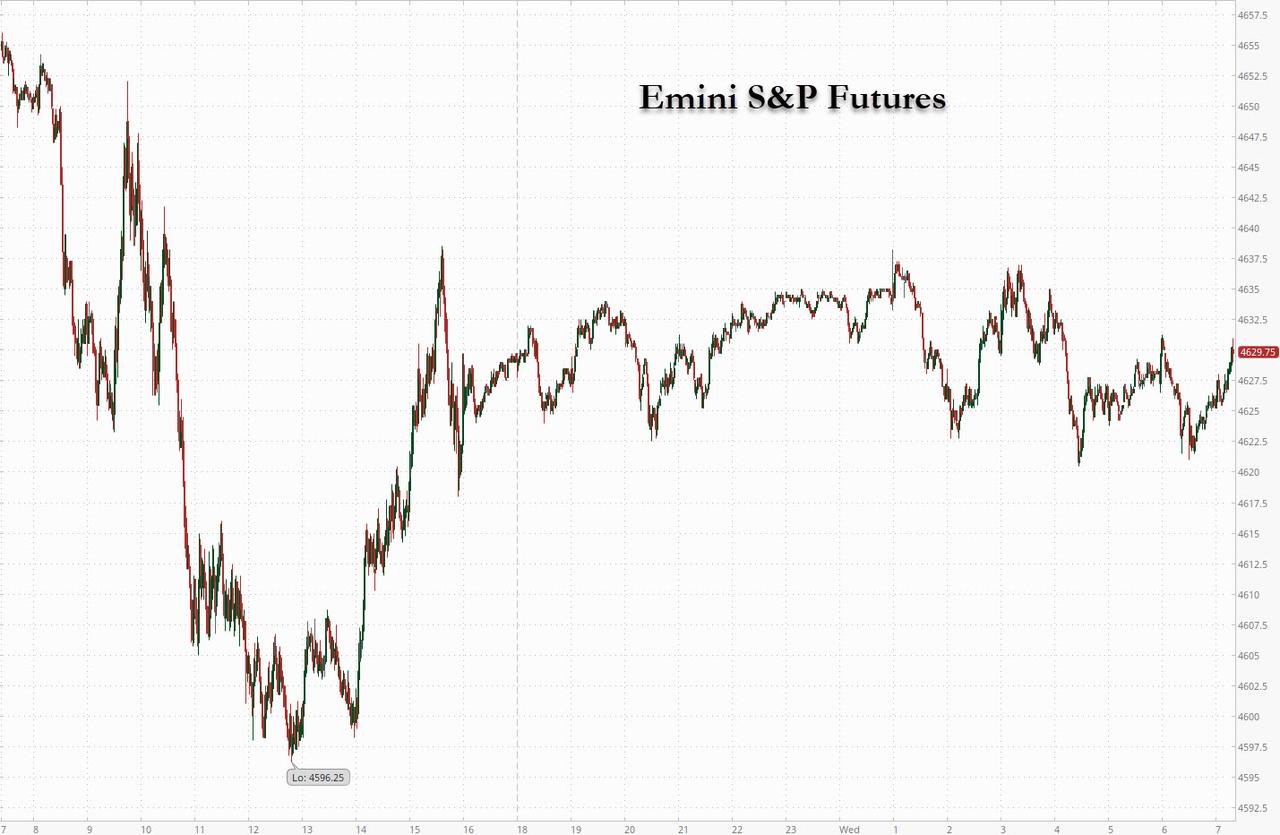
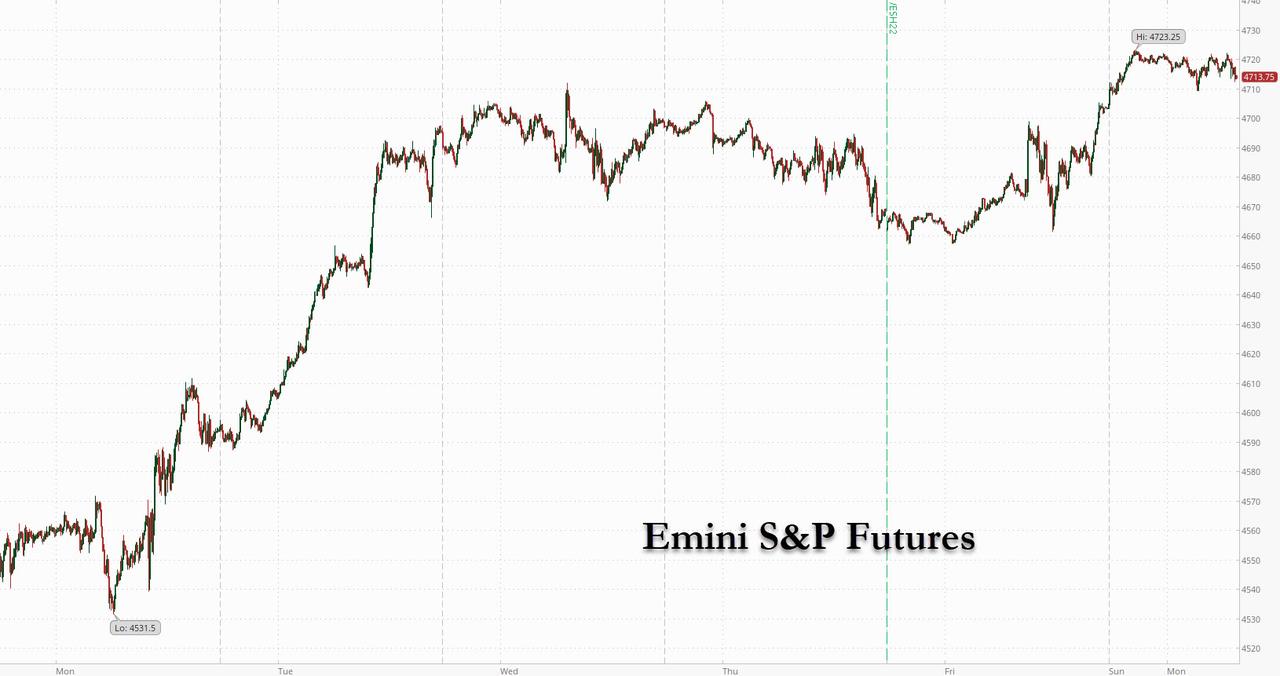
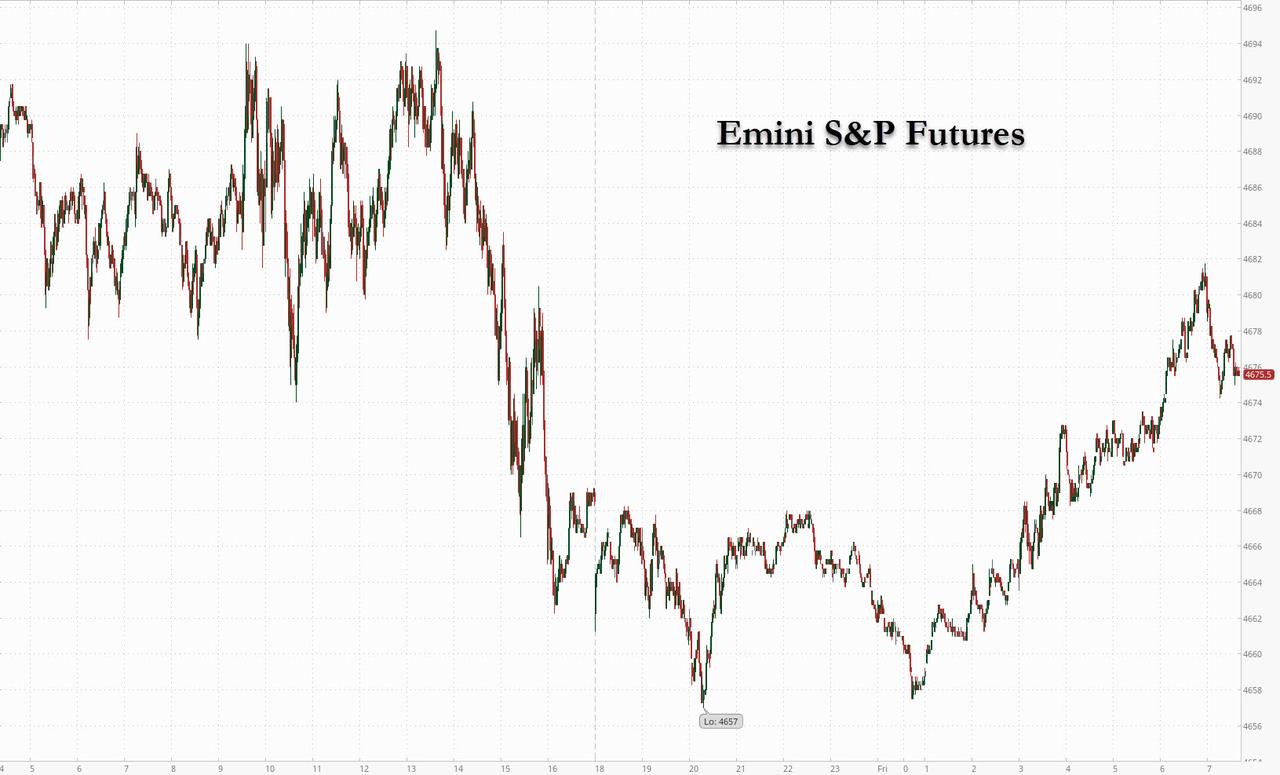
SPX futures may have completed its retracement at the 61.8% level at 4655.00 this morning.  It has been moving lower since then.  Just a note on Cycles; trending moves are very likely to follow precise Cyclical  patterns while counter-trend moves often do not.  Yesterday, after 8.6 hours of a counter-trend bounce I was ready to call it “done,” when it was not.  However, the bounce had gone far enough to be actionable.  While I do not normally measure futures in Cycles, I noticed that the turn came at the next 8.6-hour interval this morning.  Back in the cash market, the current hourly Cycle may be complete by or soon after 11;00 am.

Today’s expiring options show Max Pain at 4600.00, suggesting that SPX options gamma is currently positive.  Both 4620.00 and 4630.00 strikes have over 12,000 net open interest call contracts.

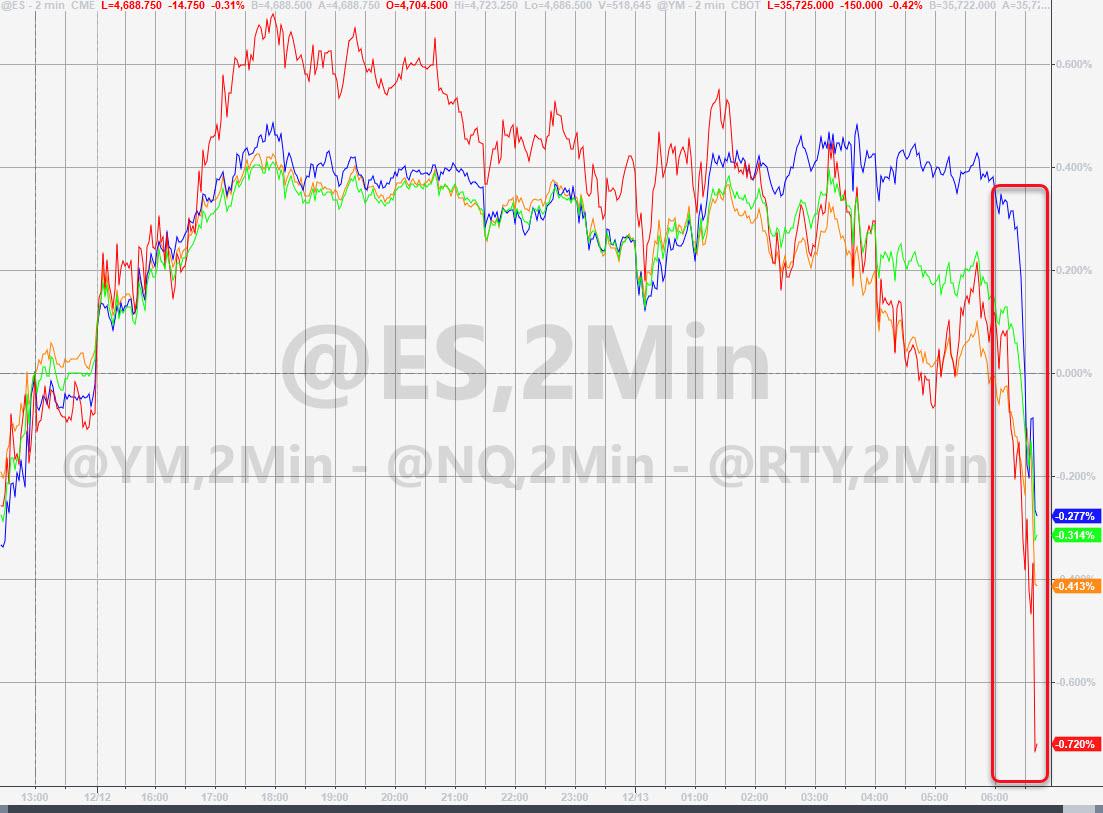
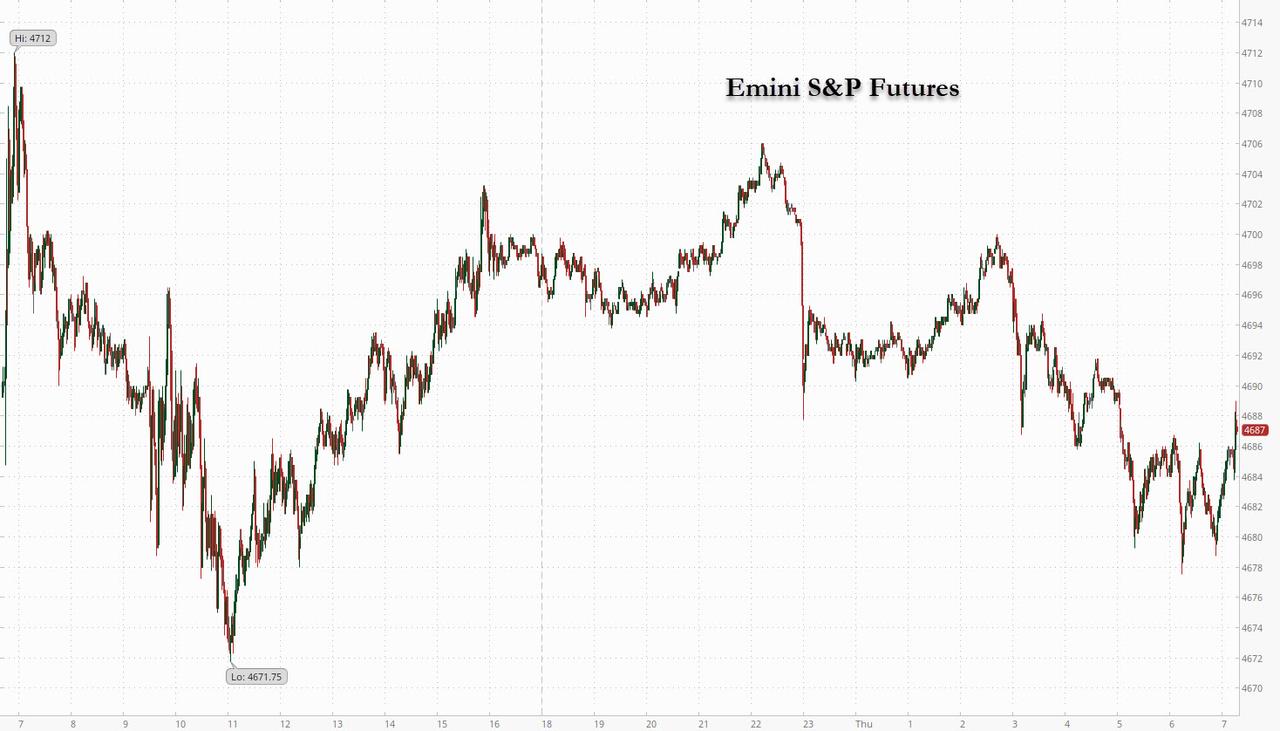
ZeroHedge reports, “Tuesday’s rally fizzled on Wednesday, as US emini futures were flat after erasing an earlier dip as attention again turned to news about the omicron variant as cases surged globally. Contracts on the Nasdaq 100 led declines, slipping 0.3% in thin trading ahead of holidays. In Europe, stocks were little changed as more omicron woes weighed on sentiment. Oil steadied as investors assessed mixed demand signals and the dollar fell. Elon Musk sold even more Tesla shares, one step close to his promise to sell 10% of his stake in the electric carmaker.”


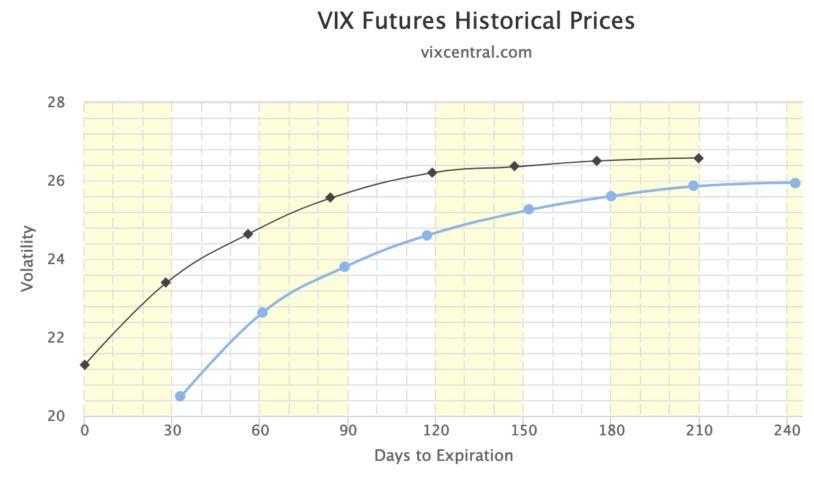
VIX futures began their advance this morning after reaching an overnight low of 20.52, completing its retracement.    Yesterday’s move has most analysts convinced that VIX is going lower, issuing in the Santa Rally in stocks.

In today’s market, the Max Pain zone in expiring VIX options is at 24.00, making that price a likely target for the close.  However, gamma turns positive immediately at 25.00 and ramps up from there.

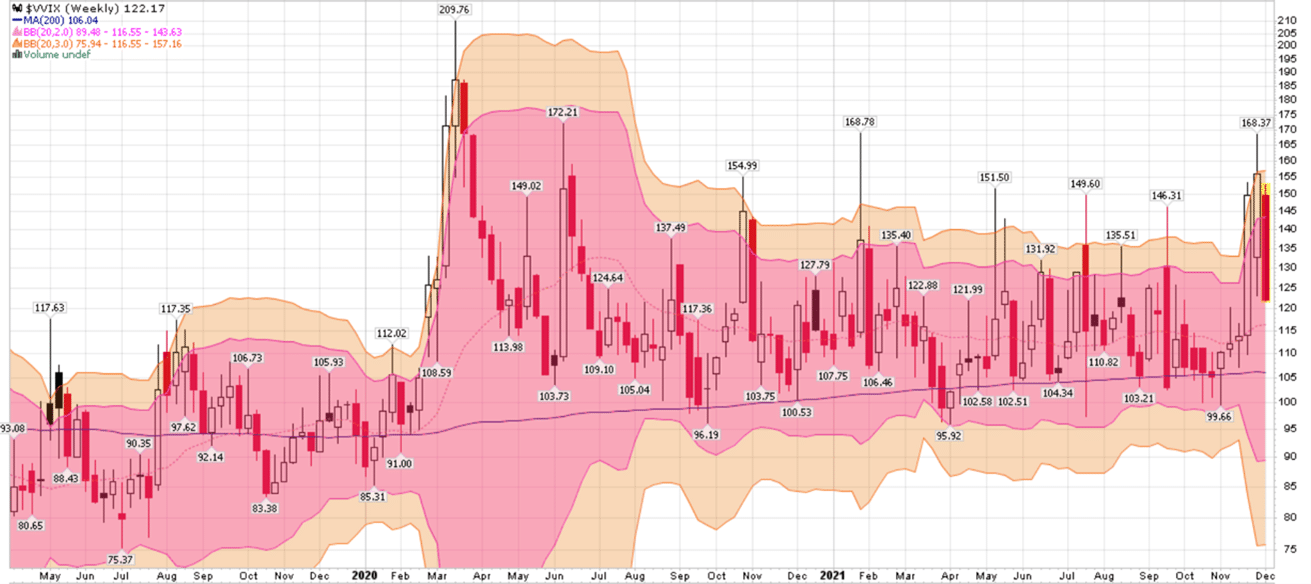
ZeroHedge comments, “How was “fear” last Christmas?

We have witnessed some rather big moves lately. Volatility is not cheap if you are trying to finance the theta, but how did the vol indexes trade last year?

V2X traded around these levels, but note VIX was actually averaging higher levels than current “elevated” levels.

Source: Refinitiv

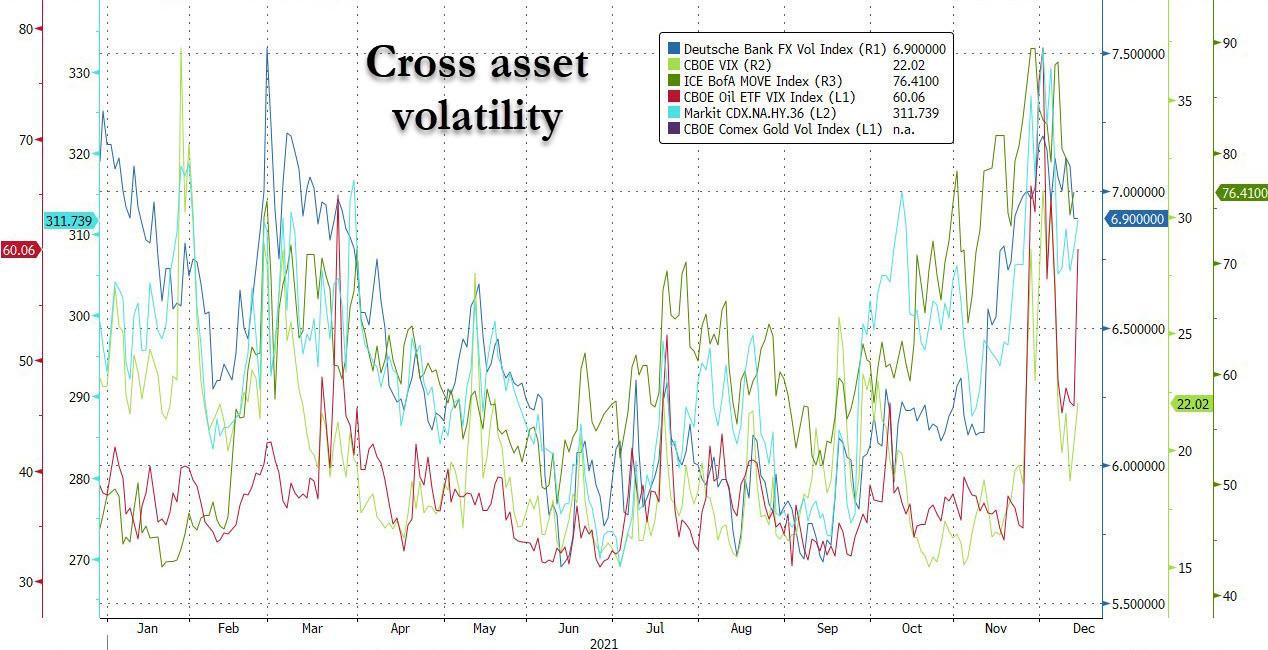
Volatility – they (must) love you

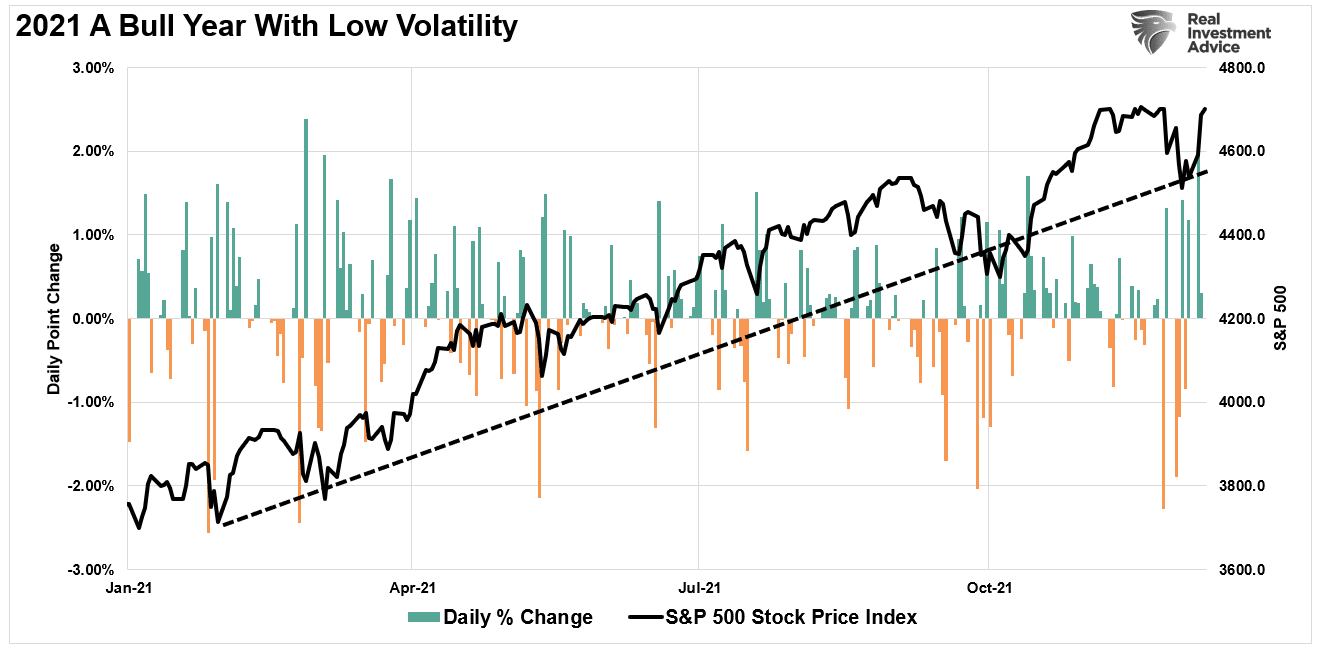
Nobody has missed the latest moves in VIX. An extreme year finishes off in an extreme way, where markets continue to move sharply from realizing low vol to high vol. 2021 full year vol is marginally higher than 2019, but “nervous” investors have pushed vols into a consistently higher vol range than pre Covid 19, writes GS.”


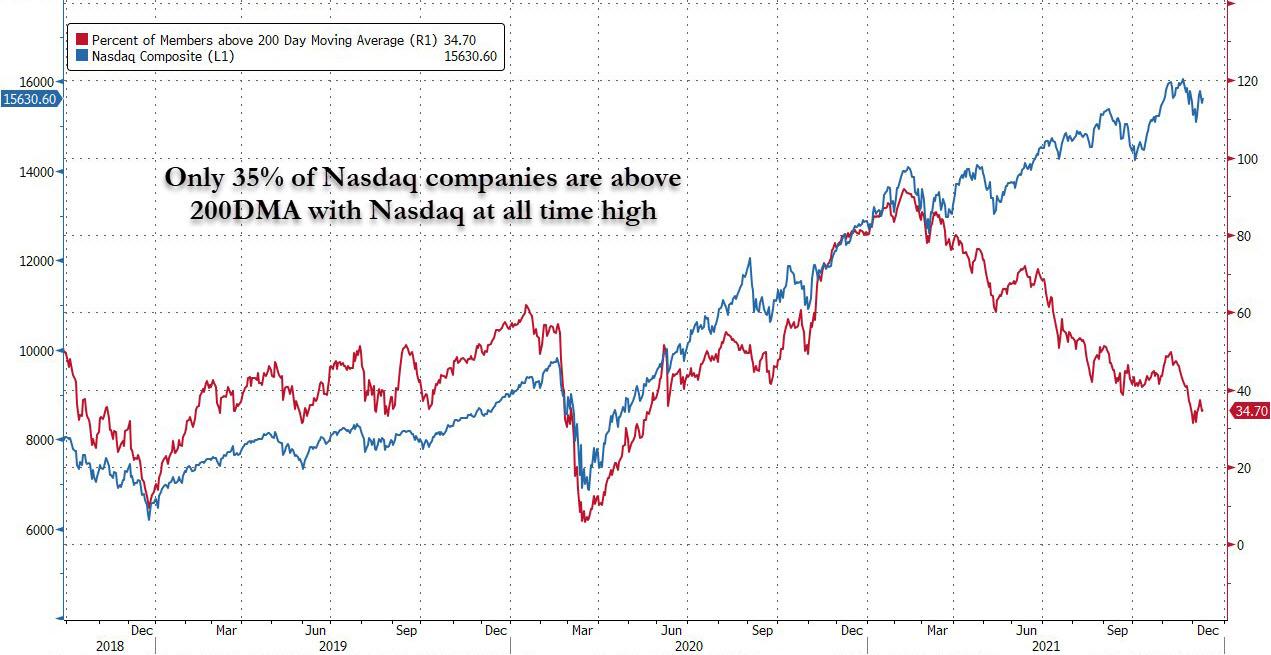
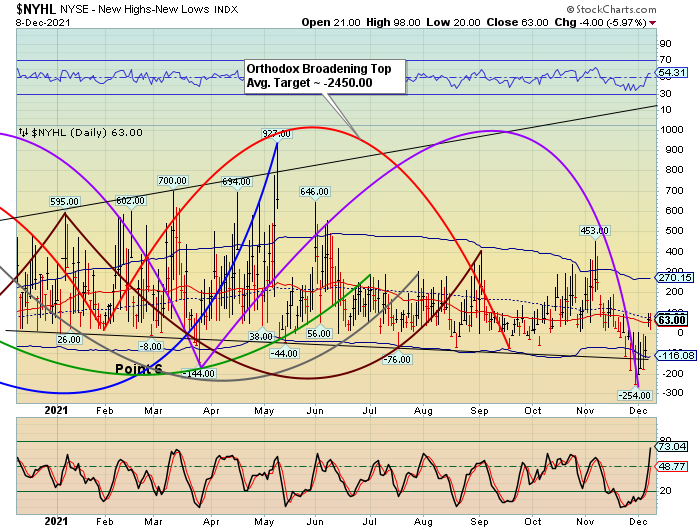
The NYSE Hi-Lo Index closed negative after reaching a neutral 24.00 yesterday, despite the seemingly strong rally in the SPX.  Short covering does not drive the Hi-Lo.  New money does.  This shows the enthusiasm for new money going into stocks is waning.


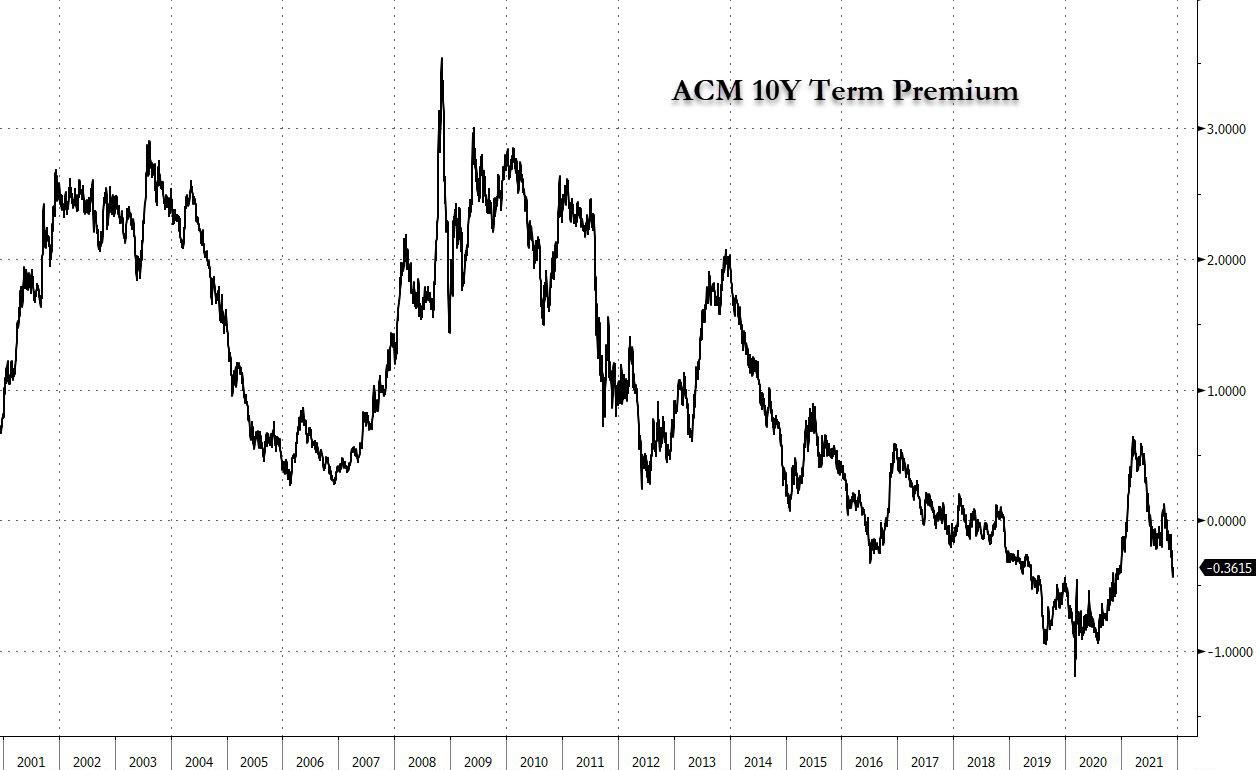
TNX is pulling back to retest the 100-day Moving Average at 14.47 this morning.  This move also suggests new money arriving on the long side in treasuries.  The three-month-old sideways consolidation in TNX may be about to change, as the Cycles Model suggests a spurt of strength beginning today, which may allow TNX to emerge above the resistance of the 50-day Moving Average at 15.34.

ZeroHedge remarks, “The size of the global government bond market surged by $10 trillion in the space of two years to reach about $50 trillion. Those outstanding borrowings are at least one gorilla in the room as investors gear up for a year in which yields are expected to climb as central banks step back and economies extend their recovery.

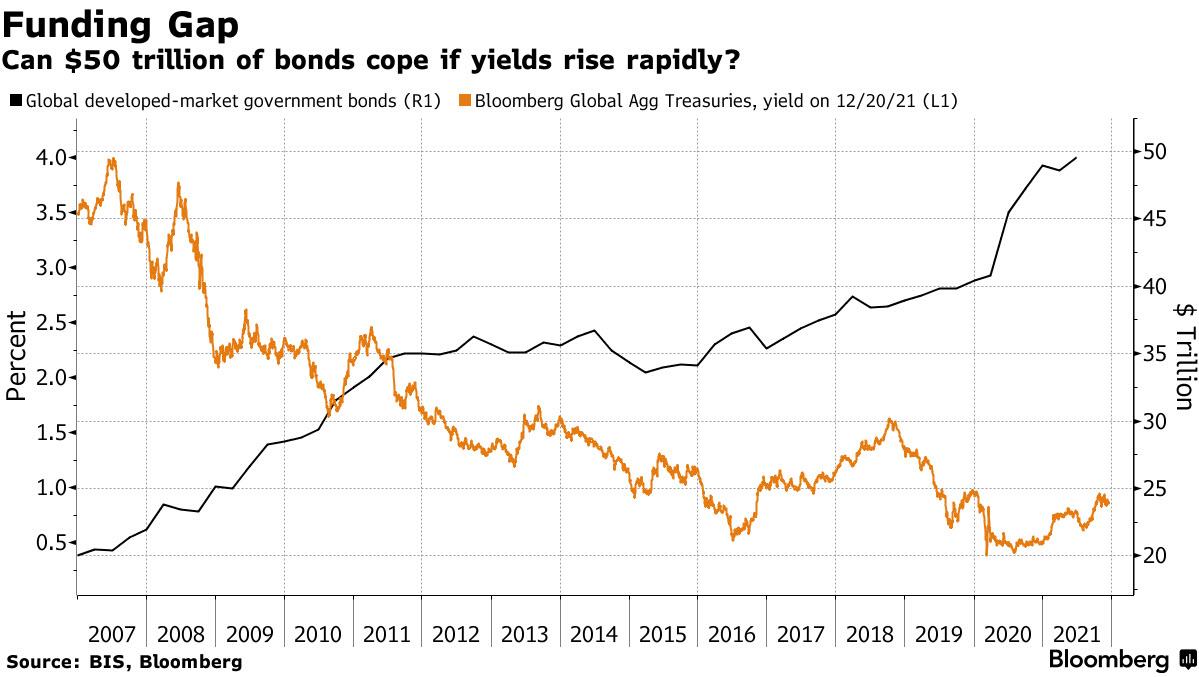
The massive bond mountain is not getting much attention, despite the explosive pace at which it grew in size and given the potential it holds to cause extreme havoc. That could be because it is simply too large to seriously contemplate, but the rapid growth in debt is one of the many Covid-era phenomena spicing up the market outlook for the coming year”


The Banking Index gapped above the Lip of the Cup with Handle formation at 128.70 in a 56% retracement of its prior decline.  Note that this formation may also be interpreted as a Head & Shoulders formation with a shorter target.  However, the extra bounce above the trendline allowed the more bearish formation.  Head & Shoulders don’t usually allow the  affected index to re-emerge above the trendline, while the Cup with Handle is more permeable.


Posted in Published | 1 Comment

December 21, 2021

2:15 pm

SPX made two 8.6-hour declines from the high at 4731.99.  Today it has complete an 8.6-hour rally from the low.  It may now be ready for another 17.2-hour decline from here, closing out the day before Christmas Eve at a new low.  Coal in the stocking, anyone?

VIX made a low f 20.90 this afternoon and is on the same (inverted) Cycle as the SPX.

ZeroHedge comments, “Tomorrow is VIX expiration, and, as SpotGamma notes, we head into that expiration with an elevated VIX structure. If you compare today’s VIX term structure to that of mid-November you can see current levels (black) remain well above Nov(blue).

Nov is “pre Omnicron” and “pre Taper” so it makes sense that current prices are elevated – but we suspect that the VIX expiration will start to drag current prices lower as traders roll.”


10:40 am

Here’s some insight into the VIX options about to expire tomorrow, December 22.  This morning VIX pulled back into its Max Pain zone at 23.00.  Gamma turns positive at 24.00 with open interest in 71,786 call contracts vs. 52,984 put contracts, which aligns with the Cycle Top resistance.  Above that VIX options are remarkably positive with a net 37,000 calls at 26.00, a net 121,500 calls at 30.00, a net 74,000 calls at 35.00 and a net 102.800 calls at 40.00.   Should VIX rally above 24.00, we may see a mighty panic-driven blast higher in the next 24 hours.

This contrasts to the analyst highlighted in the article below.  The hourly Cycles Model suggests one more (panic-driven) decline in the SPX before the holiday break.

Zerohedge comments, “As cash indices were grinding to session lows yesterday, Nomura’s Charlie McElligott points out that there was substantial closing-out of downside (selling Puts / Put Spreads to close – notables incl ARKK and KWEB, as well as a bunch in single-name) along with some buying of upside (KRE Calls and Call Spreads, XBI CS, single-name ‘stock replacement’ trades). In other words, constructive behavior, taking some protection off, others tilting to offense, and perhaps that explains the rebound overnight in futures…”


7:45 am

Good Morning!

SPX futures went higher than expected, to 4615.20 this morning, the 61.8% retracement level.  As usual, tomorrow’s options expiration has a lot to do with it.  The 4550.00 strike with 4916 open interest put contracts was an obvious level to avoid.  However, negative gamma stretches up between 4580.00 to 4605.00 with gamma flipping positive at 4620.00 (can’t go there!).  A possible level to watch is 4620..64, the top of gap left on Friday.  Inability to overcome that leel suggest this bounce is short covering and not fresh capital being put to work.  The same levels apply to the December 23 options expiration.  Friday is a full stock market holiday.

The Cycles Model suggests at least another day of decline in the current hourly Cycle, so what we are seeing is a coiling action that may propel equities much lower.  The Wave (4) low appears to be a possible target at 4278.94,a 10% decline from the November 22 peak.

ZeroHedge reports, “Perhaps catalyzed by Goldman’s persistent bullishness (see “As Markets Slide, Here Is Goldman’s Bull Case: $125 Billion In January Inflows“), or perhaps it was just a booster shot of optimism that vaccines will keep the omicron outbreak in check coupled with hope for a revival of Joe Biden’s $2 trillion economic package (see “Here Is The “Fallback Plan” Manchin Would Support… And Why Goldman Thinks It Wouldn’t Move The Needle“), or maybe the Santa rally decided to make a scheduled appearance (it usually begins on Dec 21) but on Tuesday US futures, Asian markets and European bourses all rebounded after three days of steep selling. Emini S&P futures were up 1% or 44.50 points, Nasdaq futures were up 170 points ot 1.09% and Dow futures were up 314 points or 0.9% as the recent bout of turbulent moves continues. Europe’s Estoxx50 was higher by 1.3% as the mining sector climbed 2.4%. Asia stocks closed higher bolstered by a rebound in Japan (+2.1%) and a rally in Chinese property developers. 10Y yields rose above 1.45%, the dollar was flat and cryptos jumped, with bitcoin trading close to $50,000 again and ether above $4000.”


VIX futures made a low of 21.64 this morning.  It also is showing coiling action with a Master Cycle peak (Wave 3?) anticipated on or near December 28.  That outlook may change should VIX decline beneath 20.49.


The NYSE Hi-Lo Index showed serious erosion yesterday, suggesting any bounce today may be short-lived, despite its strength.


NDX futures rose to an overnight high of 15831.90, then receded back beneath 15800.00.  The 50-day Moving Average is the key resistance here.  The next level of support is the Ending Diagonal trendline at 15250.00.  The hourly/daily Cycle may find support at Wave (4) at 14384.93 by the end of the year.


Yesterday’s close of the NDX Hi-Lo Index tells us that the overnight action is short covering and not due to any serious addition of capital.  It also remains on a sell signal.


The Banking Index broke through its trendline and its 200-day Moving Average at 128.87 yesterday, giving us a very serious selling confirmation.  The Cycles Model suggests two more weeks of selling in what may be an Intermediate Wave (3) decline.  This decline may  be a vicious one, since the current Cycle appears to end in early January with quadruple strength on the downside.

ZeroHedge relates, “The economist consensus is optimistic about economic growth in 2022.

Financial conditions will remain broadly accommodative despite monetary policy tightening. With a faster vaccine rollout and new Covid antibody cocktails, the pandemic will be under control, at least in the developed world. The direct inflationary effect of bottlenecks will progressively vanish. On the production side, supply will increase and will reduce the risk of shortage.

But what if the consensus is wrong?

Our proprietary leading indicator for growth, the global credit impulse, flashes a warning to major economies. It tracks the flow of new credit issued by the private sector as a percentage of GDP. In our sample, we have the eighteenth largest economies which represent 69.4 % of global GDP share. The global credit impulse is now in contraction territory, running at minus 1.3 % of global growth, according to our preliminary estimates.”


TNX vaulted above the 100-day Moving Average to test the mid-Cycle resistance at 14.75.  There may be enough trending strength to break out above its Cycle Top in the next week.   The new Master Cycle may stretch to mid-February with particular strength in the third week of January.

ZeroHedge remarks, “If you did any Fed watching this week, you probably heard all about how Jay Powell has turned (or perhaps returned) to hawkishness, and how the Federal Open Market Committee is all about fighting price inflation now.

A particularly cartoonish version of this claim was written by Rex Nutting at MarketWatch, who declared, “Everyone’s a hawk now. There are no doves at the Fed anymore.” He wrapped up with “This means that inflation no longer gets the benefit of the doubt. It’s been proven guilty, and even the doves will prosecute the war until victory is won. For the inflation doves at the Fed, Nov. 10, 2021, was bit of [sic] like Dec. 7, 1941: Time to go to war.”


USD futures pulled back after rising back above the Cycle Top resistance at 96.50.  Trending strength may return next week with a clear breakout above previous highs.  The current Master Cycle is due to pivot in the second week of January, leaving time for a 61.8% retracement of the 2020 decline at 98.30.


Posted in Published | Comments Off on December 21, 2021

December 20, 2021

1:45 pm

SPX made two 8.6-hour declining impulses.  It is now in a brief correction that may top out at the trendline near 4570.00.  The next decline may be a doozy, since its may be due for a new low on Wednesday afternoon, approximately 17.2 hours from today’s low.  Wednesday is the largest expiration of VIX options, so we may see growing volatility until then.

ZeroHedge observes, “Omicron lockdown concerns? Build Back Better blown up? Taper Tantrum?

Take your pick at the narrative driving markets, but for now, all the majors have broken below key technical levels.

S&P broke below its 50DMA, Russell 2000 remains well below its 200DMA, Nasdaq broke below its 100DMA, and The Dow broke below its 100DMA…”


8:15 am

Good Morning!

SPX futures declined to a low of 4536.70 before bouncing to retest the its broken trendline and Cycle Bottom at 4565.39.  It has also crossed beneath the 50-day Moving Average a 4592.79.    While analysts are relieved that SPX stayed above the December 3 low at 4495.12, it is the break of the Ending Diagonal that is significant.  In Addition, this decline may be a Wave (3) associated with panic declines.

While the options expiration for today are light, SPX is in negative gamma territory and there is  a very large put position (4900 contracts) at 4550.00 that may set off a chain reaction, if triggered.

ZeroHedge reports, “Global stocks and US equity futures are sharply lower to start the otherwise very quiet holiday week, dragged lower by Manchin’s shock decision to kill Biden’s economic agenda (which Goldman said would cut US Q1 GDP from 3% to 2%), accelerating government measures to counter the fast-spreading omicron variant and fears over the growth outlook amid a tightening Fed. US equity futures tumbled almost 100 points from their Friday close (and more than 200 points from Thursday’s all time high before paring some losses buoyed by optimism from news that Moderna’s booster vaccine increases antibodies 37-fold against omicron. Treasury yields also pared a sharp drop as low as 1.35% and the dollar held a jump from Friday, while crude oil slid on worries that mobility curbs to tackle the strain will hurt demand. As of 730am S&P 500 futures were down down 1.1%, Nasdaq 100 -1.3%, and Dow -1.0%.”


VIX futures reached a weekend high of 27.39 before pulling back, but remaining above its Cycle Top support at 24.29.  Should it overcome the Head & Shoulder neckline, it may reach its intended target as early as Wednesday.  Head & Shoulders most often propose targets for Wave 3.


Despite its rally on Thursday with a neutral close, Friday’s Hi-Lo range never got above -15.00.  This is a clear indication of crumbling internals within the NYSE.  The Cyclles Model suggests that the Hi-Lo may continue on a sell signal through the last week of January.


TNX futures made a weekend low of 13.53, but now appears to be on the path of increasing strength this week.  The window for new lows may be close by Wednesday, according to the Cycles Model.


Posted in Published | Comments Off on December 20, 2021

December 17, 2021

3:42 pm

BKX challenged its mid-Cycle support at 129.53 and the 200-day Moving Average at 128.84 today.  Although it may close above those supports, the die is cast for a major breakdown in liquidity.


2:02 pm

SPX is desperate to close at 4666.00 (SPY: 466.00) which is the Max Pain Zone, the 50% Fibonacci retracement and mid-Cycle resistance at 4660.00.  Today’s high at 4666.70 occurred in the ninth (8.6) hour from yesterday’s high, completing the first hourly Cycle of the decline.  The question is, will SPX be able to reach that level again at the close?  Charlie McElligot claims that the “generals” are now being taken out and shot, which makes the final outcome doubtful.  Dealers and hedge funds may have to sell/go short to cover the negative options-generated gamma should SPX close beneath 4660.00.


7:15 am

Good Morning!

I have a date with my 11-month old granddaughter at 9:00 am, so I will be out of the office until after the open.

SPX futures made an overnight low at 4643.60, then bounced toward Intermediate-term support/resistance at 4655.58.  There are nearly 36,000 of both puts and calls at 4650.00.  The trouble is, there are over 130,000 put contracts between 4650 and 4700, while there are 162,000 call contracts in the same space.  All of these expire at the open which may cause extreme volatility this morning.

ZeroHedge reports, “US futures tumbled after hitting an all time high less than 24 hour ago, as the favorable if paradoxical bounce in risk from the hawkish FOMC pivot faded from memory and as investors questioned whether global stocks are due for a rough ride on the backdrop of growing risks from inflation and the omicron virus variant. S&P 500 futures slumped about 0.5% Friday morning, while the U.S. 10-year Treasury yield fell for a second straight day to 1.394%, the lowest since Dec. 6.

Futures were dragged down by tech stocks as volatility surged amid mounting concerns about monetary tightening and the omicron coronavirus variant.

“Rates hikes do not end bull markets, but reversal of central banks’ liquidity means less speculative froth and more volatility,” said Barclays strategist Emmanuel Cau. “Policy angst may be here to stay, but following months of unclear guidances and conflicting signals, the direction of travel is clear now.”

Investors are also bracing for the quarterly rebalancing of the S&P 500 Index after the market close and the triple witching expiration of equity derivatives that could magnify market moves.”


VIX futures consolidated near the top of yesterday’s trading range.  There are 4.3 days between yesterday’s  pivot low and the monthly VIX options expiration next Wednesday.  It may get interesting…


After trading in triple digits yesterday, the NYSE Hi-Lo Index closed at 13.00, neutral territory.  There are more ETFs in the NYSE than there are stocks, reminiscing of the period just before the 1929 crash.  Back then they had mutual funds entirely made up of other mutual funds.  The job of separating the wheat from the chaff is done after the close.


NDX futures broke through the 50-day Moving Average at 15769.77 this morning, confirming its sell signal.  Trendline support for the 21-month rally is at 15250.00.  Los of the 50-day M.A. support is critical and may increase volatility.


The NDX Hi-Lo closed yesterday at -136.00.  This shows the NDX as the leading index in the decline.


TNX has declined to a retracement low of 13.88 thus far this morning as it completes its correction.  It is an exact 78.6% Fibonacci retracement and is due for a reversal today.  Next week begins a period of trendline strength that may last nearly to the end of February.


USD futures consolidated at the lower end of yesterday’s trading range.  Trending strength may return  in spades next week as USD breaks above resistance at 97.00 and marches higher.  The next Master Cycle Pivot appears in mid-January.


Posted in Published | 2 Comments

December 16, 2021

2:45 pm

SPX is fast approaching its mid-Cycle support at 4660.00 where a sell signal may be made.  The experience of the past two weeks can be called a shake-out, where weak players make a hasty exit as the are caught wrong-sided.  There are some very smart analysts that are now in the red.

ZeroHedge observes, “Update (1330ET): Well that de-escalated quickly… Nasdaq and Small Caps have now erased all of yesterday’s post-Powell gains…


2:00pm:  AAPL Erases Post-Powell Ramp

ZeroHedge observes, “Update (1300ET): AAPL has erased all of its post-FOMC gains…

And is dragging the rest of the market – led by Nasdaq – down with it…”


11:24 am

NDX appears to have started its decline ahead of the SPX.  It has already crossed beneath Intermediate-term support at 16170.44 to give an aggressive sell signal.  Confirmation lies at the crossing of the 50-day Moving Average at 15821.13.  While the generals appear to have played a part in the rally, the NDX Hi-Lo is stalled at 20.00.  It could easily go negative should the NDX continue its descent.

ZeroHedge explains, “Well, as STIRs spiked and the yield curve and the dollar screamed policy mistake imminent, stocks soared yesterday. It appears the hangover has finally kicked in this morning as stocks dump the gains back in a hurry…

And it is worst at the single-name level – just look at AAPL…

Crucially, Nomura’s Charlie McElligott notes that yesterday’s euphoria was almost entirely due to the Vol space and flows driven by Dealer hedging of their exposures.”


11:00 am

The Cycles Model does not call for a new all-time high here.  I have said that a number of times already.  This is one of the strangest formations that I have seen.  The reason is that there are multiple possibilities for interpretation.  This one agrees with the Cycles Model.  Elliott Wave rules also suggest that Wave two may rise to, but not exceed the beginning of Wave one.  While the VIX and Hi-Lo have both given up their signals this morning, that would not be unusual for this pattern.  I have no other explanation that fits all of my Models.  This morning’s high hit an hourly Cycle pivot, but we may see another possible attempt at a new high this afternoon around 2:00 pm to complete Wave [v] of C.  That may bring precision to the Cycle, giving us 8.6 days of decline and 8.6 days of rally.


9:00 am

Good Morning!

SPX futures made a new all-time high at 4752.00 this morning, changing the perceived structure of the Elliott Wave, which has been problematic for the past three weeks.  However, the new outlook resolves several issues I have had with it.  For example, the decline in Wave B was overlapping and difficult to ascertain.  This version allows that structure.  The Wave Structure allows the SPX to rally to the top trendline of the Ending Diagonal at 5000.00, possibly higher in the next two months.  Possibly the biggest Santa Rally ever has just begun.

ZeroHedge reports, “One day before what everyone knew would be a hawkish pivot by the Fed, the mood was dour with tech names tumbling and futures hanging one for dear life. One day after, Jerome Powell confirmed he would go full Jean-Claude Trichet as the Fed would not only turbo-taper into a sharply slowing economy, ending its QE program by March but then proceed with hiking rates as many as 3 times in 2022 (more than the 2 hike consensus), with the BOE shocking markets moments ago with a surprise rate hike and even the ECB trimming its turbo QE, and futures are…. at all time highs. That’s right – eminis are higher by 140 points in 24 hours because the Fed was more hawkish than consensus expected.  At 8:00 a.m. ET, Dow e-minis were up 215 points, or 0.61%, S&P 500 e-minis were up 27.25 points, or 0.57%, and Nasdaq 100 e-minis were up 100 points, or 0.61%.”


VIX futures fell, challenging the 50-day Moving Average at 19.18 and the mid-Cycle support at 18.52, before bouncing.  It appears that the next support may be the upper trendline of the Ending Diagonal near 17.00.


The amazing thing is that the NYSE Hi-Lo made a new low yesterday.  Since the buyback programs are winding down, it must be that investors and hedge funds have agreed to continue chasing the top5 “generals.”  The rest of the market appears to be on its back.


TNX is consolidating beneath the 100-day Moving Average at 14.39.  It comes as a surprise that TNX doesn’t know what to do with the Fed announcement.

ZeroHedge may have the answer, ” After the U.S. Federal Reserve’s expected hawkish pivot last night, it’s now down to the European Central Bank and the Bank of England to address surging inflation. Their decisions will have a big impact on banking stocks, which have strongly outperformed in 2021.

Banks have gained almost 30% this year, vying with technology stocks as the top sector, amid strong results and as stickier-than-expected inflation has fueled rate-hike expectations. A hawkish tilt in monetary policy heading into 2022 is what the sector needs to keep its rally going.

“Banks are the key play on potentially rising yields and on the re-steepening of the yield curve next year,” say JPMorgan strategists led by Mislav Matejka.”


USD futures made a new low at 95.81 tin the overnight session, prolonging the corrective pattern.  A possible target for this decline may by the Intermediate-term support at 95.48.


Posted in Published | 5 Comments

December 15, 2021

2:45 pm

SPX may complete the bounce at the 61.8% Fib retracement level at 4672.68.  Oddly, the Max Pain zone for today’s options expiration appears to be at 4770.00.  We may be spending the final hour of the day near that level.  We could see a turn in the final hour or possibly near the open tomorrow.  The NYSE Hi-Lo Index is currently at -91.00 and the NDX Hi-Lo is currently at -389.00.

There is another resistance provided at the bottom of yesterday’s gap down at 4660.00, which is also the 50% retracement level.  Waves C and 3 often leave unfilled gaps.   NDX has also met its gap at 15995.21.   In that case, the reversal may come in the final hour of the day.

ZeroHedge reports, ”

  • The Fed statement and economic projections saw the central bank double the pace of its asset purchase tapering to USD 30bln per month (consisting of USD 20bln Treasuries, USD 10bln MBS – this will be doubled again in January, with similar reductions likely be appropriate each month thereafter), which puts it on course to conclude asset purchases by March, from the prior landing zone of around June, although this could be adjusted if warranted.
  • Its updated projections now see three rate hikes in 2022, revising up its view from one hike pencilled in at the September FOMC (recall that September, the Committee was essentially split on the potential need for a second 2022 rate hike); longer-term, it has left its terminal rate view unchanged, however.
  • Inflation forecasts were revised up to 2.6% for headline PCE by the end of next year (prev. 2.2%), while the core measure is seen at 2.7% by end 2022 (prev. 2.3%).
  • On the labour market, the Fed sees the jobless rate return to the 3.5% mark next year (prev. saw 3.8%), where it is likely to stay over its forecast horizon.

The bottom line is that this was largely in line with what the market was expecting (accelerating taper, raising inflation forecasts, seeing continual progress in the labour market), where the Fed sees the economy continuing to grow (its growth view for next year was revised up, although 2023’s pace was revised down a touch).”


8:30 am

Good Morning!

SPX futures were flat this morning, remaining between 4630.00 and 4646.50, as suggested yesterday afternoon.  Should SPX go higher, the next hourly turn interval is near 1:00 pm.  Go figure.

Today’s expiring options are light, but negative beneath 4670.00.  Friday’s options are massive, with the entire span between 4600.00 and 4700.00 loaded nearly equally with both puts and calls.  I have never seen anything like this.  Sentiment appears to be turning bearish, but the bulls still have not given up.   As previously mentioned, sentiment may “flip” as SPX ventures beneath the 50-day Moving Average at 4576.55.

Zerohedge reports, “With the long-awaited Fed day finally here and Powell set to reveal the “turbo-taper” which doubles the pace of QE unwind to $30BN per month starting in January and ending by March, and to publish updated summary of economic projections, so the Fed can hike in April or May as Goldman laid out over the weekend

… S&P futures were flat, Nasdaq futures dropped as traders braced for another dose of hawkishness on the pace of the withdrawal of stimulus measures and rate increases. Treasury yields and the dollar were little changed. Europe’s Stoxx 600 Index gained after five days of losses, Asian stocks were mixed with Nikkei closing slightly higher, the Hang Seng tumbled by as much as 2.2%, with Semiconductor Manufacturing among the biggest contributors to its decline, as the U.S. is said to be considering tougher sanctions on China’s biggest chipmaker.”


VIX futures are also flat, as it consolidates inside yesterday’s trading range.  It’s not clear on the daily chart, but VIX is coiling for its next move higher.


The NYSE Hi-Lo Index fell dramatically yesterday, closing beneath the Cycle Bottom support.  While the SPX seems not to be eager for the decline, the internals are falling apart.  Do I hear the word “implosion” being used yet?

The NDX Hi-Lo Index closed yesterday at -444.00.


TNX is rising off the 100-day Moving Average this morning as it ventures into a period of strength that suggests a possible breakout by mid week.  A Cup with Handle formation may target 23.50, should the prior high be demolished.


USD futures are still consolidating in range.   However, today may be the beginning of a period of strength that may ramp higher through the end of the year.  The next Master Cycle interval occurs in the second week of January.


The Shanghai Composite Index made its Master Cycle high on Monday, crossed beneath its Cycle Top support on Tuesday  and continued making a new low today.  It is on a sell signal and sits atop a massive Cup with Handle formation with an average target of 2047.00.  Its next Master Cycle interval (low) is due in the last week of January.

ZeroHedge reports, “Chinese stocks were under pressure in the overnight session as the Biden administration proposed stricter sanctions on China’s largest chipmaker, according to Bloomberg.

The Hang Seng Tech index closed down 1% to 23,420 amid worries of further regulatory crackdowns on Chinese tech companies by the US.

The reason for the downdraft in Chinese stocks is the National Security Council will hold a meeting Thursday to tighten the rules on exports to China’s largest chipmaker, Shanghai-based Semiconductor Manufacturing International Corp (SMIC).”


West Texas Intermediate Crude is back on its sell signal, having crossed beneath its mid-Cycle support  at 70.73 yesterday.  I had previously warned on December 3 that crude oil had hit its Master Cycle low and was due for a bounce of up to two weeks.  Tis is it.  The Cycles Model suggests an acceleration of the decline starting over the weekend with the next Master Cycle low due at the end of January.  There is a possible alternate configuration suggesting a lower target beneath 40.00.  Good luck!


Posted in Published | 2 Comments

December 14, 2021


3:50 pm

NDX has reversed at the 33% retracement level.  The decline may resume at this point.

ZeroHedge observes, “A few days ago, with the Nasdaq at all time highs, we showed a striking chart: barely 40% of the Nasdaq’s 3,000+ stocks were trading above their 200 day moving average.

While not nearly as dramatic, a chart comparing the broader S&P and the median stock (via the Value Line Geometric) showed a similar theme: barely a handful of stocks were propelling the entire market higher, and it’s also why two weeks ago we summarized the current state of affairs “They better not start selling the generals”

3:45 pm

SPX retraced to the 38.2% Fib retracement at 4647.41.  It has reversed down from there.


2:32 pm

NDX has fallen to its 50-day Moving Average at 15724.62.  There has been a bounce, but the impulsive decline may not be complete and may resume shortly.  In doing so, it may break through the 50-day and the 2-hour Cycle Bottom at 15632.27, giving NDX additional room to decline.

ZeroHedge observes, “It’s not the economy; it’s the positioning, stupid.

That’s the clear message from Goldman Sachs and SpotGamma as traders ready themselves for a tumultuous week navigating the implicit volatility of tomorrow’s Fed statement, dot-plot, and press conference as turbo-taper-talk is expected, ahead of a very significant options expiration on Friday.

$4.3tln notional of equity options (referencing over 8% of the Russell 3000’s market cap) are expiring (including $2.3tln of SPX quarterly options, $360bln of options on SPX E-mini futures, $255bln of SPY options, and $670bln of single stock options).

This has historically been the most active week of the option trading year.

The Dec-2021 OpEx has less total open interest than last December’s expiration did, but more of its open interest is near the money than last year’s was. While this is the smallest December expiration in at least a decade, but larger than just about all non-December expirations.”


2:10 pm

SPX may have completed an impulsive decline ending at noon.  It may now be in a correction with resistance at 4633.00 to 4655.00.  The next hourly interval is at 3:00 pm, suggesting that, should the bounce stop at or under the resistance zone, it may resume its decline in the final hour.  There is a lot of talk of the Christmas rally beginning.  However, the decline is not over yet and the 50-day and trendline await.  The  NYSE Hi-Lo is at -41.00 and the NDX Hi-Lo is at -260.00.  Caution is warranted.

ZeroHedge remarks, “If the infamous tantrum of 2013 was all about the bond markets, this time it may be about stocks. And Monday’s selloff in the S&P 500 and Nasdaq show that traders are getting increasingly nervous about the prospect of the Fed preparing to raise rates, perhaps sooner than earlier thought.

The Nasdaq Composite Index has had an outsized move — a needle that takes it more than 1 standard deviation in either direction based on changes in the past year — on as many as nine occasions in the past month alone. Of course, most of those bigger bands have been shaded in red, perhaps suggesting that traders see the writing on the wall.”


7:50 am

Good Morning!

SPX futures made a low of 4650.40, challenging the mid-Cycle support at 4653.00.  Crossing this level confirms the minor trendline break and sell signal.  The chart shows a minor bear crossing, where Short-term support/resistance has crossed beneath the mid-Cycle line.  The December 15 options expiration shows Max Pain at 4700.00 with bearish gamma beginning at 4680.00.  Yesterday’s Key Reversal did not occur on a Master Cycle interval, but is important in establishing the declining trend ahead.  Once mid-Cycle support is broken, the next very important support is the 50-day at 4551.98, right alongside the 20-month trendline.  Beneath this the decline may be universally recognized.

ZeroHedge reports, “US stock futures fell on Tuesday, reversing an earlier gain, as traders prepared for this year’s barrage of final central bank meetings this week. Treasury yields advanced and the dollar slipped. European stocks were little changed while Asian stocks dropped led by Japan whose Prime Minister Fumio Kishida hinted the government may consider guidelines for share buybacks (a tapering of stock buybacks in the US would lead to an instant market crash). At 745am, S&P futures were down 0.17% or 8 points to 4,651; Nasdaq futures were down 0.5% erasing earlier gains of as much as 0.3% as traders assessed the impact of a less accomodative monetary setting amid coronavirus challenges and high valuations.”


VIX futures made a new overnight high at 21.55 as it begins regaining altitude.  The Cycles Model shows the next Master Cycle interval in two weeks.  This is likely to be the top of Wave 3, at or above the Head & Shoulders target, discussed yesterday.  That interval does not show in the Hi-Lo Index or the SPX Cycles Model, primarily due to the fact that the end of December would only be a Minor Wave 1 in the SPX.  The Wave 3 low, which occurs in the 4th week of January does register in the Cycles Model, however.


The NYSE Hi-Lo Index closed at -31.00 after struggling to remain positive during the morning hours.  It is on a sell signal and may remain so through the end of January.  The NDX Hi-Lo Index closed at -267.00, indicating the decline is gaining intensity.


NDX futures declined with more intensity to 15924.30 this morning, in agreement with the stronger decline in the Hi-Lo.  Yesterday’s decline broke the two-week sideways consolidation with the next target the 50-day Moving Average at  15705.18.

RealInvestmentAdvice declares, “Wipe Out” is an appropriate description of what is happening beneath the calm surface of the bull market.

As we head into the end of the year, many are hoping for “Santa to visit Broad and Wall.” However, those hopes are not just about adding to this year’s already excessive annual gains. Instead, for many, it’s the hope to recover some brutal losses.

If you haven’t been paying much attention, the market is currently sitting near all-time highs. While it has risen nearly 26% this year, there were a couple of very normal 5% corrections along the way.

Wipe Out, “Wipe Out” Below The Calm Surface Of The Bull Market

By looking at the chart, you would assume that performance across the index was pretty equal. However, that would be an erroneous assumption.

As the old saying goes:

“You can’t judge a book by its cover.”


TNX declined beneath its 100-day Moving Average at 14.29 this morning, primarily due to liquidity migrating from equities to Treasuries.

ZeroHedge observes, “After CPI’s rise last week (which was somehow briefly seen as ‘good’ news because it was lower than a wild whisper number), Producer Prices tore up the narrative this morning printing a record breaking 9.6% YoY rise (smashing expectations of +9.2% and well above the +8.6% YoY print for October)….

Source: Bloomberg

Worse still, core PPI surged:

  • Ex-food and energy +7.7% YoY vs +7.2% exp and +6.8% prior
  • Ex-food, energy, and trade +6.9% YoY vs +6.3% prior

Both Goods and Services prices rose with Energy and Transportation costs the biggest drivers.”


USD futures are challenging the Cycle Top support at 96.20.  This corrective action may continue through the end of the week.  However, the uptrend may resume next week, with strength.


Posted in Published | Comments Off on December 14, 2021

December 13, 2021

1:48 pm

NDX is challenging mid-Cycle support at 16132.39, potentially confirming its sell signal a second time this month.  Last Monday’s 5.6% rally deflated the shorts, but this time the decline may be much more convincing.  The NDX Hi-Lo Index is at -171.00.

ZeroHedge observes, “Is the reality of a tightening Fed really starting to sink in?

The market has priced a full rate-hike in for June 2022 (which means the taper is expected to accelerate from the current pace)…

‘Bubble’ markets are tanking…


11:09 am

BKX, our liquidity proxy, is testing its mid-Cycle support at 129.24 this morning.  A breakdown here would add fuel to the flames of the sinking equities market.  It reversed from its Cycle Top resistance on November 20 and declined under its 50-day Moving Averae on November 25.  It has gone sideways for nearly three weeks, so there is only a minimal interest in shorts the banking index.  Inflation is no friend of the banks.

ZeroHedge remarks, “According to The New York Fed’s latest survey, the public’s short-term expectations for inflation surged to 6% – a new record high.

Interestingly, longer-run expectations for inflation eased a bit in November (for the first time since June).”


10:50 am

VIX did not linger near Friday’s low this morning.  In fact, VIX is back on the buy signal with a monstrous Wave 3 of (C) of [3] underway.  That combination of third Waves (C is considered a third Wave, as well), may double the Wave 3 of (C) of [1].  Remember, Wave three is never the smallest Wave and often a multiple of Wave one.  Since its predecessor Wave 3 was over 40 points, this Wave 3 may be as much as 80 points.  It may make a target of 100.00 a possibility by the end of December.

RealInvestmentAdvice observes, “Multiple waves of uncertainty have swept over Wall Street in the past month: concerns about rising wages and inflation, Federal Reserve turning more hawkish, and the Omicron variant becoming widespread.  These increasing waves of uncertainty drive rising implied volatility (VIX).  The following chart shows the 200-week moving average of VVIX (Volatility of VIX) has slowly moved upward since the March 2020 correction.

liquidity crunch, A Liquidity Crunch & Volatility Surge is Coming in 2022

Source: Patrick Hill – 12/7/21

Note how the Bollinger Bands (pink and tan) for 2 and 3 standard deviations have dramatically expanded in the last few weeks.  We expect with all the uncertainty heading into 2022 that high volatility will be the new normal for markets.


10:45 am

SPX broke through the Ending Diagonal trendline at 4685.00.  Last week it was estimated at 4665.00 to 4675.00.  The inference is that SPX may now decline beneath 4500.00, where the correction began.

ZeroHedge remarks, “All of a sudden, things went just a little bit turbo since BoJo warned of a “tidal wave” of Omicron cases

As US equity cash markets open, stocks were pummelled lower…

AAPL – the market’s very foundation – was unable to get to $3 trillion in the pre-market, and is falling back to unch…”


8:45 am

Good Morning!

SPX futures are making new highs this morning, having closed above 4700.00 on Friday. SPX still appears to be dominated by the options market, although its hold may be waning.  Today’s options expiration show positive gamma above 4725.00, neutral gamma between 4675.00 and 4725.00 and  negative gamma under 4675.00.  A Fibonacci resistance lies at 4730.00.  Should that resistance be overtaken, the Cyclical resistance lies at 4750.00-4755.00.   The Cycles Model shows today as being a day of strength.  Should it not propel the SPX to a new all-time high, then the trend is down through the last week of January.  Everything appears to be hinged on today’s action.

ZeroHedge reports, “U.S. futures rose again, starting the Santa rally predicted over the weekend by Goldman, after the underlying index surged to a record on Friday with risk appetite returning ahead of this week’s barrage of central bank meetings including the Fed on Wednesday, followed by the Bank of England and ECB. Nasdaq 100 futures climbed 0.4% as major technology and internet stocks rose in premarket trading with Apple inching closer to a $3 trillion market valuation; S&P 500 futures rose 11 points or 0.2%; with Dow Jones futures also rising 0.2%.”


VIX futures bounced above the 50-day Moving Average at 19.26 in what may be up to three weeks of growing strength into the last week of the year.  Should the neckline be overcome at 35.32, we may see the VIX probe to 65.00 by the end of the year.   This formation clearly foretells that equities may be in the downtrend discussed above.


The NYSE Hi-Lo Index struggled for traction the entire day on Friday, closing below zero and on a sell signal.  This indicator tells us there is only a thin layer of mega-caps keeping the market from breaking through the ice into the abyss.  It appears that, although today’s equities may go higher, the house is being built on shifting sands.

ZeroHedge remarks, “The S&P 500 Index is the ‘most concentrated’ since 1969.

Source: Bianco

Concentration Nirvana

Did you know that 64% of 23% YTD gain in Nasdaq (3780 stocks) is attributable to 5 stocks only. Mighty Microsoft/Google/Apple/Nvidia/Tesla must not fall…


TNX may be declining toward the 100-day Moving Average at 14.34, near the 50% Fibonacci retracement level at 14.40.  The 61.8% Fibonacci retracement lies at 14.17.  This action may be indication that liquidity  may be migrating out of stocks and into Treasuries.


Posted in Published | 2 Comments

December 10, 2021

7:50 am

Good Morning!

SPX futures rose to an overnight high of 4689.60 before settling down somewhat near 485.00.  SPX may have completed its first impulsive decline from the top at the close and is now in a corrective phase.  The 61.8% Fibonacci retracement is at 4690.00, but keep in mind that a Wave two may retrace up to the entire decline of Wave one.  Those that have opted out of their short positions may consider re-shorting at or near the 61.8% level.  Of course, the “safer” option may be to wait until SPX re-crosses its support at 4665.00-4675.00.

9:00 am:  The Cycles Model suggests this morning may be the end of a 4.3 day rally off last Friday’s low.  We’ll know more in the first two hours of trading today.  Could we see a new high?

Viewing the options market, 4685.00 to 4725.00 appears to be the gamma neutral zone, while there is a plethora of open interest in puts (59,375) vs a lack of interest in calls (7358) between 4670.00 and 4685.00.  Market makers and hedge funds have a keen financial interest in keeping the SPX above 4685.00 today.  A slip here would create a self-reinforcing decline into next week and beyond.

ZeroHedge reports, “US futures rebounded on Friday from Thursday’s selloff as traders waited with bated breath for an inflation report that could strengthen the case for an aggressive policy tightening by the Federal Reserve, while Oracle Corp jumped on an upbeat third-quarter outlook. At 730 a.m. ET, Dow e-minis were up 109 points, or 0.30%, S&P 500 e-minis were up 16.25 points, or 0.35%, and Nasdaq 100 e-minis were up 53.50 points, or 0.4%. Europe’s Stoxx 600 Index pared an earlier decline, while a Bloomberg gauge of Asian airlines fell. In China, Evergrande chairman Hui Ka Yan sold just over a 2% stake in the company, in the same week the property developer was officially labeled a defaulter for the first time. The dollar, Treasury yields and oil advanced.”


VIX futures declined to an overnight low of 20.54 in what appears to be a consolidation inside yesterday’s trading range.  Wednesday’s low may be considered a half Trading Cycle low.  That trading Cycle completes at the Master Cycle interval in the last week of December.

Investing opines, “I am flabbergasted at the collapse of the fear index. In the span of just a few days, it was crushed to almost half its level, collapsing from the mid-30s back into the teens.

We see plainly that buy the dip rules the human mind. My view is that this will be recognized as an error in judgment. I hate to put so much weight on one report, but I again point to tomorrow morning’s CPI data as a potential inflection point.”


The NYSE Hi-Lo Index closed at -4.00 yesterday, giving investors a sell signal.  That, with the VIX above the 50-day Moving Average, is a reliable indicator of a pending reversal in equities.  Of course, we will watch the index today, which may open positive due to last night’s correction.  Staying beneath yesterday’s high at 30.00 may be a neutral reading, at worst.


TNX is rising above mid-Cycle support at 14.84.  Today begins a period of high trending strength in the Cycles Model.  There is a strong likelihood of a breakout above the 50-day Moving Average at 15.48.  That trend may last through the third week of February.

ZeroHedge announced, “Having surged faster than expected in 7 of the last 8 months, all eyes are on this morning’s Consumer Price Index as this is the last big release ahead of next Wednesday’s Federal Reserve decision, where Deutsche Bank economists (among many others) are expecting they’ll double the pace of tapering. Chair Powell himself reinforced those expectations in recent testimony, stopping just shy of unilaterally announcing the faster taper. Crucially, he noted this CPI print and the evolution of the virus were potential roadblocks to a faster taper next week.

And sure enough, CPI printed +6.8% YoY – right as expected and the fastest rate of increase since 1982…


USD futures declined to 96.10 this morning, testing the Cycle Top support at 96.08.  We may see the uptrend continue as resumes its rally into next week.


Posted in Published | 2 Comments

December 9, 2021

8:30 am

Good Morning!

SPX futures are in decline, approaching the aggressive sell level at 4675.00 (sound familiar?)  Confirmation may come at the Short-term and mid-Cycle supports at 4642.56.  Apparently a 3-day short-covering rally does not sho on the Cycles Model for the SPX, nor does it register on the VIX Model.  The Cycles appear to be telling us that the decline may resume.

ZeroHedge reports, ” After three days of torrid gains, US futures and European markets fell as concerns about economic risks from restrictions to control the new variant outweighed optimism about the efficacy of vaccines after a study from Japan found that the omicron variant is 4.2 times more transmissible (as largely expected) in its early stage than delta. Both S&P 500 and Nasdaq futures dropped around -0.4% as traders awaited earnings from Broadcom, Oracle and Costco after the market close and tomorrow’s key CPI print, while European equities drifted lower in quiet trade with little fresh news flow to drive price action.

Uncertainty about monetary policy could keep stocks “significantly volatile,” according to Pierre Veyret, a technical analyst at ActivTrades in London. “Investors are likely to remain cautious and keep on monitoring the macro outlook, especially today’s U.S. initial jobless claims, in order to gather more clues on what and when could be the Fed’s next move,” said Veyret.”


VIX futures rose to an overnight high of 20.81, thus far.  The Cycles Model calls for the next interval to be in the last week of December.  Should the Wave structure be correct, Minor Wave 3 may be 3-5 times the size of Wave 1!  We’ll discuss actual targets as this rally unfolds.  VIX Guy may have made the same error that I had, referring to the lower 5-month”Head & Shoulders” at 28.79.  It faked both of us out.  However, the Cycles Model pointed to Friday’s high at 35.32, since necklines usually fall at the top or bottom of Wave 1, giving us an 11-month formation, which is ignored by many technicians.

ZeroHedge remarks, “VIX guy continues nailing it

NASDAQ futs unch, SPX futs unch. What is the vol of that? As a reminder, this is what our favorite VIX (inverse) indicator told us a week ago (here):

“His main idea was to buy VIX here. Needless to say we are starting to sell volatility here. One way to play it is via put spreads in VIX. After all, volatility is mean reverting and our VIX guy has continued holding the perfect 100% inverse track record. Will he nail it again?”

Here we are with the VIX having crashed and it continues moving lower today. Dealers are in long gamma, and unless this moves asap, they will add to vol selling as well as funds getting involved in overwriting stuff post the squeeze move. Chart showing the VIX as well as the 2/8 months spread imploding.


The NYSE Hi-Lo closed between the 50-day Moving Average at 54.36 and mid-Cycle resistance at 77.03.  Monday would have given a Hi-Lo buy signal, having crossed above the Cycle Bottom at -116.00, but I had looked at the absolute below zero reading and failed to point that out.   My error.  Compounding this, neither the SPX nor the VIX Models gave a buy signal.


TNX is testing the mid-Cycle support at 14.85.  It may decline further as it is due for a minute retracement.  Should it decline beneath that level, the 100-day Moving Average at 14.30 may hold.  Today would be day 253 of the (early) Master Cycle which was registered last Friday.  I am not expecting further lows. but the window for another low has not slammed shut yet.

ZeroHedge observes, “If you asked your bank manager for a loan, the rate you will be offered will vary proportionally with not only how much you borrow, but also how long you borrow for. That, of course, is a no-brainer since the longer the bank is willing to lend to an individual, the greater the risk of something going wrong. Mainly, they encompass credit and inflation risks, and in the case of institutional investments, liquidity as well.

Yet, in the market for Treasuries and several other major developed markets, investors have recently become indifferent to the risk surrounding the longevity of their loans to governments. In other words, they are essentially saying, there is no more inflation risk in lending to Uncle Sam over, say, 10 years than there is when lending for a far shorter period. That is a massive irony against a backdrop where inflation is Le probleme du jour.


USD futures have bounce back above the Cycle Top support at 96.02.  It appears that USD may continue to ride the Cycle Top support higher with increasing strength towards the end of December.


The Shanghai Composite Index may be making an early Master Cycle high at 3688.40 today (day 245).  The Cycles have been punctuated with some dramatic moves this past year, evidence of a “managed” economy.  Plastering over the rot with more liquidity only makes the economy more unstable.  Having challenged the Cycle Top resistance, the new Master Cycle can only decline to the Cycle Bottom or lower by the end of Janusry, the next Master Cycle interval.

ZeroHedge remarks, “This is the way Evergrande ends: not with a bang but a whimper.

Three months after an initial shockwave of fear that China’s largest and most indebted property developer was set to default, roiled global markets only to see the company repeatedly kick the can on several occasions even as the final default was always just a matter of when not if (due to billions in interest payments and tens of billions in upcoming debt maturities), overnight ratings agency Fitch (with Moodys and S&P set to follow shortly) officially downgraded insolvent property developers China Evergrande Group and Kaisa Group, saying they had defaulted on offshore bonds.

The downgrades to so-called “restricted default” status came days after the companies failed to make an offshore bond interest payment, even though Evergrande and Kaisa have not officially announced defaults that will result in drawn-out debt restructuring processes and potentially nationalization.”


Posted in Published | Comments Off on December 9, 2021