September 15, 2022

11:33 am

Crude oil fell to a morning low at 84.56, resuming its decline.  This decline is due to continue through the end of October, according to the Cycles Model.  Good luck and good trading!


11:28

Gold futures just crossed beneath both Cycle Bottom support at the Lip of its Cup with Handle formation at 1680.00, reaching a morning low of  1672.25.  It may bounce in the next few days, so no trade is recommended.  However, it may be a good short at the bounce.


11:15 am

That bounce in the SPX finished quickly.  The slippery slope is here.  The Cup with Handle formation becomes activated at 3880.00.  I chose this over the Head & Shoulders formation with a target at 3650.00 due to the massive “right shoulder.”  Traders are looking for a reason for the decline.  There is none.  It’s just time for the decline and short gamma will help it along.

ZeroHedge remarks, “It’s unclear what the catalyst for this leg lower is – US macro data was mixed at best with labor signals better while manufacturing was weaker and surveys confused – but markets are puking after an early bid…

Stocks have erased all of the late-day panic-bid in stocks yesterday and more…”


7:20 am

Good Morning!

NDX futures rose to 12186.00 in the overnight session, a mere 23% retracement and short of the next overhead resistance at 12437.24.  The Cycles Model suggests that equities are on the brink of the next panic decline.  The first installment begins this weekend and may extend to mid-October.

Today’s op-ex shows Max Pain at 12225.00.  Long gamma begins at 12500.00.  Short gamma may begin at 12000.00, but is confirmed with at 11800.00 with 86 put contracts.  Today’s op-ex is light, but tomorrow the hammer falls in the options market with calls dominating above 12100.00 and puts reigning beneath 12000.00.

ZeroHedge reports, “Amid all the chaos of yesterdays post-CPI collapse, Goldman’s Prime Services group noted that “our sense is that hedge funds were relatively calm and shorting/hedging using Macro Products.”

In other words, they saw little sign of long liquidations or risk unwinds.

Overall US book was net sold for a second straight day (1-Year Z score -0.8) , driven by short sales outpacing long buys 1.7 to 1.

Yesterday’s notional short sales in US equities was the largest in 3 months.”


SPX futures peaked in the overnight market at 3958.70, a 22% retracement of Monday’s decline, then pulled back.  SPX may have completed a 17.2-day Cycle on Monday.  It may be in the middle of its first panic decline, lasting several days.  There is little chance of a significant rally, because the next hourly turn is due mid-day today.

Today’s Max Pain lies at 3945.00, very near yesterday’s close.  While long gamma is at 4000.00, short gamma begins at 3925.00 and extends beyond 3500.00.  This is a very slippery slope, which intensifies on Friday into the weekend.  The first significant low of this decline may happen on or near Sept 20.  The Current Master Cycle, however, is not due to bottom until mid-October.

ZeroHedge reports, “Extremely illiquid US equity futures (top of book depth is between $1-2MM) dropped after trading flat for much of the overnight session, ahead of a packed data slate today including retail sales, industrial production and capacity utilisation for August, the Empire State manufacturing survey and the Philadelphia Fed business outlook for September, and the weekly initial jobless claims, as Treasury and Bund yield rose after Russian energy supplier Gazprom warned that nearly full EU gas inventories can’t guarantee a safe winter with money markets raise tightening wagers, pricing as much as 193bps of ECB hikes by July versus 186bps on Wednesday (and as much as 210bps of Fed hikes by March). As of 7:15am ET, S&P 500 futures slipped 0.1% after a tumultuous few days of trading following the consumer price index reading; Nasdaq 100 futures fell 0.4%. Both underlying indexes had slumped on Tuesday after the report, nearly erasing a four-day rally, before slightly rebounding on Wednesday. European stocks were flat, while the MSCI Asia Pacific Index reversed earlier gains to trade down. The dollar resumed its rise while the yuan dropped below the critically important 7.00 level against the greenback. Ethereum completed the merge and traded around $1600 without any big moves in either direction.”


VIX futures consolidated above the mid-Cycle support at 26.24 and is now advancing.  The Cycles Model suggests the VIX may be due for a Master Cycle high on or around Sept 21.  The SPX/NDX do not end their Master Cycle there.  However, this may be the first show of strength for the VIX by breaking out above the Head & Shoulders neckline, which has been in place since January 2021, potentially ending a 20.5-month Cycle beneath the neckline and a 30.1-month Cycle from the peak in March 2020.

The next options expiration for the VIX is on September 21 and it is locked and loaded for a monster move.  Currently Max Pain is at 26.00.  Short gamma begins at 24.00 while long gamma begins at 27.00.  The significance is that long gamma stretches to 110.00, possibly even 150.00.  There are calls outstanding as high as 180.00!


THX is consolidating beneath yesterday’s Master Cycle high at 34.76.  Wednesday was the last day of strength in the Cycle and stretched it to 285 days.  Liquidity is looking for a home and bonds appear to be much less volatile than stocks.


USD futures consolidated this morning above its trendline near 109.00.  As long as USD stays above 109.00, it may continue its move higher, ending at a possible new high by the end of the month.


WTI futures are consolidating beneath Intermediate-term resistance at 90.43.  The bounce may be complete and we look for a resumption of the decline.


Gold futures are tumbling, hitting a low of 1690.00.  The Cycle bottom is at 1685.38 and the Lip of th eCup with Handle is at 1680.00.  Today is day 255 of the Master Cycle, so a bounce may be imminent.  It appears that one of the two supports mentioned may be utilized for a bounce.  Should gold break down beneath them, all bets are off.


Posted in Published | Comments Off on September 15, 2022

September 14, 2022

9:34 am

The Ag Index appears to have finally made a reversal yesterday, at day 287 of the Master Cycle, matching the 10-year Treasury at 285 days.  I don’t know what the relationship is, other than the rising cost of money has an effect on food prices.  What the Cycles Model suggests is that GKX may now decline through mid-November.  Since it has already achieved the 50% retracement value at 432.52, it is likely to target the 61.8% retracement at 387.96.  An added confirmation is straight line support at 380.54.  What we are dealing with is not supply-and-demand.  Instead we are dealing with market forces, namely lack of liquidity and possibly a transportation shutdown this weekend.

OilPrice.com observes, “Energy crises impact nearly every aspect of our lives, and that is particularly true of food markets, with food production next year expected to be severely threatened.

  • About 70 percent of the cost of fertilizer production is solely the price of natural gas, and as the price of energy soars, the cost of making and moving food is increasing alongside it.
  • At the same time, Russia’s invasion of Ukraine and threats from Putin that Russia may alter grain export routes have only added to uncertainty in food markets.

The problem with an energy crisis is that it’s actually an everything crisis. In a world where virtually every industry relies on energy in some form, runaway inflation is an inevitability. This phenomenon is not news – you’ve been experiencing it for the better part of two years now. But while global governments are using every tool in their kits to curb the rising inflation rates, there’s far less they can do about the coming food shortage. ‘


7:45 am

Good Morning!

NDX futures rallied to 12137.70 in the overnight markets, but are now approaching negative territory.  Considering the speed of the decline, NDX may open beneath the most recent low at 11928.81.  The Cycles Model calls for an acceleration to the downside into the weekend, very likely making new bear market lows.

In today’s op-ex, Max pain is at 12090.00.  Long gamma begins at 12275.00, while short gamma lies at 12010.00.  This morning’s futures have already placed NDX into short gamma with more puts every 100 points down to 11100.00.  Friday’s monthly op-ex shows short gamma beginning at 12000.00 with 2453 put contracts at that point.

ZeroHedge observes, “Heading into today’s CPI print, one of the most notable positioning technicals that helped push risk assets higher (since it isn’t buybacks which are about to enter their new blackout period starting Friday), was that CTAs went from furious sellers just two weeks ago, to aggressive buyers late last week. Well, after today’s historic rout which saw the S&P tumble over 4%, the most since June 2020, and the Nasdaq plunged more than 5%, at least there is no more doubt which was the systematics are leaning.

First, here is JPM equity derivatives strategist Bram Kaplan, who echoed Nomura’s Charlie McElligott writing that “we’re back to a material put imbalance on today’s sell-off” and estimates that “between option hedging flows and the ~$15Bn levered ETFs need to sell based on today’s moves so far”, there’s risk of continued downward momentum.  Worse, in a follow up, Kaplan  confirms that “CTAs probably are already selling on today’s move, as we crossed back through the 50d & 100dma (that were taken out on the upside on Friday) on SPX (at 4040 and 4023) and NDX (at 12619 and 12456), and the 50don RTY (at 1863)”


SPX futures also bounced, but are now testing yesterday’s low at 3921.28.  The Cycles Model allows a short bounce this morning before resuming the decline.  Theoretically the bounce may go as high as 4000.00.  However there may be a time limitation that could run out well before reaching that point.  The 50-dqy Moving Average is at 4030.00.

Today’s op-ex shows Max Pain at 3975.  Calls don’t seriously rule until above 4000.00.  Short gamma begins at 3950.00.

ZeroHedge reports, “US equity futures are trying to rebound after their biggest plunge in more than two years, when the hotter than expected CPI print wiped out 4.3% or $1.5 trillion in market value from the S&P, and are up a modest 0.2% at 730am ET, erasing most of an earlier gain of 0.6%. Nasdaq 100 futures rose 0.7% after the tech-heavy gauge tumbled 5.5% in its worst day since March 2020.  Ahead of today’s PPI print, the Bloomberg dollar index retreated after jumping the most in three months on Tuesday, while 10-year Treasurys ticked higher, hovering near a decade-peak. Oil was flat now that the traders consider $80 as a “Biden Bottom.”


VIX futures declined to 26.29 before a rebound brought it near the close.  Yesterday it made a new high at 28.15 for the month and the trend may continue after a brief pullback.  The mid-Cycle support may be tested before a resumption of the trend.  The Cycles Model suggests the VIX may reach a Master Cycle high on or near the 21st of September.  I will try to fine-tune that projection as we approach the date.

Today’s op-ex shows Max Pain at 27.00.  Short gamma may begin at 26.00, while long gamma starts at 29.00.  Should long gamma emerge, VIX may be driven as high as 37.50 (or higher) today.  Investors are buying calls extending to 60.00 with 5353 call contracts at that level for today’s close.  Next week’s (Sept 21) op-ex in the VIX is loaded with 55837 call contracts at 100.00.   Theoretically, VIX should not go above 100.  However, speculators are buying calls with strikes up to 180!

DailyFX comments, “There is no mincing words on how extreme the swoon in risk assets was this past session. The S&P 500’s -4.3 percent tumble was the largest since June 11, 2020 – with no other comparable declines before the tumult of the pandemic (February to March 2020) since August 2011. As one would expect from a sweep of risk appetite, the more targeted Nasdaq 100 suffered a more intense -5.5 percent tumble which drove the Nasdaq-to-Dow ratio (growth-to-value) sharply lower. It wasn’t just a US indices phenomenon. From European equities to emerging markets to junk bonds, there was a sympathetic plunge. And yet, correlation and intensity signals neither conviction or capitulation – though you will find true believer bears and bulls make the argument. Such intense moves historically have not generated a strong record of immediate follow through – in fact recent years could be used to infer a turn, but I would argue against such immediate contrarianism. That is particularly true of those opportunists constantly on the hunt for ‘capitulation’ to ‘pick a bottom’ on the market. While the market’s shift was sharp and severe, we are far from the measures of panic that can historically reflect a market that has flushed its hold out hopes. I would consider that extreme on the VIX to be somewhere on the order of the 50.0 handle, but we are barely above the half-way point on that stretch.”


TNX continues its rise to a new retracement high on day 285 of the current Master Cycle.  It has not overcome its June 14 high at 34.83, but may do so if it doesn’t reverse immediately.  The Cycles Model has run out of trending strength as of yesterday, so today may see the onset of the reversal today.  The Model calls for a decline to mid-November in the 10-year.

ZeroHedge reports, “In today’s shitshow of a post-CPI market session, the last thing traders needed to worry about was whether the 30Y TSY auction would be a failure. Luckily, it wasn’t, and moments ago the Treasury sold $18bn in 30Y paper (in a 29-Y 11-Month reopening of cusip TJ7), in a far stronger auction than yesterday’s lousy 3 and 10Y sales.

The high yield of 3.511%, was – as expected – the highest since April 2014, surpassing the previous Fed tightening top of 3.418% from November 2018. More importantly, the yield stopped through the 3.530% When Issued by 1.9bps, the biggest strop through since March as traders are buying at least one of today’s dips.

The bid to Cover of 2.419 was slightly above last month’s 2.310, and was generally in line with the six-auction average of 2.37%. In other words, not great, not terrible.”


USD futures challenged the trendline this morning at 108.97 as it gains its footing for a new surge higher.  Trending strength rises into the weekend and through the following week until the next Master Cycle high, due at month-end.


Crude oil futures are consolidating beneath Intermediate-term resistance at 90.69.  Prior strength on Monday has now evaporated and the decline may resume at any time.  The Cycles Model suggests weakness increasing by the weekend, suggesting new lows.  (Is someone reading my blog?)

ZeroHedge comments, “A day after we reported that the Biden administration withdrew a record amount from the US Strategic Petroleum Reserve plunging it to its lowest since 1982, Bloomberg reports that, according to people familiar with the matter, the US may begin refilling its emergency oil reserve when crude prices fall to around $80 a barrel.

The sources said that Biden administration officials are weighing the timing of such a move, with an eye toward protecting US oil-production growth and preventing crude prices from plummeting (in an effort to reassure oil producers that the administration won’t let prices collapse).

The reaction in WTI was immediate with the front-month bid (well above $80)…”


Posted in Published | Comments Off on September 14, 2022

September 13, 2022

2:45 pm

There’ may still be a bounce, but not from this level.  SPX is in serious short gamma, which may only be controlled in the overnight market.  It’s going lower for now, but we may see a bounce in the morning.

ZeroHedge comments, “Ahead of this morning’s hotter-than-expected CPI print, the world and their pet rabbit was convinced – and chasing – that ‘peak inflation’ was here, The Fed would pivot, and stonks would continue to rip higher into a utopian soft-landing.

That has all gone to hell today as every asset class shits the bed in response…

…as rate-hike expectations are smashed hawkishly higher and the odds of a subsequent recession soar.”


11:55 am

SPX may be due for a bounce that may last the balance of today’s cash market hours.  Overhead resistance is now at the 50-day Moving Average at 4031.00, so there is no trade here, other than shorting at the bounce, should you have been long or in cash  at the top.

ZeroHedge comments, “As we noted in our preview last night, so confident was Wall Street that today’s CPI print would be a miss – driven ostensibly by a plunge in energy prices – that the Y/Y whisper dropped as low as mid/sub 7%, with Goldman saying the “Headline number most likely shows some disinflation and wont impact mkt meaningfully after tape’s recent run higher, unless shockingly cool…call it sub 7%…then keep your rally caps on” and JPM piling on that “a 7-handle CPI YoY we would likely to see a strong rally tomorrow.

In retrospect, pretty much everyone was wrong, with headline CPI coming in at a “shocking”, red hot 8.3%…

… a number which 47 of 50 economists missed, and which just BMO (and two other smallish banks, SMBC Nikko and Berliner Sparkasse) predicted correctly:”


7:20 am

Good Morning!

NDX futures reached an overnight high of 12831.60, a 50% retracement of the decline from August 16.  This fulfils the retracement requirement for NDX.  Additional resistance lies at 12974.37, the Intermediate-term resistance at a 58% retracement.  The absolute resistance is the Lip of the Cup with Handle formation near 13000.00, should the markets become exuberant.  However, today is also the half-way point for the current Master Cycle in a Wave (3) of [3].

Elliott Wave Principle (EWP) points out that, “Third Waves are wonders to behold.  They are strong and broad, and the trend at this point is unmistakable…Third Waves usually generate the greatest volume and price movement and are most often the extended Wave in a series.”  (Elliott Wave Principle, Frost & Prechter, page 78).  There is more to this summary that you should read, including the description for Declining C Waves on page 81.  EWP points out, “There is virtually  no place to hide except cash.”

In today’s op-ex, Max Pain is at 12575.00.  Long gamma begins at 12600.00.  Short gamma starts at 12400.00.   QQQ (closing price: 310.74) shows Max Pain at 304.00 with long gamma beginning at 307.00.  Short gamma starts at 300.00.

This appears to be positive, almost to the extreme.  However, the market always proves the majority wrong.

9:00 am  NDX futures have fallen into short gamma beneath 12400.00 after a “Hot CPI” announcement.  This has all the earmarks of a runaway train.

ZeroHedge observes, “Ahead of tomorrow’s CPI print, Wall Street is split between those who say tomorrow’s inflation data is fully priced in and won’t have an impact on either stocks or the Fed which won’t ease until the breadth of price increases comes closer to the Fed’s 2% goal, and those who – echoing recent comments from the Fed – believe that the CPI is all that matters for the Fed’s upcoming rate decision, even though odds of a 75bps rate hike in two weeks time are just over 90%.”


SPX futures reached a morning high of 4142.40, a 58.3% retracement.  The 61.8% Fibonacci retracement is at 4155.00.  Should SPX go higher, there may be a Cycle Pivot at mid-day which marks the half-way point (in time) of the current decline.  From there, we may see 18.5 market days of decline to Wave 3 of (C).

In today’s op-ex, Max Pain is at 4085.00.  While calls are sparse, puts begin in earnest at 4075.00 and are in serious short gamma at 4050.00.

8:50 am  SPX futures dropped abruptly into short gamma beneath 4050.00 at the CPI announcement.  The Cycles Model suggests as many as 21 days of decline straight ahead.  The market is now pricing in a 100-basis points hike in rates in September.

ZeroHedge reports, “US futures extended their gains for fifth consecutive day – their longest winning streak since July – rising ahead of today’s “pivotal” CPI data.

Futures on the S&P 500 and Nasdaq 100 gained 0.7% at 7:45 a.m. in New York ahead of the data that’s due at 8:30 a.m. The underlying gauges advanced Monday for a fourth straight day amid hopes that inflation will show further signs of cooling with the headline print actually declining for the first time in two years, before the Fed’s decision on interest rates next week. Treasury yields dipped while the Bloomberg dollar index extended its recent decline, sliding 0.3% to a two week low as traders bet that US inflation is near peaking, therefore challenging the dollar-dominance narrative, in the process pushing oil and bitcoin higher.”


VIX futures pulled back to 23.53, challenging the 50-day Moving Average at 23.60.  The Cycles Model allows a potential week-long rally from here, should conditions warrant.  A possible target may be the Head & Shoulders neckline at 40.00.

8:45 am  VIX futures leaped higher at the CPI report at 8:30 am.  The Cycles Model shows growing strength over the next week.

Tomorrow’s op-ex shows Max Pain at 22.00 with diminishing shorts and long gamma beginning at 25.00.  Long gamma is strong to 40.00.

Investing.com observes, “Stocks finished the day higher yesterday, with the systematic flows continuing to dominate in an illiquid market. The depth of the book on the S&P 500 futures has vanished over the past few days, allowing this market to move much more than what we have seen in recent weeks.

CME-Liquidity-Tool-Book-Depth-Sep-12-2022

This allows systematic flows to dominate the market and push it around. The options market positioning suggests this market is overextended, and some cracks are starting to show in its stability. The VIX was higher yesterday by about 5% and closed right around 24.The S&P 500 was higher by about1%. The index managed to complete around 4,110 while hitting a high of 4,125. There are plenty of good Fibonacci levels at 4,125 that could offer resistance to the market and keep it from advancing. But at the same time today’s CPI report will play a much more significant role in what happens.


TNX rose again this morning to 34.12 in what is still a retracement move.  Today is day 278 in the current Master Cycle, an unusually long Cycle.  A slowdown in today’s CPI may have produced a strong reversal in TNX, currently happening as I write.

ZeroHedge reports, “Expectations for a 0.1% MoM drop in CPI has set the squeeze-algos on fire in recent days as the small drop signals ‘peak inflation’ and goldilocks and a unicorn-filled Fed will step back and declare victory (with a lag). Short-term interest-rates – however – have not been buying that dovish story, so how the market reacts to today’s print will be fascinating given the technical background of extreme negative delta and positioning, and now momentum. The market was pricing in a 90% chance of a 75bps hike by The Fed next week ahead of the CPI print.

Headline CPI came hotter than expected rising 0.1% MoM vs expectations of -0.1% MoM. That is the 27th straight month of rising inflation.

Source: Bloomberg

Perhaps more notably, Core CPI was dramatically hotter than expected rising 0.6% MoM (vs +0.3% exp)”


USD futures abruptly reversed at Intermediate-term support at 107.45, rising to 108.84 as I write.  This reversal was to be expected, as the USD maintains its upward trend.  The Cycles Model suggests the next peak in the USD at the end of September.


Posted in Published | Comments Off on September 13, 2022

September 12, 2022

3:21 pm

It appears that the VIX may close above the 50-day Moving Average at 23.61.  Another reason for selling the SPX.

ZeroHedge comments, “The pendulum is about to swing the other way…

As we detailed early last week, since the Aug expiry, and as we warned two weeks ago in “Now It Gets Ugly: CTAs Turn Short, Have Over $8BN To Sell This Week”, the CTA community flipped from long $25BN of US stocks to short ~$15bn of US equities, selling tens of billions in the process, resulting in one of the largest net selling sprees by CTAs in US equities over the last 5 years!”


3:15 pm

TNX is making a new retracement high in day 283 of the Master Cycle.  Tomorrow appears to be another strong day for TNX, according to the Cycles Model.  Strange times.  Traders are worried.

ZeroHedge reports, “After an ugly 3Y auction this morning, the sale of $32 billion in 10Y paper which concluded moments ago was even uglier.

Stopping at a high yield of 3.330%, the auction was not only the highest of the current tightening cycle, but also surpassed the 3.209% hit in October 2018 during the previous tightening cycle, making today’s high yield the highest since April 2011 when the yield was 3.494%. More notably, the auction stopped a whopping 57.5bps above the August yield of 2.755%, and tailed the When Issued 3.303 by 2.7bps, the biggest tail since April and one of the biggest tails on history.”


11:15 am

SPX may have reversed just above our target at 4108.00 at 4119.28 and has crossed beneath that resistance, creating an aggressive sell signal.  It did so in 17.2 days from the high at 4325.28 instead of the 18.5 days anticipated.  That leaves a probable 21.5 market days of decline to the low expected in mid-October.  Confirmation of the reversal occurs at the 50-day Moving Average in the vicinity of 4031.00.


7:30 am

Good Morning!

NDX futures have risen to 12694.40, a 43% retracement from the low, after exceeding its 50-day Moving Average at 12542.98.  The Cycles Model suggests a further rally to the 50% retracement value at 12825.00 or possibly higher, to the Intermediate-term resistance at 12862.17.  The Master Cycle which started on August 16 may reach the halfway point by mid-day on Tuesday.  Intermediate Wave (3) of Primary Wave [3] is setting up to run over the next month.  Wave threes are never the smallest and often are multiples of Wave ones.

NDX options are now trading daily.  Today’s op-ex shows Max Pain at 12620.00.  Long gamma begins at 12750.00.  Short gamma may begin at 12600.00.  There is a large holding of calls at 12530.00, so long gamma may start lower.

ZeroHedge writes, ““Illiquidity is the new leverage and flows are more important than fundamentals,” said the CIO, one of our industry’s great thinkers. “This has been our framework for considering vulnerabilities in the post-2008 world,” he said. “Following the GFC, an intended consequence of successive rounds of quantitative easing was a shift of systemic risk from banks to the asset management industry,” he explained, the Fed’s $9trln balance sheet now bloated beyond comprehension, quantitative tightening accelerating, rates rising at an unprecedented pace.”


SPX futures are fast approaching the next level of resistance at 4106.29, both Intermediate-term resistance and the 50% retracement value.  Should that target be reached this morning, there is an increasing probability of a reversal by mid-morning.  The Master Cycle half-way point (in time) is mid-day on Tuesday.

In today’s op-ex, Max Pain appears at 4045.00, while long gamma emerges at 4100.00.  Short gamma begins at 4000.00.

ZeroHedge reports, “It appears that Goldman’s trading desk was right again. Just days after the vampire squid’s sellside researchers were warning that the market has not yet bottomed, the bank’s far more accurate flow traders said that “The Pain Trade Is Now Up, The CPI Doesn’t Matter At All, And The Q4 Chase Starts Early“, and on Monday morning it was all engines go in global stock markets, with US equities poised to extend their brisk rally from last week as investors braced for the final CPI before the Federal Reserve’s September decision. Futures for the S&P 500 and Nasdaq 100 both rose 0.5% each at 715 a.m. in New York, extending above their Friday session highs, putting the underlying gauges on track for a fourth day of gains, while Europe’s Stoxx 600 index climbed for a third day, and Asia was almost all green.


VIX futures are higher this morning, but not exceeding the 50-day Moving Average at 23.70.  The initial buy signal comes at a closing price above the 50-day Moving Average.  Friday’s action may have fulfilled the downside needed at a nearly 60% retracement.  However, there may be room to move lower, possibly to 22.00.


TNX is lower, but still within its consolidation range of the last week.  The Cycles Model calls for an acceleration to the downside starting tomorrow.  The Current Master Cycle stretches to mid-November as  money moves from equities to bonds.


USD futures declined to 107.57, just above Intermediate-term support at 107.41.  The decline may continue as USD challenges support.  However, the longer-term trend is higher.


Posted in Published | Comments Off on September 12, 2022

September 9,2022

2:19 pm

SPX is consolidating at short-term resistance at 4066.66 this afternoon and may pull back to the 50-day Moving Average at 4027.60.  There may be one final surge higher on Monday to the mid-Cycle resistance at 4101.77 or the 50% Fib retracement at 4106.00.  Mid-day on Tuesday is the calendar mid-point of this Master Cycle decline.  Of course, Cycles are organic and subject to many criteria, so be on the alert.

ZeroHedge chimes in, “SPX – welcome back to the 100 day moving average

Spooz is up around 4% from Wed lows, hitting the upper part of the short term negative trend line, but the first “real” resistance is at 4100. Note the 50 crossing the 100 day right here. Imagine the pain should we trade above the negative trend line…

Source: Refinitiv

NASDAQ – short term

NASDAQ bounced in the lower part of the trend channel and is squeezing higher. Tepper lows at 12k remains the short term support. First real resistance is at 12600. It is easy to get excited about break ups/downs, but this is a market stuck in a range, so trade it accordingly. Do note the 50 day having crossed the 100 day…”


ZeroHedge observes, “With stocks slumping since mid-August, the mood on Wall Street had turned near apocalyptic again as even seemingly inexhaustible meme stock-chasing retail investors had thrown in the towel on BTFD, and started to sell every ramp. However, after trying several times and failing to break below 3,900, it was only logical that stocks would then ramp up immediately to the peak “gamma gravity” point, which as Goldman’s Brian Gartnett calculated was at ES 4,000 by the widest stretch on record: as the Goldman traded calculates, there is +100k in a single daily option line, or as Garrett puts it “Index option $ notional volumes have never been higher.”


9:10 am

While agricultural conditions worsen this summer, the Ag Index is more affected by general market liquidity than actual supply and demand.  Opportunities arise out of mismatches in the marketplace and we may be seeing one arising here.  The Cycles Model suggests a continued decline to mid-October or even mid-November in the Ag. Sector.  GKX has already reached its 505 retracement value at 439.52.  However, the correction has further to do.  The 61.8% retracement value is 387.78 and the July 2021 low is at 380.54.  These may be price targets from which we may go long, with a very high potential return next year.  In the meantime, problems are building in the Ag Sector, but opportunity lies in waiting.

ZeroHedge reports, “Drought conditions expanded and intensified over the Northeast this summer, according to the latest report from the US Drought Monitor.

Extreme drought plagues eastern Massachusetts, including Boston, and southern and eastern Rhode Island. A severe drought is more widespread, encompassing much of South Jersey up to the coastal area of Maine. Much of the Northeast is in abnormally dry conditions as of Thursday. ”


ZeroHedge also observes, “More than six months into the Russian invasion of Ukraine, the global fertilizer crunch threatens to starve a planet as prices are too high for some farmers ahead of the next planting season.

That’s the view of Maximo Torero, chief economist from the Food & Agriculture Organization (FAO) of the United Nations (UN), who told Bloomberg TV that elevated fertilizer prices could decrease global grain production by upwards of 40% in the next planting season. ”


7:15 am

Good Morning!

NDX futures rose to 12478.90, a new retracement high and confirmation of the probable extension of the rally.  The Cycles Model offered a potential reversal yesterday, but the markets ignored it, having not yet even retraced at 38.2% retracement at 12613.00.  There is more to go.  The current Master Cycle, which began on August 16, only reaches its half-way point at mid-day on Tuesday.  The 50% retracement value is at 12825.00, just under Intermediate-term resistance at 12856.63.  Both targets are viable.

In today’s op-ex, Max Pain is at 12325.00-12340.00.  Calls gain dominance at 12350.00 and long gamma kicks in at 12400.00.  Calls remain strong until 12600.00.

ZeroHedge remarks, “SPX is up 3.2% from recent lows

Back above 4k and people are still waiting for new lows…

Source: Refinitiv

Evaporating puts

As we outlined yesterday in our thematic email (), the institutional players loaded up on puts just in time for the bounce. Note they loaded up on single stock puts, and not index puts. Second chart shows that this put buying has led to “…MONSTER richening in Put Skews (wingy downside) to some “extreme” levels amongst key S&P Mega Cap Tech / Growth type names”. Index skew on the other hand remains depressed (chart 3).”


SPX futures rose to a new retracement high of 4044.70, above the 50-day Moving Average at 4025.42.  The next resistance is the Intermediate-term value at 4103.18, very near the 50% retracement value at 4106.01.  The current Master Cycle reached its half-way point at mid-day on Tuesday.  The second half of the Cycle may be intensely destructive with a high probability that the Head & Shoulders targets may be fulfilled in the next month.

In today’s op-ex, Max Pain is at 3980.00.  Short gamma begins at 3950.00.  Calls gain dominance at 3995.00 and long gamma really kicks in at 4025.00.  We are in a gamma-induced short squeeze.

ZeroHedge reports, “US equity futures, European stocks, and pretty much all risk assets rose on Friday morning as the dollar finally stumbled, dropping by the most in a month to the lowest level in Septemember, after hitting an all time high just two days earlier.

S&P 500 and Nasdaq 100 futures gained more than 0.8% at 730am ET. Europe’s Stoxx 600 Index jumped as miners rallied on optimism over Chinese demand, while banks surged following the European Central Bank’s record rate hike. That’s even as BofA said an “appalling” mood fueled a $11 billion US stock exodus in the week to Sept. 7. The yen headed for its best day in a month as Japanese officials and BOJ governor Kuroda gave the strongest hint yet at possible direct market intervention as a response to weakness in the currency. Oil and cryptos jumped.”


VIX futures reached a new low at 22.92 this morning, beneath the 50-day Moving Average at 23.81.    The Cycles Model suggests that yesterday may have seen the worst of the decline and a reversal may appear on Monday, although a decline below 22.00 is not ruled out.


TNX is continuing its consolidation beneath its Master Cycle high, The consolidation continues until Tuesday, where more directional signals start.  The Cycles Model calls for the current Master Cycle to extend through mid-November.


USD futures dropped beneath the trendline near 109.00 to a morning low of 108.35.  However, the USD appears to be quickly recovering and retesting the trendline today.  The trend appears to be generally upward through the end of the month.

ZeroHedge remarks, “After days of relentless ascent, which propelled the Bloomberg Dollar Index to record levels and the DXY to levels not seen since the start of the century, the dollar has tumbled overnight – despite reportedly very hawkish rhetoric from Jerome Powell on Thursday at the Cato Institute – sliding the most in one month to Sept lows.”


Posted in Published | Comments Off on September 9,2022

September 8, 2022

11:06 am

This morning I had given a “worst case” scenario for the SPX to retrace 61.8% of its decline from mid-August.  The Wave structure may be developing for a much quicker resolution.  Wave C may be complete at the 50-day Moving Average at 4021.00, a 30% retracement.  It may also extend to the 38.2% retracement at 4054.00.  Should it elect one of these levels, it may be accomplished at the end of the day.   Remember, this is a Primary Wave [3].  Threes are very powerful and destructive to the downside.  This “whipsaw” is meant to shake out the weak hands.  Stay strong.


8:00 am

Good Morning!

You may have already guessed that I keep alternate charts to attempt to explain the seemingly chaotic moves in the market.  This may be the most viable alternative at this time.

SPX futures remain stalled after reaching 3994.60 in the overnight market, pressing the long gamma zone.  The scenario pictured above suggests the retracement may go as high as 4106.00, the 61.8% retracement of Wave (A).  The Cycles Model suggests a probable extension of this retracement to Monday.  Hopefully sooner, but the market is out to prove everyone wrong…again.

In today’s op-ex, Max Pain is at 3975.00.  Calls dominate above 3985.00 and long gamma begins at 4000.00.  Fortunately long gamma peaks at 4100.00, thus the retracement value I noted earlier.  Short gamma begins beneath 3900.00.

ZeroHedge reports, “US stock futures traded flat, erasing modest earlier gains and losses in the overnight session as investors remained cautious while watching for signs of a softening in the Federal Reserve’s policy. Nasdaq 100 futures were little changed by 7:15 a.m. in New York after earlier gaining as much as 0.6%. S&P 500 contracts were up less than 0.1%, at 3,983.75 after hitting 3,996 overnight and following small gains in Estoxx50. The underlying index notched its biggest gain in a month on Wednesday which was sparked by yet another short squeeze, and is attempting to rebound following three straight weeks of declines that were fueled by fading bets on a Fed policy pivot and as investors braced for the impact of a potential economic contraction. Crude oil futures managed a feeble, +0.5% bounce after falling 5.7% Wednesday. The dollar reversed earlier gains helping lift the badly beaten EUR and JPY higher.”


VIX futures pressed against mid-Cycle resistance at 25.10, but remained beneath it.  Should the SPX scenario be viable, we may see VIX drop to 20.00 in the next couple of days.  Trending strength (long) may return after next week’s op-ex.

Wednesday’s op-ex shows short gamma below 25.00, but peters out at 23.00.  What is more scary to the dealers is that VIX calls dominate above 26.00 and  long gamma begins at 30.00 and extends to 60.00.


TNX futures declined to 32.01 this morning, giving more credence to the money flows, especially from the European continent.  The Cycles Model suggests rates may begin to tumble on Tuesday and intensify through the end of September.  However, this Master Cycle may not end until mid-November.  Commentators are still looking through the rear-view mirror.

ZeroHedge comments, “US nominal yields are quite the rage these days.

And the dollar is having a heyday like no other, with the yen, the euro and the pound desperately in need of some smelling salts – except that there is just no one to nurse the non-dollars back to health in quick order.

Underpinning the inexorable increase in dollar-denominated nominal yields and the chutzpah in the greenback is, of course, the surge in inflation-adjusted yields in the state-side.

In a related note, ZeroHedge observes, “And we have the answer: after lots of heming and hawing, moments ago the ECB hiked its deposit rate by 75bps from 0% to 0.75bps, the first time European rates are positive in over a decade (since July 2012) noting that “the Governing Council’s future policy rate decisions will continue to be data-dependent and follow a meeting-by-meeting approach.” The ECB itself described today’s move as a “major step” that’s frontloading the transition toward a more neutral policy stance, and said that following the raising of the deposit facility rate to above zero, “the two-tier system for the remuneration of excess reserves is no longer necessary” and “the Governing Council therefore decided today to suspend the two-tier system by setting the multiplier to zero.”


USD futures declined to 109.32, testing the upper trendline near 109.00.  Should USD decline beneath the trendline in the next few days, it may decline back to the 50-day Moving Average at 106.93 by the end of the month for the end of the current Master Cycle.  However, the USD may remain in its uptrend through the end of the year.


My concerns were realized as WTI futures plummeted beneath its prior low.   This morning it bounced to 82.90, but the course is set for a continued decline through the end of October.  Brent oil is under 90.00, suggesting the European bailout may fail to provide enough liquidity to carry out its plan.


Gold futures rose to an overnight high of 1739.35, suggesting a continued retracement higher.  The current Master Cycle has a week to go, so I wouldn’t put much emphasis on this rally.  The big test will be the Cup with Handle trendline at 1675.00.  Should that take place, gold may decline through the end of November, fulfilling the Cup with Handle target(s).


Posted in Published | Comments Off on September 8, 2022

September 7, 2022

12:16 pm

VIX has been remarkably calm, but that may be about to change.  The Cycles Model suggests a spike in volatility beginning tomorrow and extending through (and possibly beyond) monthly options expiration, possibly peaking the week after.  Keep an eye on the VIX starting today for a move to a new high.  The follow-through may be extraordinary.  Remember, the crisis is already underway in Europe, so we may look there for advance notice affecting us.  In addition, VIX dealers are aware that long gamma intensifies at 27.00, adding pressure to avoid that level.

ZeroHedge remarks, “While European stocks have sold off since the middle of August, one thing has been missing: market anxiety in the form of a spike in volatility indicators.

The Euro Stoxx 50 volatility index, also known as the V2X, remains below levels seen earlier this year, and given that bull market rallies typically follow a period of extreme stress, that may be a worrying sign for stock bulls. It’s also a pointer toward hedging opportunities as portfolio protection remains relatively cheap.

According to Bank of America analysts including Riddhi Prasad, there’s value in owning equity volatility given the “disconnect” with credit spreads that have widened to reflect the growing risk of an energy crunch, inflation and rising interest rates driving economies into recession.”


12:01 pm

SPX is approaching a 50% retracement of Friday’s decline at 3952.00.  In addition, the hourly Cycle may be set to turn as well.  Neither target is a guarantee, just an indication of the conditions involved in the Cycles.  If so, an extended panic cycle may ensue, stretching through Monday, at a minimum.


10:40 am

BKX is retesting the neckline of a small Head & Shoulders formation.  It may seem innocuous, but the outcome may be a breakdown beneath a longer-standing Head & Shoulders formation with a potential loss of over 50%.  The Current Master Cycle extends to the end of this month, but another MC that extends to mid-November appears right behind it.  We may see a reversal beneath yesterday’s new low at 102.90 in the immediate timeframe.


8:15 am

Good Morning!

NDX futures retraced 64% of yesterday’s decline after breaking through the neckline at 12013.00.  The Head & Shoulders formation may have been triggered with that and we should look for a resumption of the decline this morning.

Today’s op-ex shows short gamma begins at 12000.00, thus the close above it yesterday.  An additional short gamma cluster at 11900.00 may intensify the decline.  QQQ (closing price: 293.05) begins short gamma right at 293.00 with Max Pain at 297.00.  A stronger cluster of puts reside at 289.00 which may intensify the decline.

This morning ZeroHedge reports, “US equities and US Treasury bond prices tumbled this morning following a report by the new Fed whisperer himself – WSJ’s Nick Timiraos – suggesting The Fed’s inflation-fighting stance means 75bps is very much on the table for September’s FOMC meeting. While careful not to leak any inside scoop, the mere fact that Timiraos is reporting this story – after his CPI/75bps move earlier in the year is enough to spook traders.

Federal Reserve Chairman Jerome Powell’s public pledge to reduce inflation even if it increases unemployment appears to have put the central bank on a path to raise interest rates by 0.75 percentage point rather than 0.50 point this month.”


SPX futures dipped to 3883.80, a possible new low in the overnight market before retracing 64%.  It remains beneath the neckline of the Head & Shoulders formation at 3903.00 after triggering it yesterday.  The panic decline is most likely to start here.

Today’s op-ex shows Max Pain at 3905.00, while short gamma begins at 3900.00.  Short gamma intensifies at 3875.00 and 3850.00, while long gamma doesn’t kick in until 3970.00.  SPX is on a very short leash this morning with a lot of potential pain in a decline.

ZeroHedge reports, “S&P futures swung in illiquid overnight trading, first sliding below the key 3,900 level after the Japan open, only to recover all losses after Europe opened, with the dollar storming to new record highs and steamrolling all FX competitors as traders braced for a slew of hawkish Fed speakers to assess the path of monetary policy and its impact on the economy. S&P 500 futures edged 0.1% higher at 7:15 a.m. in New York after the underlying benchmark fell six out of the last seven sessions, while Nasdaq 100 futures rose 0.3%, as both European and Asian market slumped. The Bloomberg Dollar index hit a new record high as the Yen plunge below 144 for the first time since 1998 and the Chinese yuan flirted with the key 7.00 level. Bitcoin recovered modestly after tumbling to new 2022 lows and oil erased a decline after Russian President Vladimir Putin underlined that his country won’t supply oil and fuel if price caps on the country’s exports are introduced..”


VIX futures consolidated between 26.50 and 27.15 this morning.  The Wave/Cycle structure allows a minimum rally up to the Cycle Top resistance at 34.16, but a more likely target is the neckline at 40.00.  The Cycles Model suggests a probable Master Cycle high at or after September monthly options expiration September 14/21.

In today’s (weekly) op-ex, long gamma starts at 23.00 and intensifies at 27.00 with 4245 call contracts, explaining yesterday’s close beneath it.  VIX is also on a tight leash and long gamma is heavy all the way to 50.00.  Once gamma (runaway) trains start rolling, they may be very hard to stop.


USD futures ran up to a new high at 110.78 this morning.  US centric analysis calls for the USD to decline, while a look at the rest of the world suggests the USD is not the worst house in the slum.  The Cycles Model calls for the USD to continue rising through the end of September.  The USD may be on steroids this week as trending strength has come in a triple dose.


TNX may have begun its Master Cycle reversal after having stretched 277 days in the prior Master Cycle.  The new Master Cycle may stretch to mid-November, a 70-day Cycle with a minimum target at the mid-Cycle support at 24.02.  However, the outer limit on this Cycle may be as low as the Cycle Bottom at 13.44, with a median support at 16.71.  A safe estimate for this length of Cycle may be a 50% decline to  the Weekly mid-Cycle support at 16.71 or the long-standing Head & Shoulders neckline near 16.50.  The main source of liquidity for UST appears to be the flow from equities, both in the US and overseas.

The above analysis may seem counter-intuitive, but more likely than not, as the Cycles and EW structure appear ready for the reversal.  The Bank of Canada (as usual, behind the 8-ball) has likely called the top for Treasury rates for the current Cycle.


UST is the inverse of TNX and shows the Master Cycle low on September 1.  The Cycles Model also shows a rally to continue through the end of October or mid-November.  The minimum target for this rally is mid-Cycle resistance at 122.19, but it also may extend to the Cycle Top resistance at 131.52, should it go the full distance.  This makes a compelling case for TLT over the next two months for the more conservative investors.


WTIC futures plummeted to 82.5, confirming our indications of a potential breakdown.  The Cycles Model suggests this breakdown may last through the end of October with a potential initial target being the Broadening Wedge trendline at 65.00.  Of course, that is just Wave 3 of a 5-wave decline.  Crude may decline below 50.00 by the end of the year as demand destruction takes place in a slowing economy.  Unfortunately, the bailout in Europe may also fail, bringing Brent Crude prices lower, as well.  Germany remains skeptical about a natural gas price cap.

ZeroHedge observes, “Oil is tumbling this morning with Brent slumping below $90 to the lowest since February and WTI dumping below $84 for the first time since January…

… as oil prices in the highest odds of any asset class as Goldman first pointed out last week.

The drop has obviously undone all the earlier gains after Russian President Vladimir Putin underlined that his country won’t supply oil and fuel if price caps on the country’s exports are introduced, which briefly pushed oil higher. Putin’s comments follow the G7 most industrialized countries agreeing to back an oil price cap for global purchases of Russian oil. It remains unclear how many countries have signed up to put limits on Russia.

The renewed weakness – which according to Bloomberg’s Jake Lloyd Smith – is driven by a nasty combination of demand concerns plus the dollar’s jump to a record – will test OPEC+’s appetite for further action.”


Gold futures made a new low at 17.02 in the overnight exchanges.  This is in line with the Cycles Model calling for a sustained decline through September monthly options expiration on the 16th.  Trending strength (lower) is coming on strong today and may extend into the week beyond op-ex.  The likely scenario may be a breakdown beneath the lower Cup with Handle formation at 1678.00.

DailyFX reports, “Gold extended its decline in early European trade before a bounce saw it push above the key $1700 level. Yesterday we had a better-than-expected US Headline ISM Services PMI which added to an already bullish dollar driving the US dollar index to a new two-decade top above 110.50. The Asian session saw Chinese data reveal a slowdown in exports and imports for the month according to China’s General Administration of Customs. This coupled with China’s covid-related woes continues to pose a threat to growth as investors fear a downturn in demand with China one of the largest gold importers in the world.”


Posted in Published | Comments Off on September 7, 2022

September 6, 2022

3:22 pm

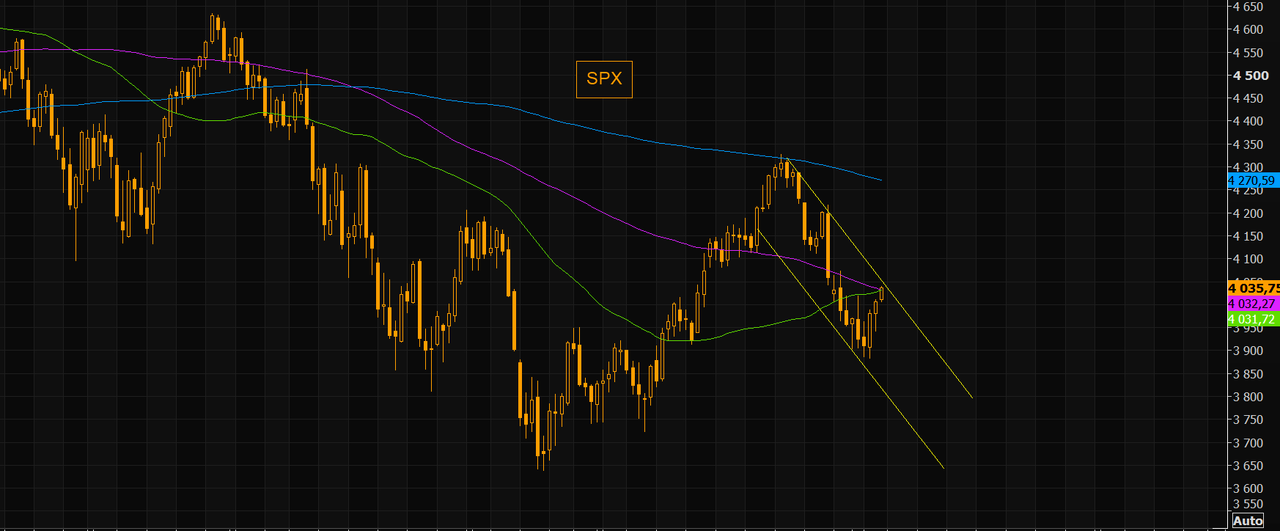
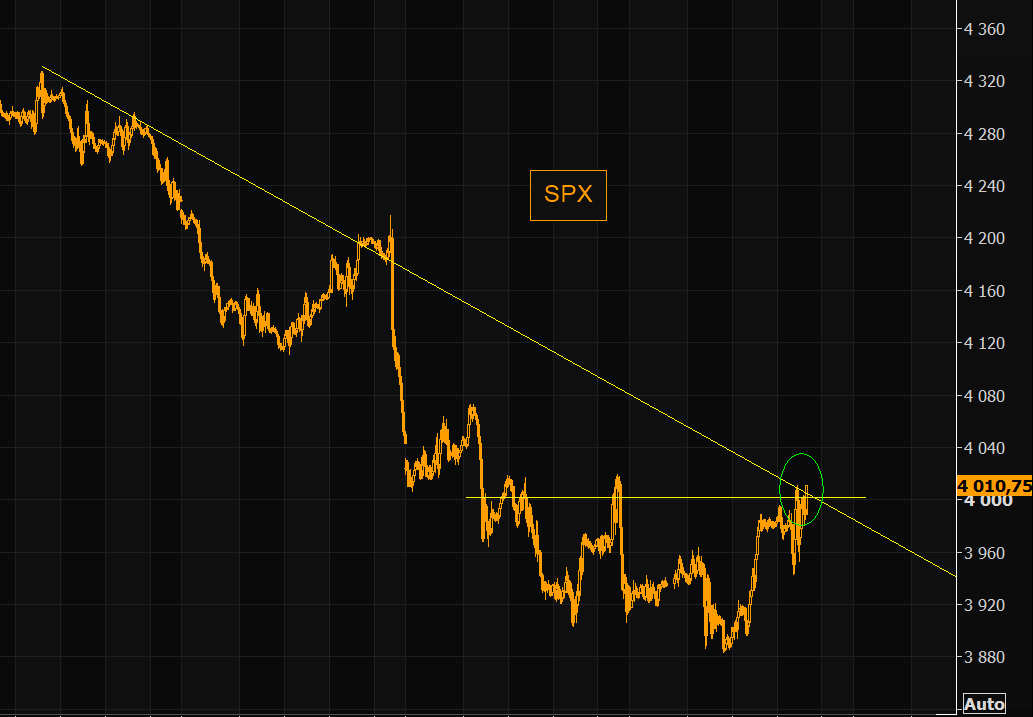
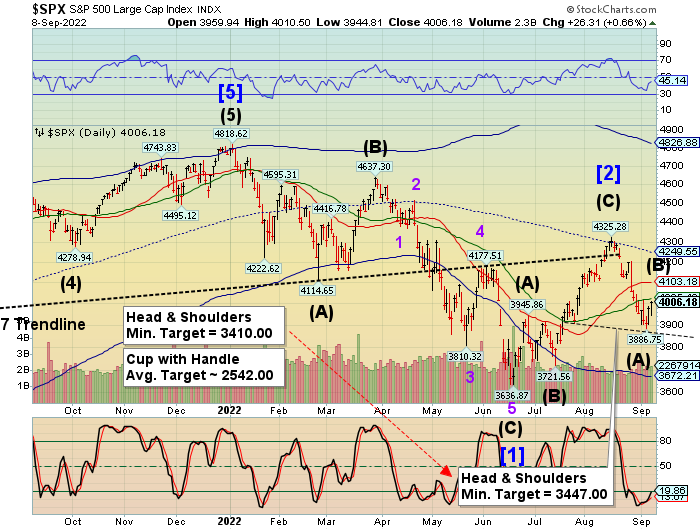
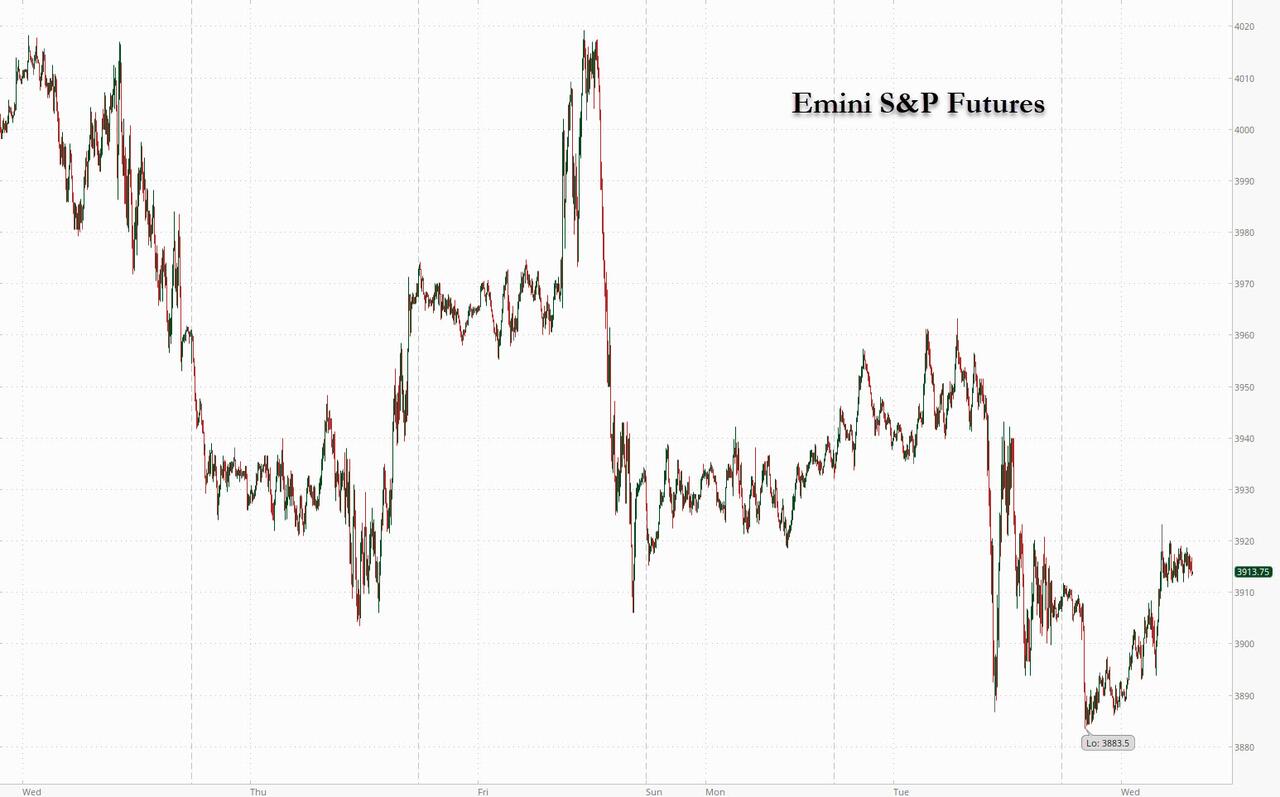
The SPX has clearly violated the neckline of its most recent Head & Shoulders formation at 3903.65 by declining to 3886.75.  It is currently struggling to get back above 3925.00 where short gamma begins.  Even if it succeeds, the door is still wide open for one or more limit down days by the end of the week.  Stand by for the next panic leg (or two) down.


2:52 pm

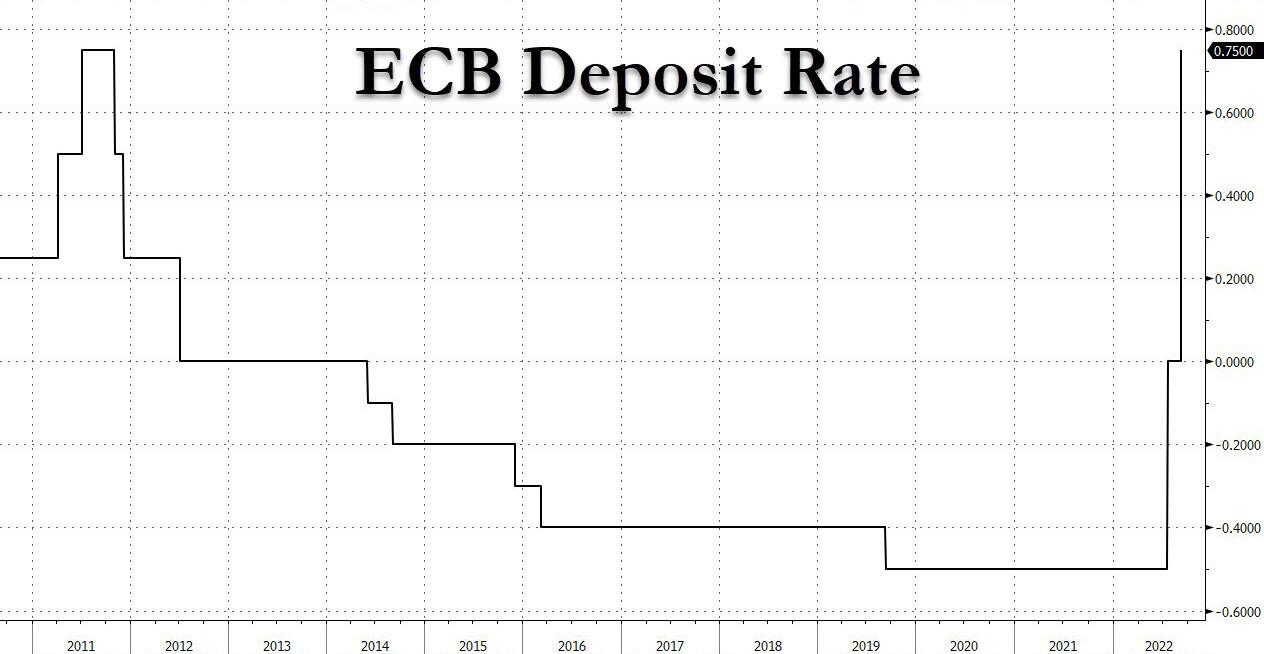
The cause of our malaise in the markets is the collapse of the Euro.  It was created on January 1, 2000 and became the official currency in Europe on January 1, 2002.  The chart shows those dates clearly.  Sir John Templeton explained it to me, recommending Euro stocks in my clients portfolio.  We made a killing, more than doubling our investment on the currency alone.  However, there was a fatal flaw.  They never consolidated their individual country debts into Eurobonds, like the US Treasuries.  As a result, one by one, the weaker countries imploded.  In 2014, Eurobonds with negative interest rates were created.  That action crossed the trendline (Lip) of a Cup with Handle formation that spelled the end to the Euro’s strength.  86 months later (June 2022), it slipped beneath all supports and is now teetering toward collapse.  In April 2020, it may have left another Cup with Handle formation with an even lower target at 65.72.

In the meantime, on October 2020, US banks refused to take any more Euro-denominate debt, creating a credit crisis where the Fed had to step in to bail out European banks!  What actually triggered the crisis is the Federal reserve starting to raise interest rates in June.  The Europeans, who will not borrow their own currency, are deep in US debt and can no longer pay the rising interest rates, much less a more expensive currency. 

We will know more by the end of October , when the current Master Cycle ends.  The combination of the collapse in Europe and our upcoming election is likely to affect us, as well.  This will not turn out well.

ZeroHedge outlines the problem, “What is the scale of the energy challenge?

We got a very shocking sense of the staggering numbers involved in the existential, crippling European crisis earlier today when Norwegian energy giant Equinor echoed what Zoltan Pozsar said in March, warning that “European energy trading risks grinding to a halt unless governments extend liquidity to cover margin calls of at least $1.5 trillion.” As Bloomberg put it, in its best non-Zoltan imitation, “aside from inflating bills and fanning inflation, the biggest energy crisis in decades is sucking up capital to guarantee trades amid wild price swings. That’s putting pressure on European Union officials to intervene to prevent energy markets from stalling.”


10:55 am

BKX, our liquidity proxy, may be about to break down through its massive Head & Shoulders neckline at 97.01.  This formation is largely unrecognized, because it measures 17.2 months from point-to point at the low.  Most technicians will recognize a 3-month long formation and sometimes a 6-month formation, if they are observant.  However, the Cycles may measure in years and sometimes decades that often give a better view “from the top.”


8:15 am

Good Morning!

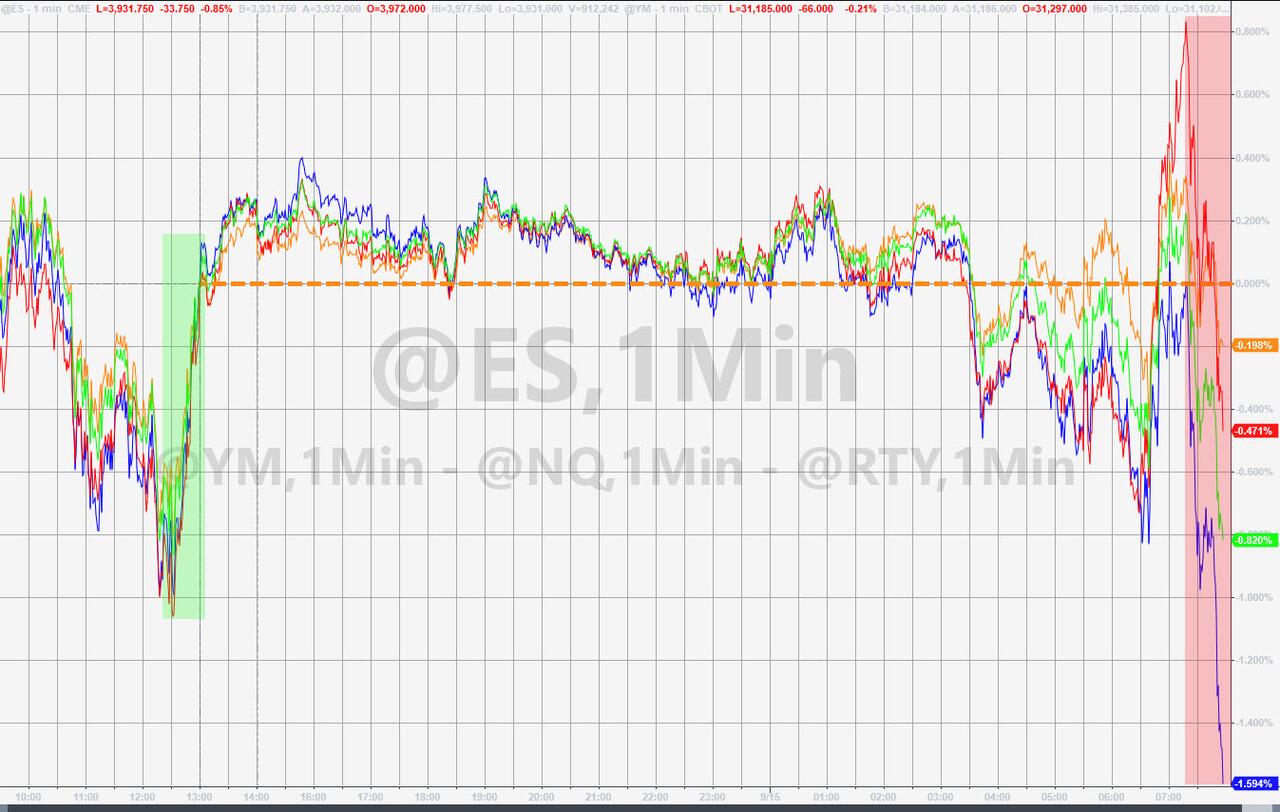
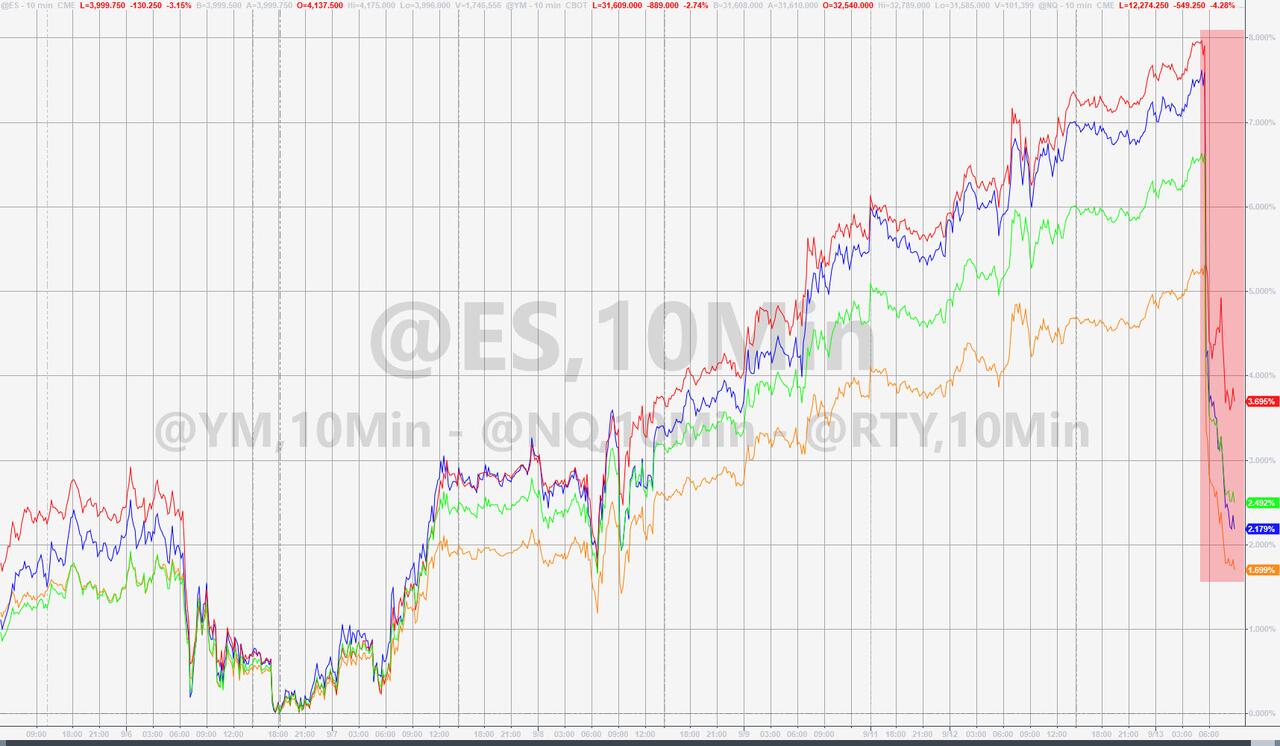
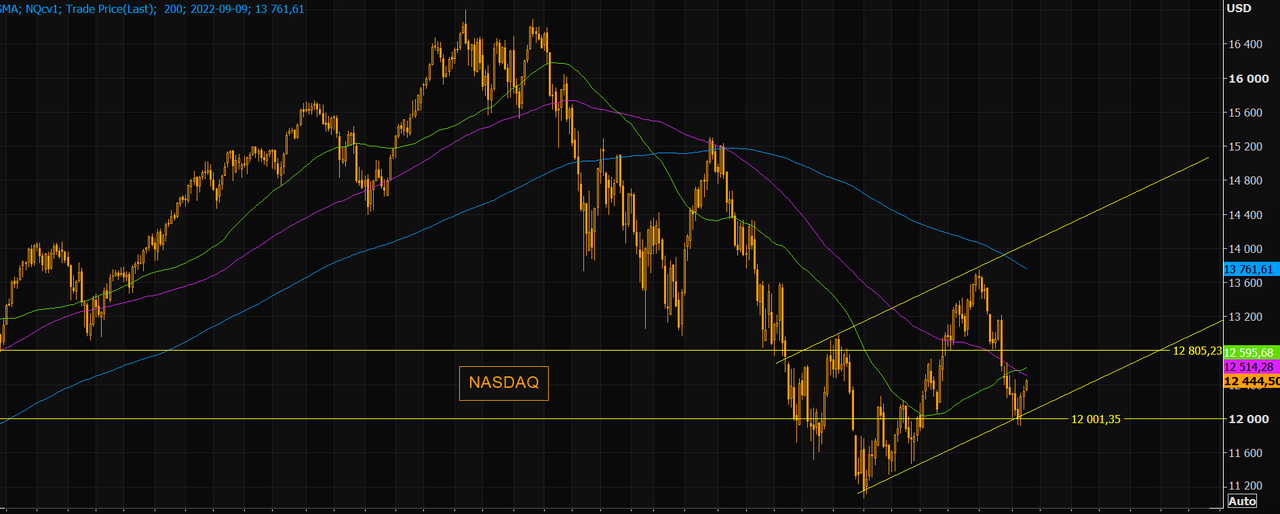
NDX futures made a 48.8% retracement of Friday’s debacle to12238.90, fulfilling its retracement requirements for the decline…and the complete hourly Cycle is taking 4.3 hours from Friday’s high.  No one is expecting a bounce this short, but it may be complete and ready for the next big push lower.  This week is primed for a Panic Cycle and we may see a limit down day (-7%) by the end of the week.  Possibly two limit down days may ensue, since a 7% decline only takes the NDX to 11381.00, only halfway to the minimum Head & Shoulders target.   Nervous investors and advisors are anticipating a bounce today, but the Cycles Model suggests that the market is so deep in short gamma that this decline may not end until September monthly Options Expiration.

Om today’s op-ex, Max Pain is at 12275.00, while short gamma begins at 12225.00, which explains the bounce this morning.  However, the Cycles Model suggests a possible reversal in the first hour of the day.

ZeroHedge offers this thought, “NASDAQ – 12k is huge

NASDAQ has entered significant support areas with the first big one being the 12k level. Note the 50/100 moving day average cross on the shorter term view. Just about to happen?
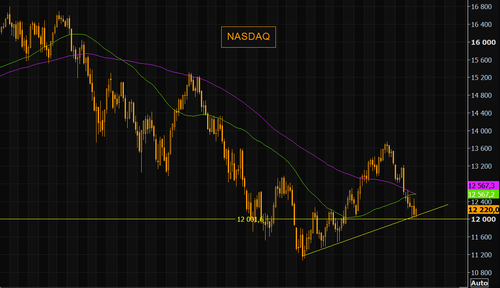
Source: Refinitiv

We are in deep short gamma

Recall that short gamma dealers do not care about direction. They must sell low and buy high mechanically (we have still not met the short gamma trader that manages trading deltas successfully). This mechanical hedging flow works both ways, so don’t forget that a possible move higher will force dealers to start chasing deltas higher (and the inverse works should we sell off, dealers will need to sell deltas).”


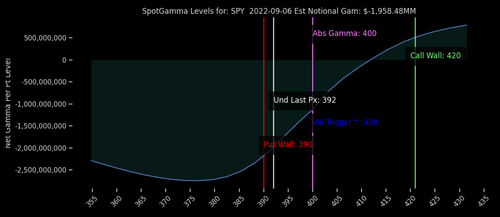
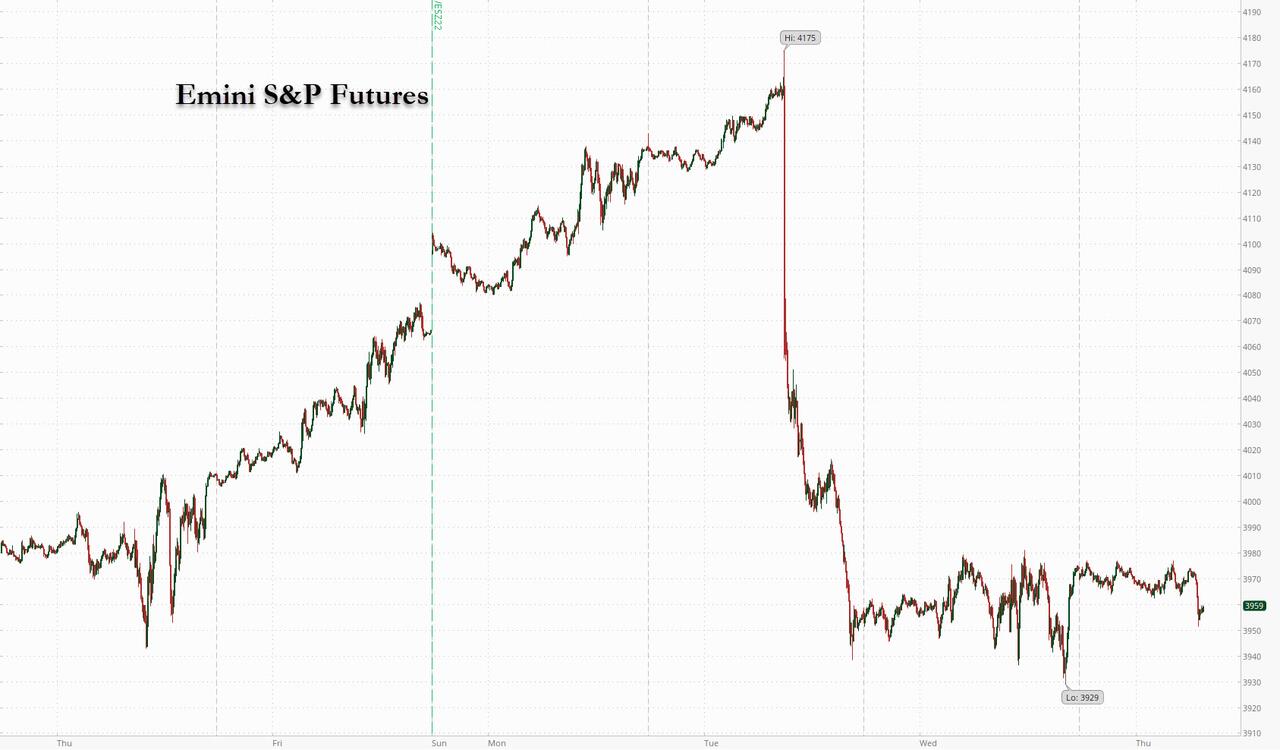
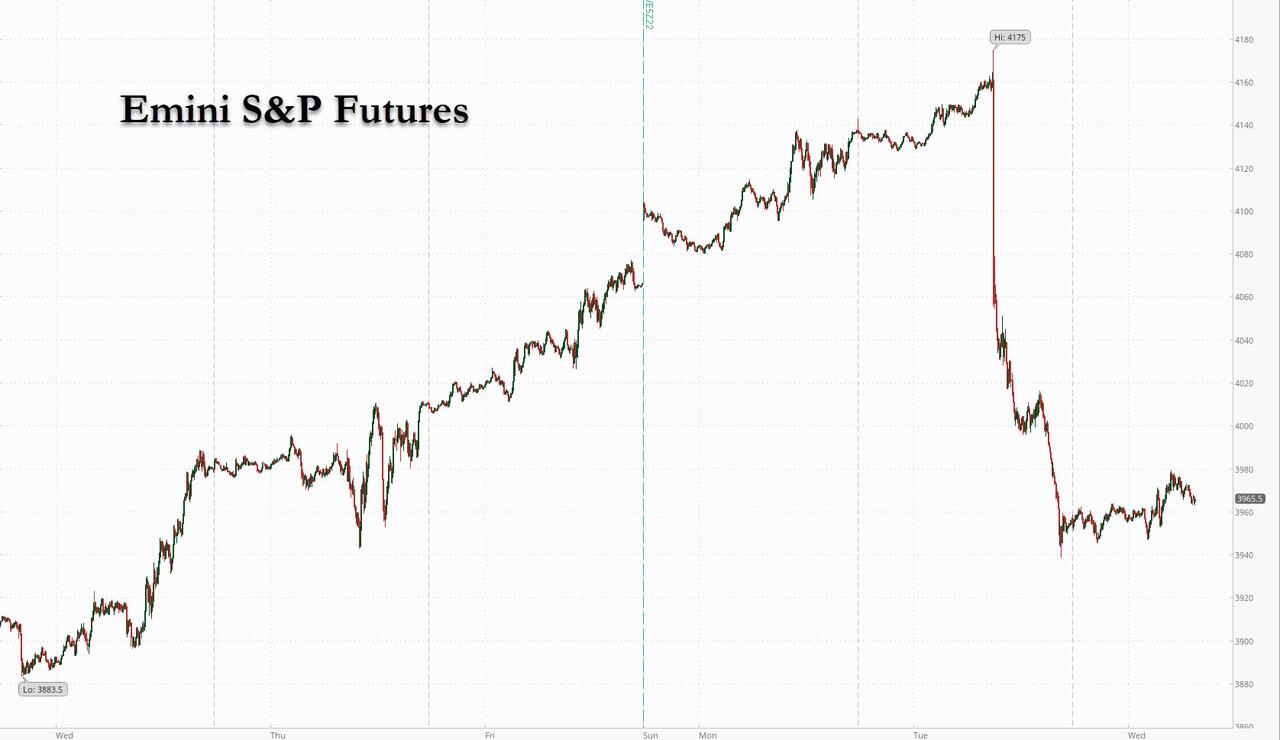
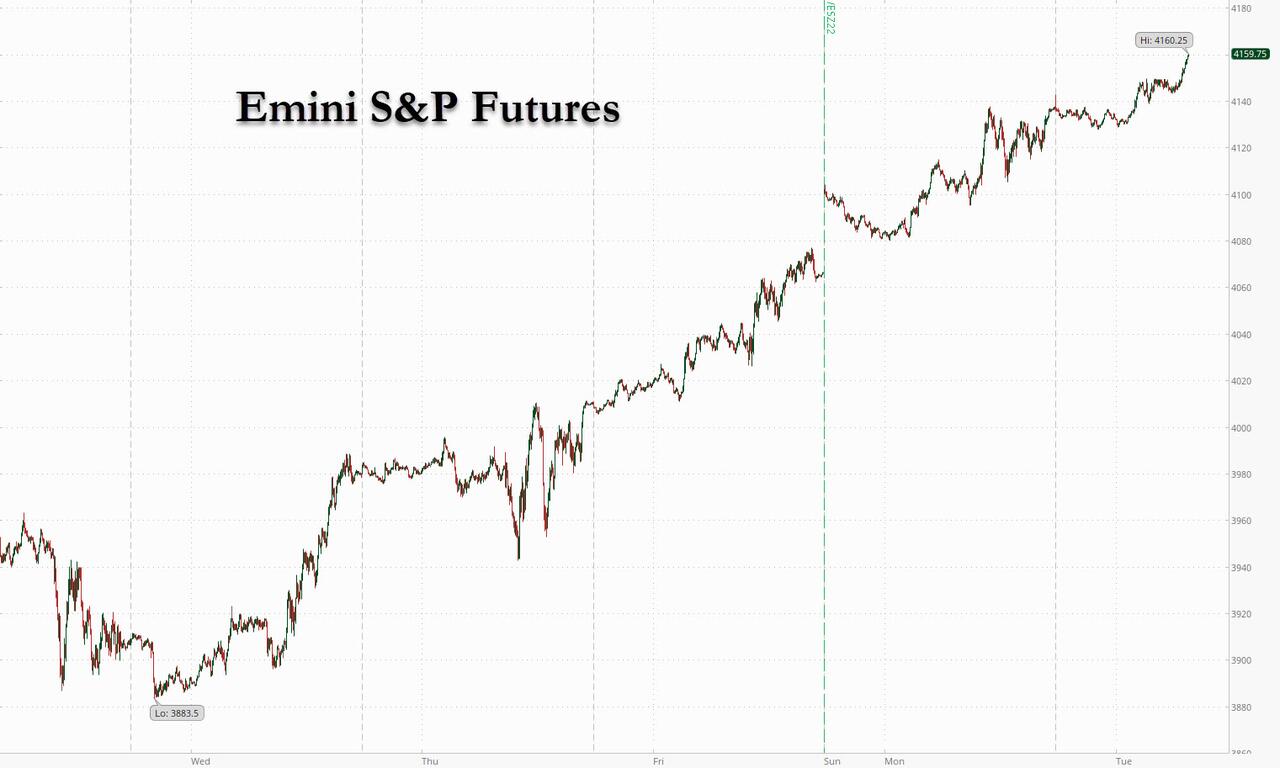
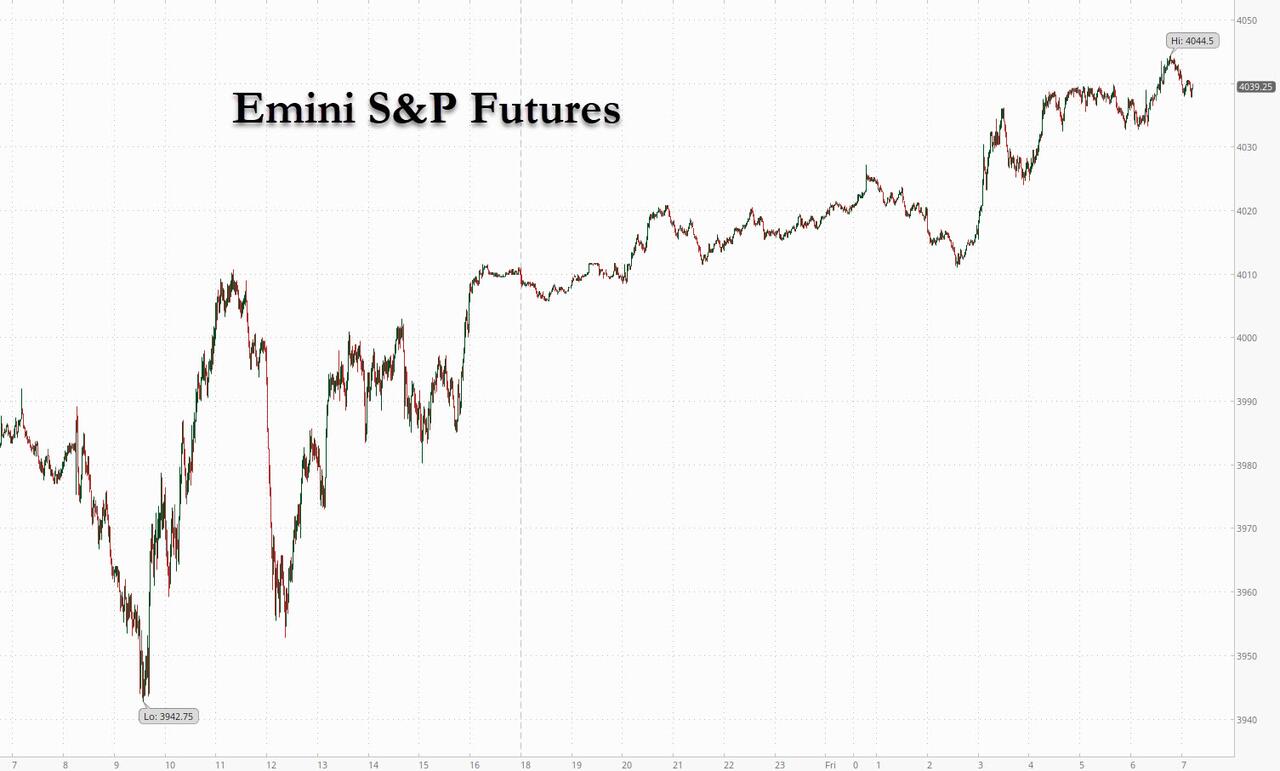
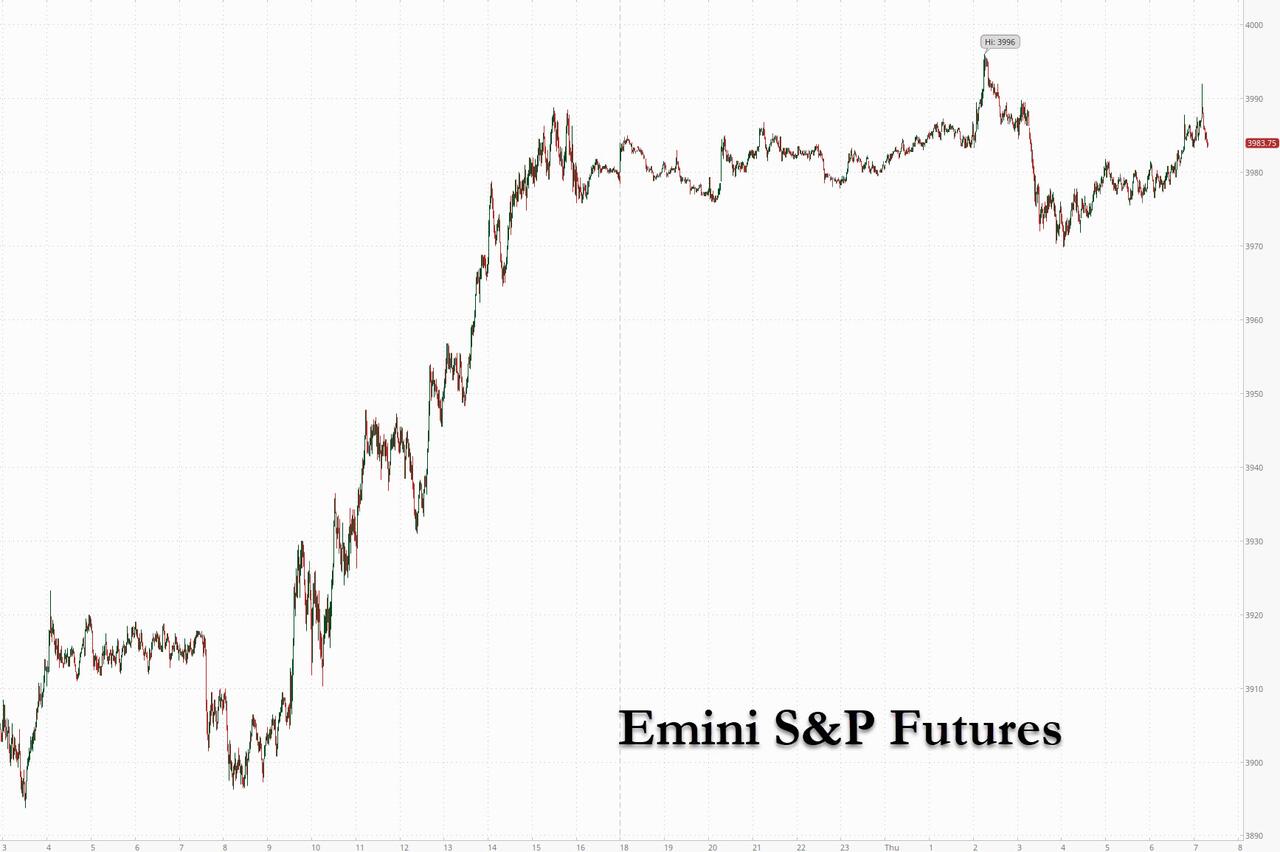
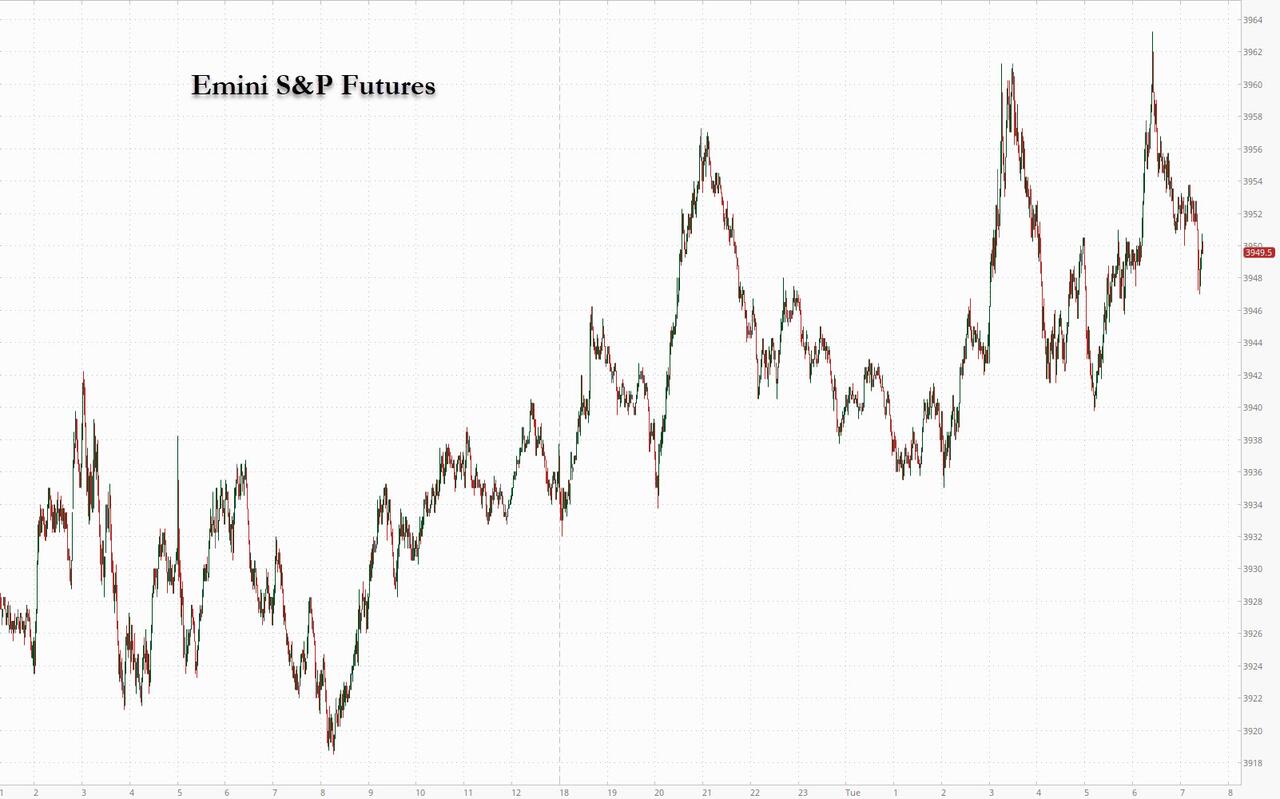
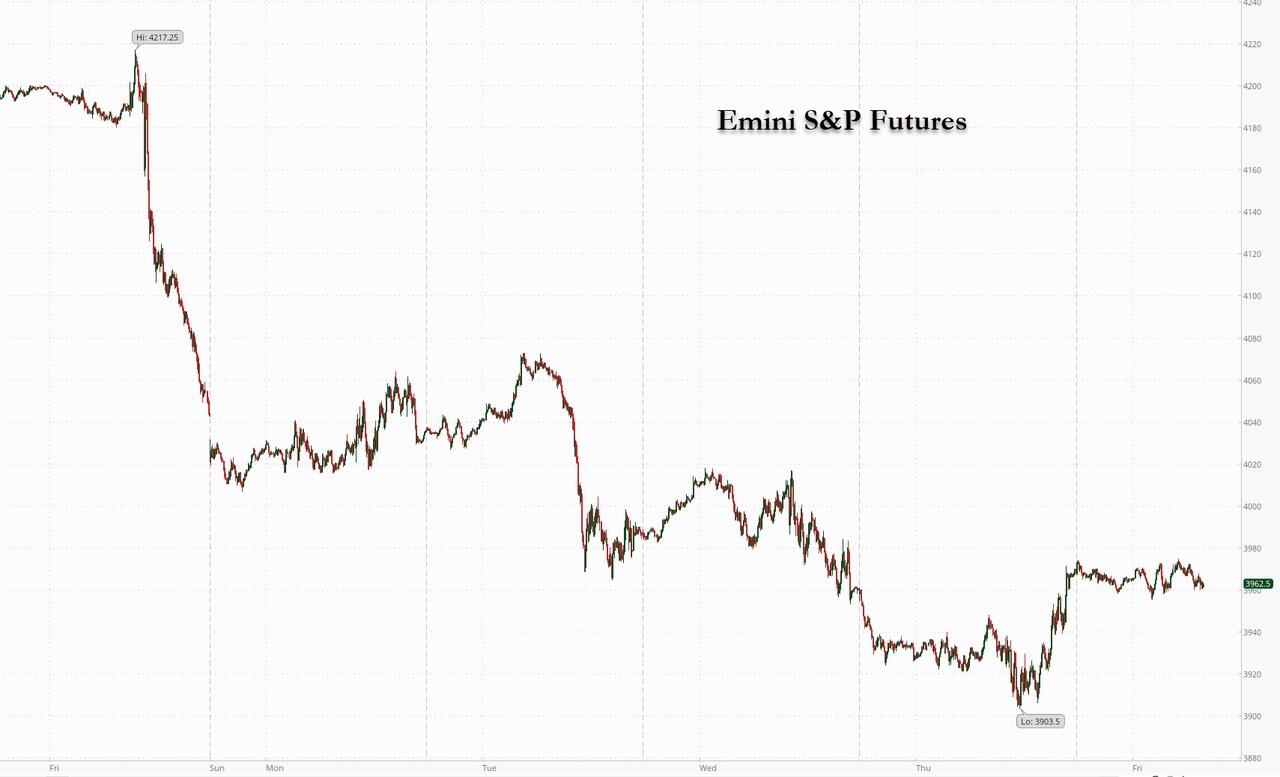
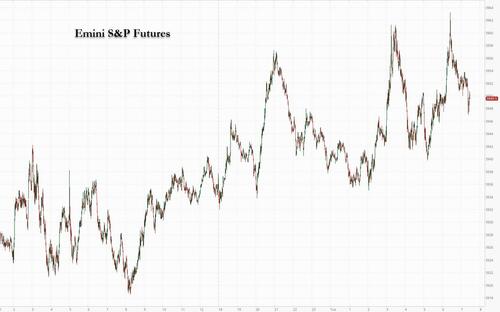
SPX futures rose to a weekend high of 3962.60, an exact 50% retracement of Friday’s decline.  Should the SPX limit down today, its decline would take it to 3685.00, leaving investors and advisors calling it “capitulation” and expecting the bounce to gain traction.  Unfortunately, the old-fashioned technical expertise has left the markets and no one sees the alternative outcome, which is “more decline.”

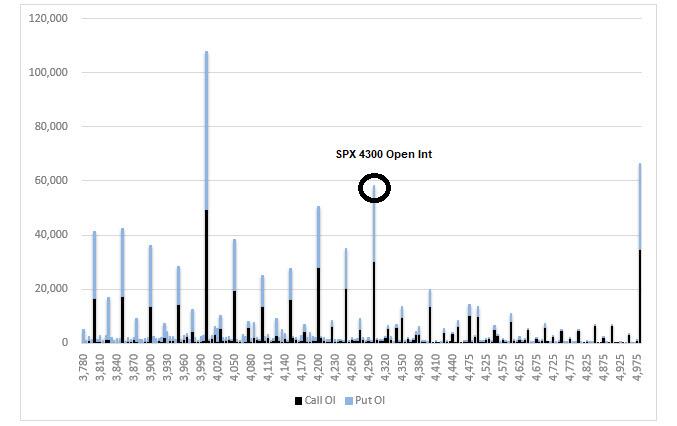
In today’s op-ex, Max Pain is at 3975.00.  However, long gamma doesn’t begin until 4020.00.  Options turn short at 3965.00 and short gamma kicks in with a bang at 3925.00.  You can see why dealers did not want the SPX to close any lower on Friday.

ZeroHedge reports, “Following a flat Monday futures session when the US was closed for Labor Day and European stocks slumped as Russia confirmed it would halt NS1 pipeline flows indefinitely, on Tuesday European stocks and US equity futures rose as governments attempted to blunt the growing energy crisis, injecting tens of billions in fiscal stimulus to offset soaring energy prices and undoing central bank attempts to crush demand with tighter financial conditions. S&P futures rose 0.6% as Wall Street was set to resume trading after the long weekend, while Nasdaq futures rose 0.7%, ignoring – for now – news of more Chinese lockdowns. Meanwhile, as traders eyes the flood of fiscal “energy support”, Treasuries fell across the board, taking the two-year yield to 3.46%, while oil edged down reversing yesterday’s OPEC+ production cut gains on demand risks from fresh Chinese Covid lockdowns. The pound rebounded as traders assessed the agenda of incoming PM Liz Truss. European natgas prices eased with politicians scrambling to find solutions after Moscow switched off its main pipeline to the continent.”


VIX futures eased down to 25.33, a 31.7% retracement.  The Cycles Model suggests a rally in strength for the next 2-3 days as the VIX completes is first bullish Wave from the Master Cycle low.  A minimum target may be near 36.00, but it is just as likely to challenge the Head & Shoulders neckline at 40.00.

In tomorrow’s op-ex, Max Pain resides at 21.00.  While puts are numerous and widely dispersed, they seem to have no traction above 20.00.  Calls dominate above 22.00 with long gamma beginning at 27.00.  Once above 27.00, long gamma appears in full force to 50.00, suggesting the neckline may be breached.

CNN offers this advice, “Markets are hard to predict right now, and that’s raising a question for some on Wall Street: Does a common measure of volatility actually work the way it should?

Traders don’t have a crystal ball to measure the level of risk when they make investment decisions. Instead they depend on the VIX, or the Chicago Board Options Exchange Volatility Index.

Known as Wall Street’s “fear gauge,” the index is supposed to reflect the market’s estimate of future volatility — or how fast prices will change — 30 days out.

An elevated VIX means increased fear and risk while a low VIX means the market is entering a less stressful period. That’s why the VIX tends to move in the opposite direction of the market.”


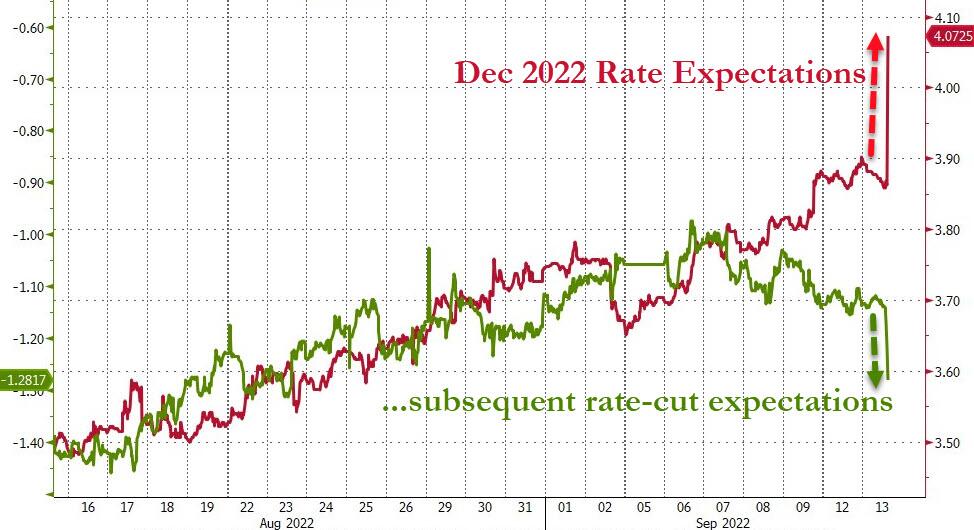
TNX (cash market) rose to 33.42 at the open, as fear of higher rates may give way to fear of a panic stock market.  The current Master Cycle has extended to 277 days, above the normal 2 standard deviation allowance attributed to these Cycles.  This panic may last until mid-November, lopping as much as 50% off the current yield.

That may drive UST to a range of 128.00 to 132.00 by mid-November from Friday’s close at 116.88.  For those who have some cash set aside and choose to be more conservative with their investments, TLT may offer a long alternative.


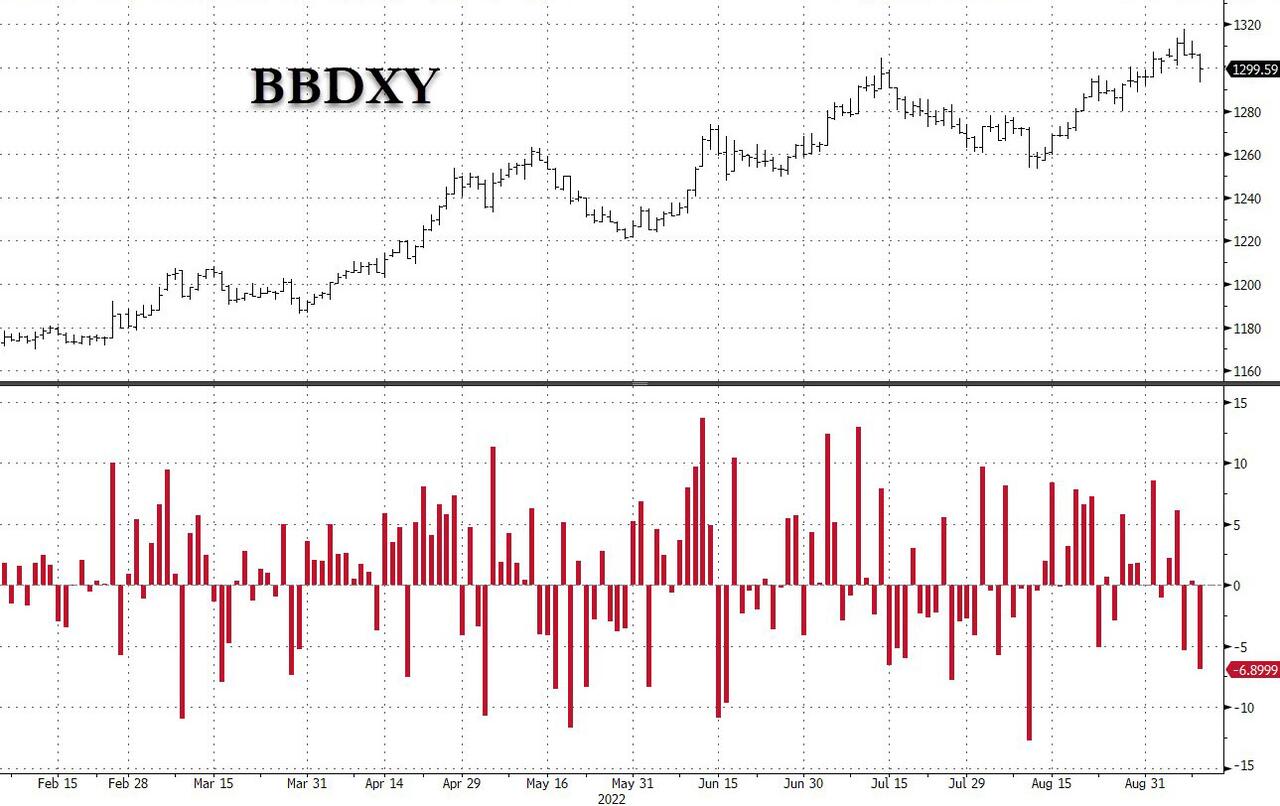
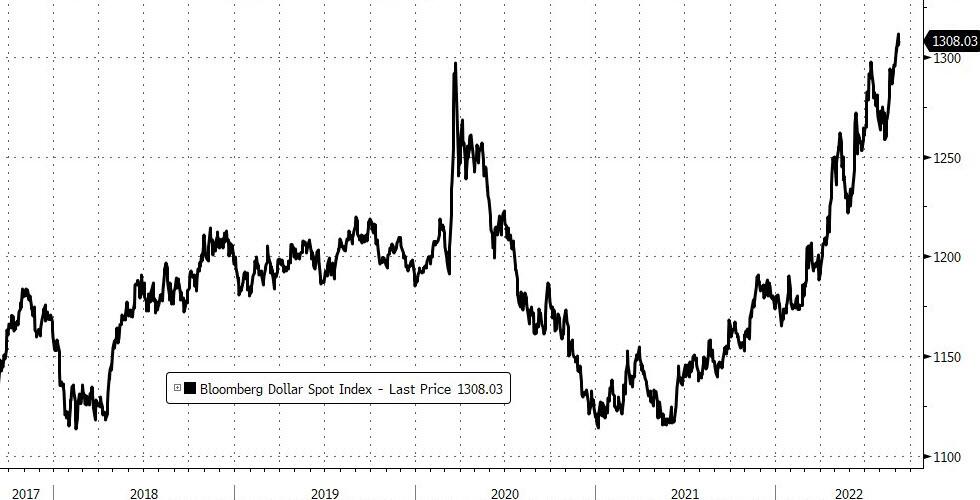
USD futures broke out to a new high at 110.54 this morning, as pressures on the Euro and Yen continue to rise.  The Euro, currently priced beneath 100.00, is in a formation that may take it to 65.00.  More on that later.  In the meantime, the Cycles Model suggests a Panic Cycle beginning this week and lasting through the end of September.  The threat of breaching the July 2001 high at 121.21 looms high.


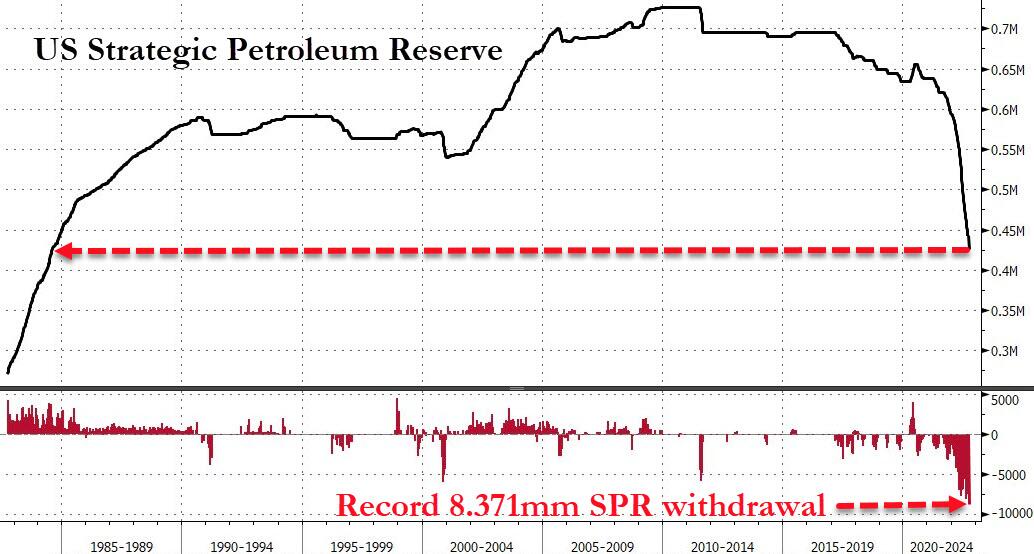
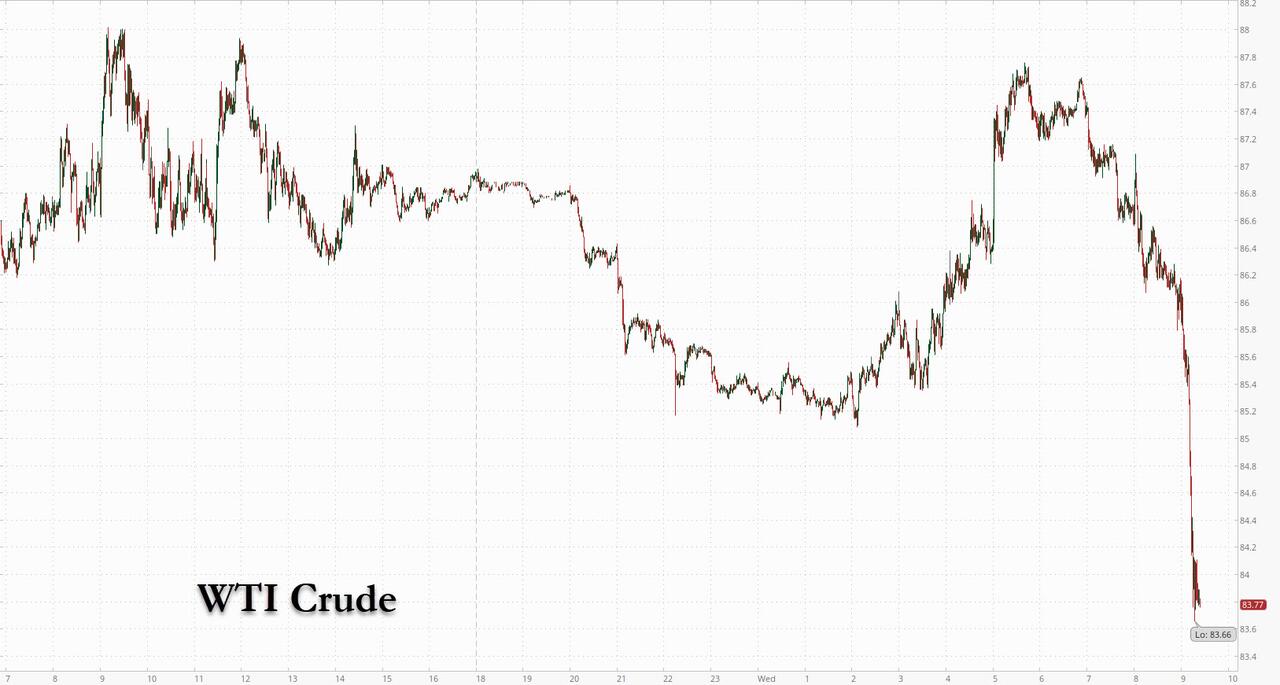
WTIC futures declined to a weekend low of 86.20 as it tests the prior Master Cycle low at 85.73.  Should it break down, there may be nearly two months of decline.  People have asked me why I still have the Broadening Wedge target in full view, despite rising crude oil prices.  The main reason is that the European “fix” may fail miserably, leaving a huge void in liquidity in all markets, including oil.

ZeroHedge reports, “As we detailed over the weekend, many companies are finding it increasingly difficult to manage margin calls, an exchange requirement for extra collateral to guarantee trading positions when prices rise…

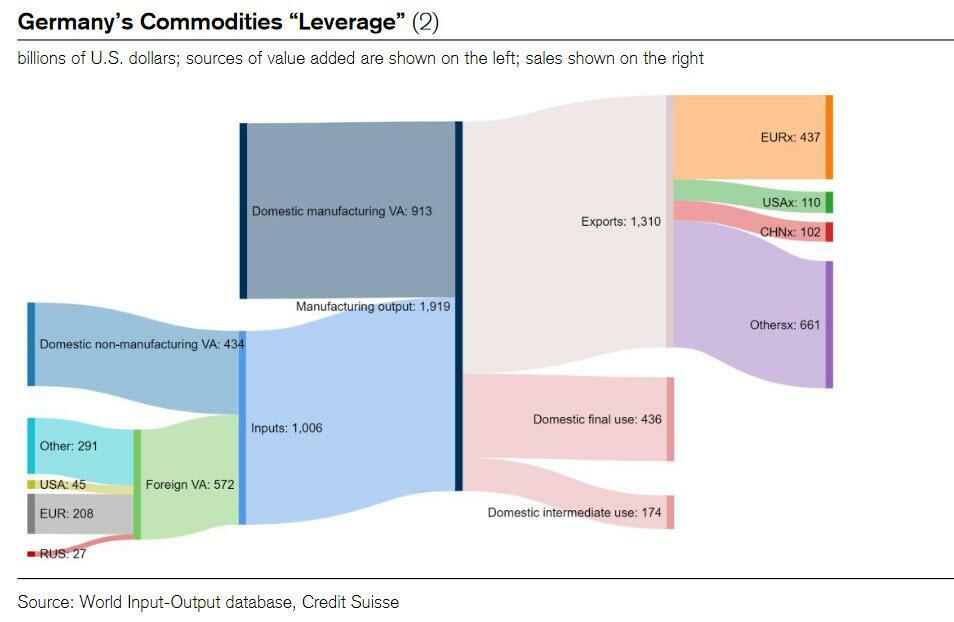
Credit Suisse repo guru Zoltan Poszar published what may have been the most insightful snippet of the entire European energy crisis (to date) when he extended the infamous “Minsky Moment” framework to Europe, and specifically Germany, which he said “can’t cover its payments without Russian gas and the government is asking citizens to conserve energy to leave more for industry.” He then elaborated that “Minsky moments are triggered by excessive financial leverage, and in the context of supply chains, leverage means excessive operating leverage: in Germany, $2 trillion of value added depends on $20 billion of gas from Russia… …that’s 100-times leverage – much more than Lehman’s.” 

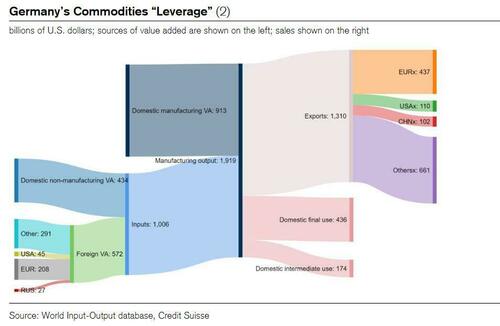
(Zoltan’s entire note is a must read for everyone with a passing interest in what comes next).

But while Germany is front-and-center in this margin call malaise, many other European nations are suddenly succumbing to what Zoltan dubbed a “supply-chain Minsky moment.”

10:25 am

Some leaders are planning massive bailouts to avert a crisis (rioting in the streets).  Case in point, ZeroHedge observes, “Liz Truss, the Conservative Party’s new leader and incoming prime minister, drafted plans for a massive £130 billion support package over the next 18 months to help struggling households and businesses lower energy bills, according to policy documents seen by Bloomberg.

Truss faces massive economic challenges as energy hyperinflation, and a cost-of-living crisis darkens the outlook, with a recession becoming more likely. She has to act swiftly to avert social unrest.”

10:27 am

Other leaders are breaking ranks, as they see much more damage to their own countrymen than to Russia.  ZeroHedge comments, “European solidarity continues cracking amid growing protests in different corners of the EU, with citizens angry at the collective policy of “standing up to Russia” in support of Ukraine at all costs. For example, Germany’s Foreign Minister Annalena Baerbock days ago openly expressed that she’s committed to support Ukraine “no matter what German voters think.”

But elsewhere, Italy’s League party leader Matteo Salvini, (which the mainstream media consistently dubs as “far-right wing” – though he would describe his party as the government of “good sense”) on Sunday broke ranks with other European leaders who have lately seemed to echo some form of this ‘Ukraine first’ policy.

On Sunday Salvini urged an end to Russia energy sanctions which are only leaving Europeans “on their knees” due to higher energy bills and lack of supply. “Several months have passed and people are paying two, three, even four times more for their bills,” he said in an interview RTL radio. “And after seven months, the war continues and Russian Federation coffers are filling with money.”

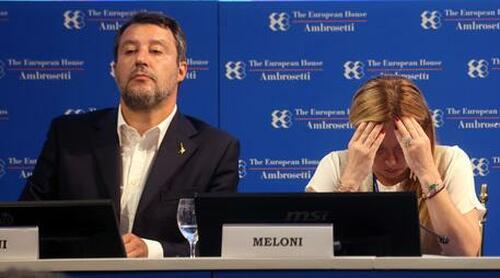
He explained that not only are the sanctions not working, but they hit Italy harder. While saying he stands in solidarity with Ukraine, he’s not willing to stick with something obviously counterproductive where the blowback is felt more in Europe, Italy in particular with its soaring energy import prices, and not the intended target of the Putin government.”


Gold futures rose to 1737.10, but has since backed down from Friday’s close.  The Cycles Model suggest that gold may continue lower at least until Options Expiration in mid-September.  Should it break through the Lip of the Cup with Handle at 1680.00 in the interim, a much deeper decline may ensue.  Gold has lost its luster, primarily due to the lack of secure transportability and the threat of seizure, as the federal government tracks all transactions.  Should gold break beneath the 2015 low at 1045.40, we may see gold decline further toward 800.00.

ZeroHedge reports, “Towards the end of July, news emerged in the Russian media that Moscow and a number of its Eurasian allies are now reviewing a proposal to create an entirely new trading and pricing infrastructure for the international precious metals in order to both destroy London and New York’s monopoly over global precious metals pricing, and to stabilize the Russian gold market.”


Posted in Published | Comments Off on September 6, 2022

September 2, 2022

12:42 pm

SPX topped out at 4018.43, just above the 50-day Moving Average at 4011.78.  I have been considering the alternate count and have put it on the chart.  This calls for another week of decline to an area near 3500.00.  By the way, the initial Head & Shoulders minimum target was 3913.00.  I removed it when I saw the next potential Head & Shoulders shown here.  Stay short and enjoy your holiday!

Tony


8:35 am

Today’s Employment Situation Survey shows, “Total nonfarm payroll employment increased by 315,000 in August, and the unemployment rate rose to 3.7 percent, the U.S. Bureau of Labor Statistics reported today. Notable job gains occurred in professional and business services, health care, and retail trade.”

ZeroHedge reports, “With Goldman warning ahead of today’s payrolls print that an “Inline print of 300k(ish) will keep pressure on this tape”, moments ago the BLS reported that – as expected in the somewhat negative case – August payrolls indeed came 300k(ish)- or 315K specifically, dropping from an downward revised 528K in July, and just above the 298K consensus estimate. After all of last year’s data revisions, this was the lowest monthly increase since April 2021.”

Watch for the rally to rise above or stay beneath the 50-day Moving Average at 4007.82.


7:20 am

NDX futures hovered above the proposed Head & Shoulders neckline at 12012.98 after a nearly 12.5% decline from its August 16 high.  Today is day 17  (of 55) of the current Master Cycle.  Although oversold, NDX is deep in short gamma territory beneath 12500.00.  The  50-day Moving Average is at 12496.97.  The 38.2% Fibonacci retracement is at 12665.46.  In other words, a rally above 12500.00 gives the bulls some relief, but leaves the Head & Shoulders formation in its wake.  The alternate view is a continued decline to or beneath the June 16 low.

Today’s op-ex shows NDX in short gamma beneath 12500.00.  There is no discernible long gamma level.  QQQ (closing price 299.40) shows short gamma up to 305.00.  Long gamma may begin at 306.00, but not as strong  as short gamma beneath 300.00.

ZeroHedge observes, “While there is a wide range of forecasts for tomorrow’s payrolls print (see below), the median Street consensus expects the rate of payrolls growth to resume cooling in August, following a blowout month in July. The jobless rate is expected to hold steady, and there will be focus on the rate of participation after a decline last month. Average hourly earnings metrics will be a key focus to help gauge how surging consumer prices are translating into second-round effects and the wage-price spiral; some gauges suggest that the rate of pay rises is now exceeding the Fed’s preferred measures or inflation.”


SPX futures are flat, ranging from 3955.00 to 3974.00.  Current conditions suggest a possible binary outcome.  Should SPX remain beneath the 50-day Moving Average at 4007.82, the decline may continue to the next level of support at the Cycle Bottom at 3681.21.  On the other hand, should the rally persist, the 38.2% Fibonacci retracement is at 4065.00 and the 50% retracement is at 4115.00.

In the SPX op-ex, Max Pain is at 4005.00, even though short gamma starts at 4000.00.  Long gamma starts at 4050.00.   In other words, SPX must rally above the 50-day Moving Average at 4007.82 to regain long support in the options.  Op-ex in SPY (closing at 396.42) remains in short gamma beneath 400.00, with super-short gamma beneath 395.00.  Long gamma starts at 408.00.

ZeroHedge reports, “US futures dropped on Frida, ending a third straight week of declines, as investors eyed a key jobs report that will be pivotal for this month’s Fed rate hike decision. S&P futures fell 0.2% at 730 a.m. ET, with the underlying cash index down 2.2% this week. Nasdaq 100 futures fell 0.3%, with the tech-heavy index down 2.6% in the previous four days. The dollar index slipped from a record high and the euro strengthened. 10Y yield traded slightly lower, at 3.25%, following yesterday’s spike.”


VIX futures consolidated above the mid-Cycle support at 25.04.  While the Wave off the Master Cycle low appears complete, it may also be in a binary position, where it could either retrace down to 22.00 or continue its rally with the Cycle Top resistance at 34.14 as the potential target.

In next Wednesday’s op-ex, Max Pain appears at 26.00.  Calls dominate above 27.00 with long gamma potentially starting at 27.00.  Beneath 26.00 is a mixed bag, with calls dominating at 23.00 and 24.00.


TNX may have made its long-awaited reversal this morning, after a 272-day Master Cycle.  The reversal may be an indication of liquidity flowing out of equities and into cash or Treasuries.  The Cycles Model suggests a possible 75-day decline to a target near 16.50.  This may be quite a move and has little or nothing to do with the Fed.  In fact, it may be a surprise to them.


USD futures pulled back, but remain above the trendline near 108.70.  Despite lower yields in TNX, USD may continue its rally through the end of September.


Posted in Published | Comments Off on September 2, 2022

September 1, 2022

10:31 am

SPX has made a new low beneath the support level at 3910.74.  Should the SPX go significantly lower, it may be set up for a limit down day.  For the moment, it must emerge above the confines of short gamma beneath 3950.00 to be complete a retracement rally.  There is no indication to take short profits.


7:50 am

Good Morning!

NDX futures made a new low in the overnight market, reaching 12102.90.  That is a mere 51 points above the next support level at 12051.20.  It may also be the bottom for Intermediate Wave (1).  There is no NDX op-ex today so there may be some relief from the downward pressure.  Tomorrow is calendar day 17.2 (market day 12.9) from the top and an appropriate place for the end of the first hourly Cycle.  The daily Cycle suggests that the decline may not be over until a 55-day decline is complete.  Should a bounce develop here, it may be short and sharp.

ZeroHedge remarks, “SPX – approaching big levels

We outlined our most bearish market logic on Aug 16 in our post “Are we there yet? Yeah….” Since then the SPX has fallen from 4300 to currently trade around 3930. Needless to say, that trade has played out well and is not attractive at these levels.

3900 is a very big support for the SPX, followed by the 3800 and then the June lows. Resistance is at 4k, and then the 4100. We are now well below the 200 day and have closed below the 50 day three days in a row. Time to easy some of the bearish logic soon from a short term trading view….

Source: Refinitiv

NASDAQ – approaching short term must hold

NASDAQ is down around 11% from the reversal on Aug 16 and is closing in on the big 12k support. A close below and the next big support area is down around 11600. Resistance levels are: 12600 and 13k.”


SPX futures reached a new low at 3919.80 in the overnight session, just above a critical support level at 3910.74 that I had pointed out earlier.  This may be the terminus for Intermediate Wave (1) with a probable bounce lasting through Friday.

Today’s op-ex shows Max Pain at 3990.00 with long gamma beginning at 4025.00.  Short gamma begins at 3950.00, so there is likely to be an effort to bounce out of that zone today.  However, with liquidity in short supply anything may happen.

ZeroHedge reports, “With September already historically the ugliest month for markets of the entire year…

… an underperformance which this year will likely be on steroids thanks to the Fed’s doubling of QT to $95BN starting today…

… especially with stocks having gone from overbought to oversold in two weeks as bullish sentiment imploded…”


VIX futures rose to 27.30, beneath Tuesday’s high at 27.69.  The  first Wave off the Master Cycle low is complete and it may be time for some consolidation, if not retracement.

Next Wednesday’s op-ex shows Max Pain at 21.00, suggesting a probable retracement near that level before a burst higher.


TNX futures have stretched its Master Cycle high to day 272 today at 32.65.  While not making a new high, TNX shows added liquidity pressure in the markets.  TNX ix due for a reversal here with s potentially significant drop in yield.  This may prove ominous for equities.

ZeroHedge comments, “Deteriorating liquidity in Treasuries points to turbulence across various assets.

A Bloomberg liquidity index that measures deviations of yields from their fair value climbed to the highest level since March 2020 this week.

Such “noise” in the US bond market suggests a general lack of arbitrage capital and tightening of liquidity in the overall market, according to a research paper from the National Bureau of Economic Research.

ZeroHedge also observes, “Starting with first principles, there is one thing that almost all traders can agree on and it is that, sooner or later, the Fed tightening cycle will spark another financial crisis and market crash, something which we reminded readers in early 2022:

But while there is little disagreement on what the Fed’s endgame is, the big question is how we get there and what exactly will lead to the overtightening that crashes the economy, sparks a policy panic and bring another Fed overreaction in the opposite direction.”


Posted in Published | Comments Off on September 1, 2022