April 5, 2024

9:52 am

Good Morning!

Yesterday was noteworthy in the fact that the Cycle Top, at 5264.65, formerly support for the past two months, became resistance in the SPX.  Once that was tested, SPX declined sharply to Intermediate support at 5140.62, where it bounced.  SPX may now test the trendline near 5200.00, although it may reverse short of that target.  The next level of support is the 50-day Moving Average, at 5074.05.  Beneath that lies the 1987 trendline and the 100-day Moving Average, at 4875.02.  The Cycles Model suggests a possible month of decline ahead.  Trending strength may switch to the downside early next week.

Today’s options chain shows Max Pain at a very crowded 5200 for both puts and calls.  While clls occupy a small majority above that level, puts now dominate the options chain beneath 5200.00.

ZeroHedge reports, “US futures rebounded from yesterday’s late day rout even as European stocks slumped the most in almost two months and Asian markets tumbled the most in a month, tracking Thursday’s broad market retreat as oil prices held near five-month highs above $90 and investors braced for today’s jobs report where the whisper is of a hotter than expected print. As of 7:30am, S&P futures rose 0.3% after tumbling 1.4% yesterday; even with the modest gain the index is on track for its biggest weekly decline since mid-February.  Europe’s Stoxx 600 slid more than 1%, following the previous session’s sharp retreat on Wall Street and losses in Asia earlier on Friday. US and euro-area bond yields inched higher as fears of an escalation in the Middle Eastern conflict kept Brent crude futures near $91 a barrel, fanning inflation concerns. The USD is stronger, bitcoin has resumed selling, commodities are higher led by Energy products and base metals. From a macro perspective, NFP is the focus, survey is +214k survey vs. BBG whisper +230k; both are down from the +275k prior.


VIX is consolidating near the upper end of yesterday’s trading range.  The Cycles Model suggests that a burst of trending strength may be imminent.  The February high is likely to be overcome.

Wednesday’s op-ex shows Maximum Investor Pain at 14.00.  Negative gamma beneath that level is scarce, while positive gamma is building near the October high.

ZeroHedge observes, “What started to be a rather stable and uneventful session, ended in some turbulence after a sharp reversal lower triggered by Middle East geopolitical headlines (a spike in oil) and hawkish fed speak.

All sectors finished in the red, with 430 S&P names finished lower (NVDA, GOOG/L, AMD, and AMZN contributed to 30% of move lower). Momentum, AI & New Technology, and Retail Favorites were among the hardest hit all down -2%. NDX broke through its 50dma (17,903…keep an eye on 100dma = 17,134).”


TNX may be consolidating, although at a higher level today.  The Cycles Model suggfests trending strength building over the next two weeks.  The Cycle Top at 48.28 appears to be an appropriate target.


BKX is pressing down on its 4.5-month trendline at 100.00 this morning.  Loss of upward support will be critical and lead to a confirmed sell signal.  This is also a clear sign that liquidity is drying up.


Posted in Published | Comments Off on April 5, 2024

April 4, 2024

8:15 am

Good Morning!

NDX futures rose to an overnight high of 18279.30, nearly making the 61.8% Fibonacci retracement at 18292.00.  The Cycles Model suggests a probable brief retracement high this morning prior to resuming the decline. Intermediate support and the Diagonal Trendline lie at 18043.19, beneath which a confirmed sell signal may be made.

This morning’s options chain shows Maximum Pain for investors at 18160.00.  Long gamma may start at 18170.00 while short gamma may begin at 18150.00.


SPX futures have risen to an overnight high of 5234.80 thus far, a near-61.8% retracement.  There may be a brief probe to a new retracement high at the trendline in the cash market followed by a likely resumption of the decline.  This may fulfil the trending strength indicated by the Cycles Model yesterday.  Remember, the trend is still “higher” at this juncture although a reversal may have been made.

Today’s op-ex shows Max pain at 5220.00.  Long gamma may begin at 5225.00 while short gamma may start at 5215.00.

ZeroHedge reports, “US equity futures are higher with both Tech and small-caps outperforming, while the dollar is lower even as yields are higher from Wednesday’s close. As of 7:50am, S&P futures were 0.3% higher and Nasdaq futs rose 0.4%, boosted by Powell’s comments that recent inflation figures did not “materially change” the overall picture while the latest ISM Services print was far less inflationary than the ISM Manufacturing print, in fact bizarrely so. In Europe, major markets are also all higher as part of a global risk-on tone.  Bond yields are +1-2 bps, even as Bloomberg’s dollar index extended its slide for a third day, following its biggest one-day fall in nearly four weeks.  In commodities, energy is a tad lower with Brent trading just below $90, metals are mixed, and Ags are stronger; copper – which as we noted previously could be the first “AI commodity” is the notable outperformer. Today’s macro data focus is on jobless claims but likely will be ignored with the jobs report tomorrow; we also get seven Fed speakers today.”


VIX futures sagged to a low of 14.03 this morning, near the 50% retracement level at 13.92.   It is odd that the retracement percentage in the VIX is lower than that of the SPX.  The Cycles MOdel shows the VIX gaining in trending strength by this weekend.

Next Wednesday’s op-ex shows Max Investor Pain at 14.50.  Short gamma has moved up to 14.00, while long gamma begins at 16.00.  There seems to be no rush to buy protection.


TNX has pulled back from its breakout high made yesterday.  The rally may resume, in strength, after a brief consolidation.

ZeroHedge observes, “MOVE inching higher

MOVE closed marginally higher yesterday. The latest “bounce” in rates volatility has actually been one of the bigger moves higher in a while. From recent lows, but still…”


Posted in Published | Comments Off on April 4, 2024

April 3, 2024

10:27 am

BKX is slowly losing its grip on the retracement rally.  It made an early Master Cycle high March 28, on day 248 and may need another week to prove the high.   In the meantime, critical support lies at the trendline at 101.00-101.50.  Beneath that level is a sell signal with confirmation at Intermediate support at 98.83.  A breakdown may lead to a broader sell-off in nearly all assets, as investors flee to cash.

ZeroHedge remarks, “There are more dormant office towers in the United States than at any point since 1979, according to a new report from Moody’s Analytics, which began tracking office leasing vacancies that year.

The rising supply of office space is due to a combination of surging remote and hybrid work that forces companies to reduce corporate footprints. Also, companies are exiting imploding progressive cities and high-taxed blue states for red ones while downsizing space.

In the report, office tower vacancies rose to a record 19.8%, up from 19.6% in the fourth quarter of 2023.”


8:25 am

Good Morning!

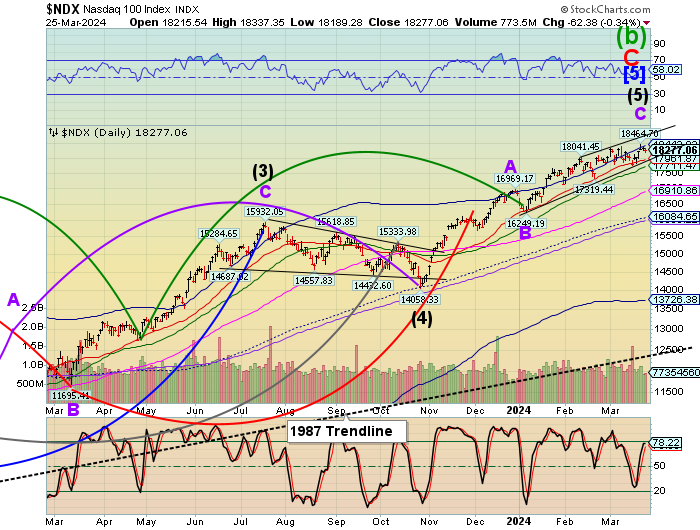
NDX futures retraced to 18132.30 before slipping back toward the trendline and Intermediate support at 18027.00.  It is on an aggressive sell signal which may be confirmed beneath the abovementioned trendline.  NDX marked its high on March 21.  SPX made its high on March 28.  Should those highs remain intact, the trend may be down until mid-May.

Today’s options chain shows Maximum Investor Pain at 18150.00.  Long gamma may begin at 18200.00, while short gamma may start at 18100.00.

ZeroHedge reports, “Taiwan Semiconductor Manufacturing Co., the leading contract chipmaker for Apple Inc. and Nvidia Corp., shuttered some of its chipmaking capacity and evacuated plants after the biggest earthquake in 25 years rocked the island nation, just east of mainland China.

Taiwan plays a significant role in manufacturing advanced chips for artificial intelligence, smartphones, computers, and electric vehicles. The country is estimated to produce 80% to 90% of the highest-end chips.”


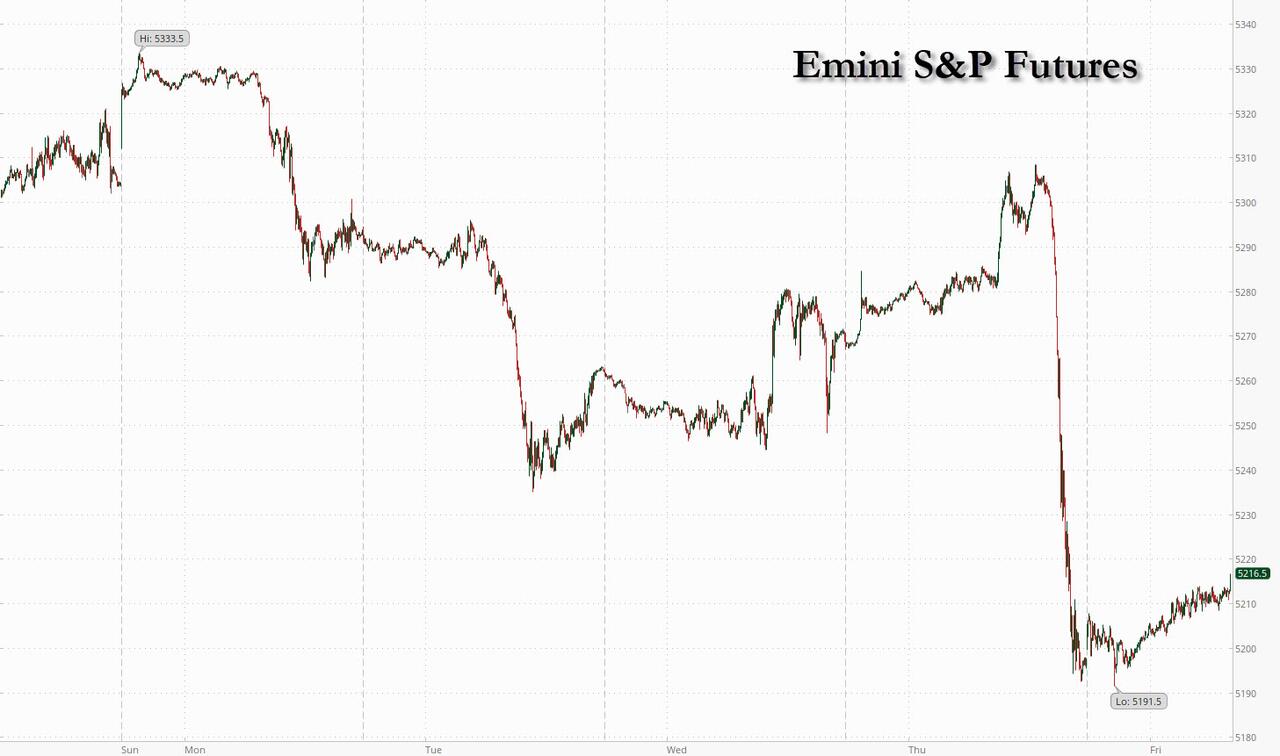
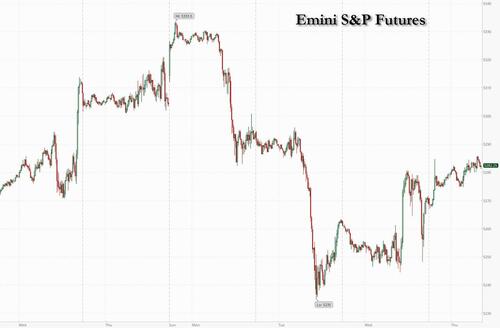
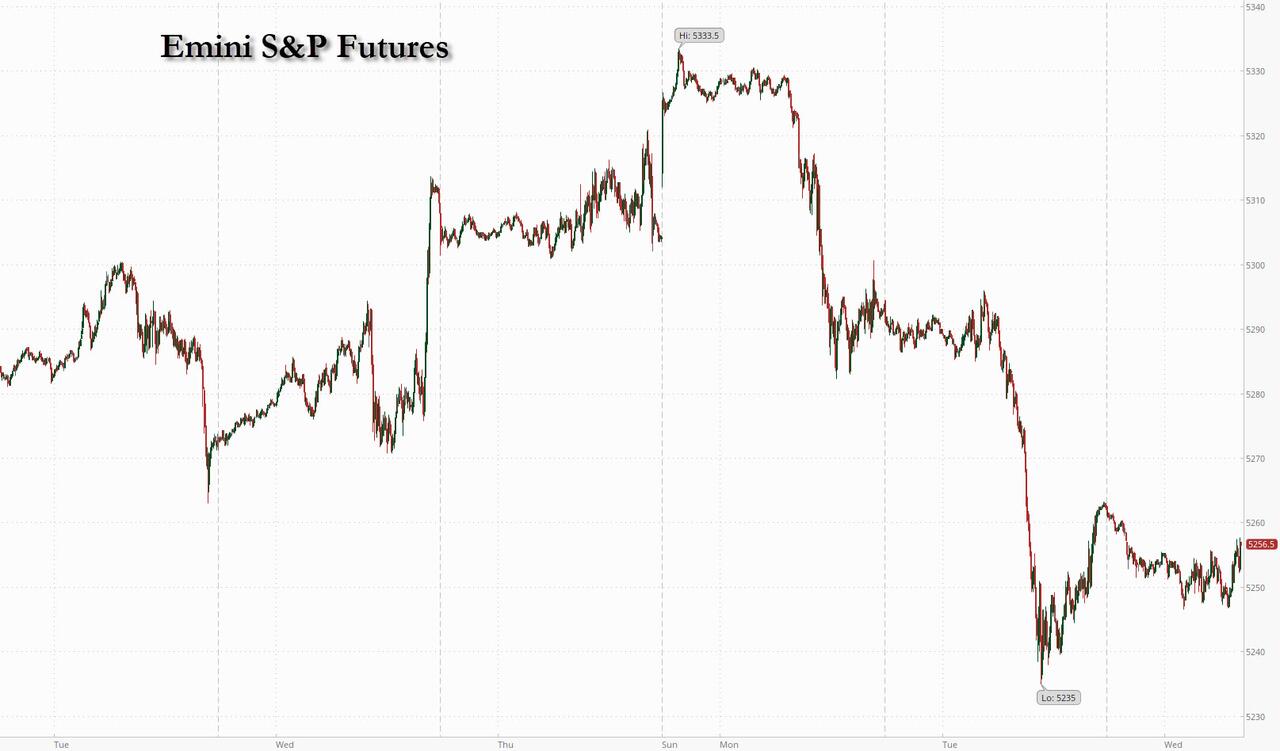
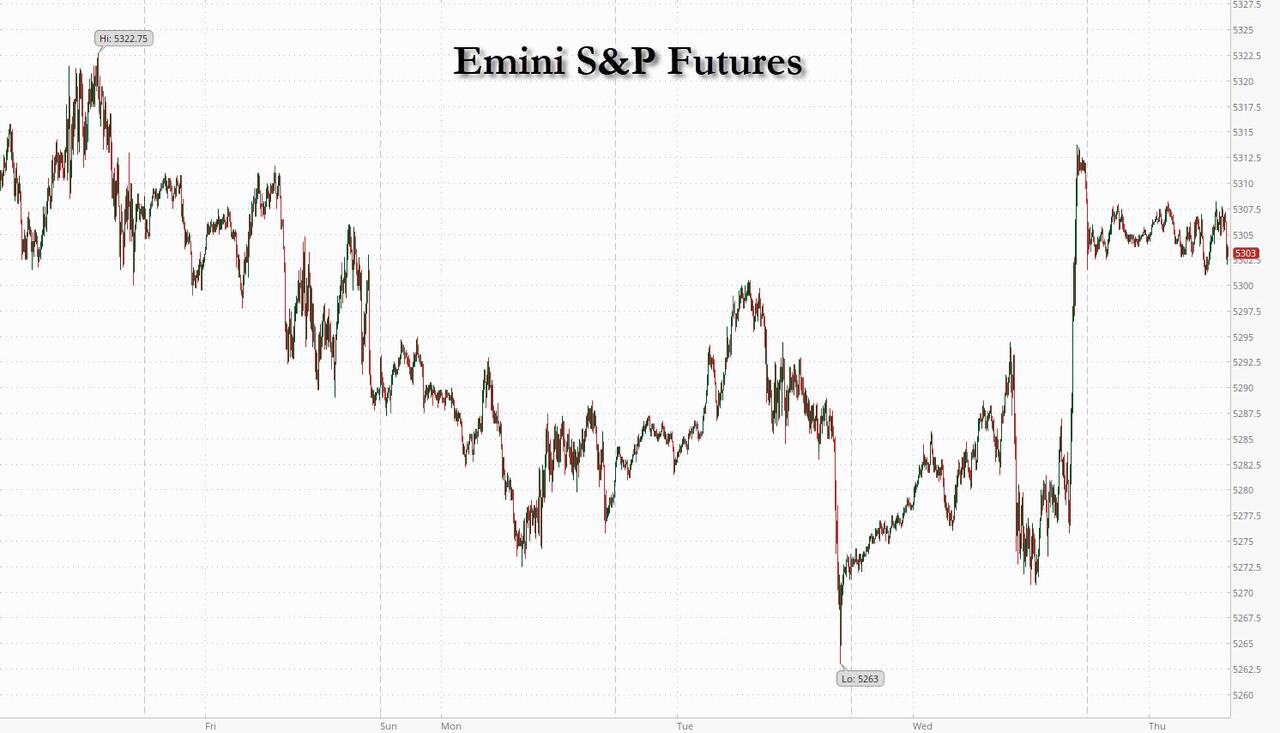
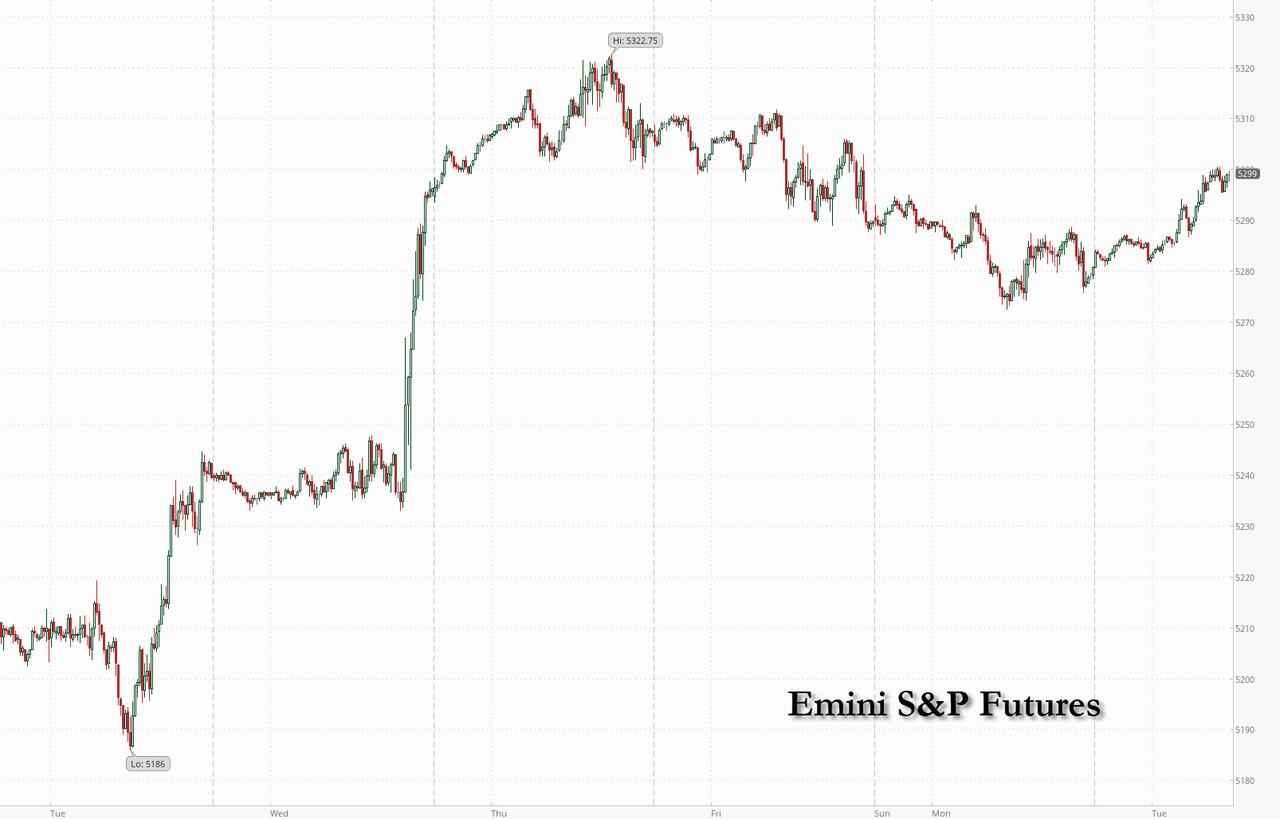
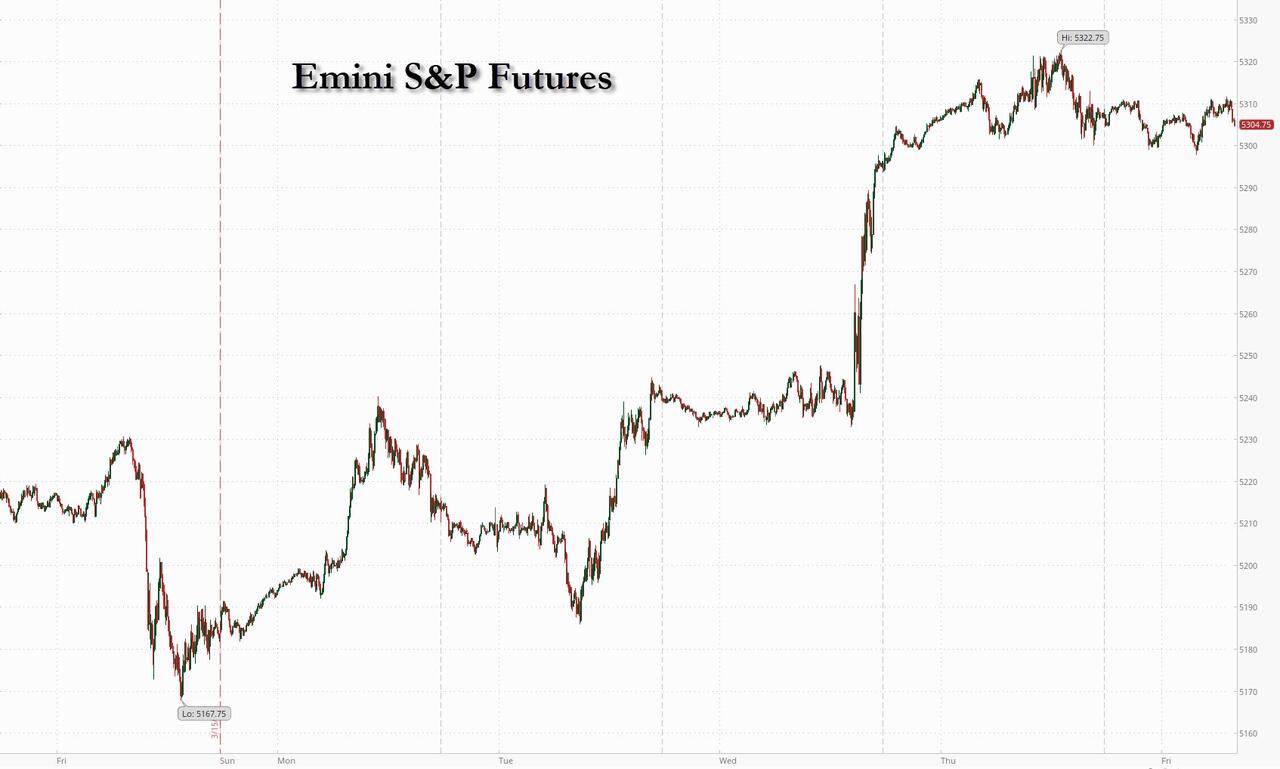
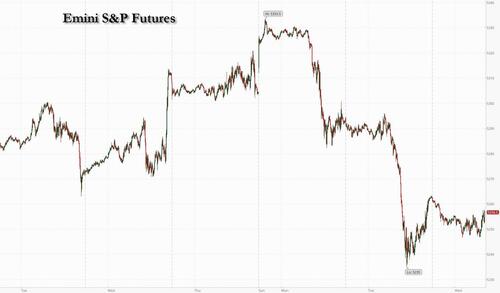
SPX futures back-tested the trading channel trendline at 5220.00, but failed to overcome it.  Futures are lower but have not declined beneath short-term support at 5189.00.  SPX made its all-time high on March 28 (day 245) and has not challenged that level since then.  Intermediate support lies at 5126.28 and may provide support for a bounce.

Today’s op-ex shows Max Pain at 5210.00.  Long gamma starts at 5225.00 while short gamma emerges beneath 5200.00.

ZeroHedge reports, “US futures are down small with Tech underperforming and small-caps flat, as rates held at 4 month highs, and Brent is about to rise above $90. As of 8:00am, both S&P and Nasdaq futures are down -0.2%, with yields higher pre-market ahead of Powell’s 12.10pm ET speech; despite his dovish rhetoric at the Mar 20 Fed Meeting press conference investors are nervous of a hawkish pivot according to JPM. This comes amid a surge a commodity prices and a spike in geopolitical tensions; pre-market all 3 commodity complexes are higher with gold the notable laggard despite USD being flat (although gold lagging these days means it hasn’t hit a new all time high in the past 15 minutes). Today’s macro focus is on ADP (has not been predictive of the brutally manipulated NFP print), ISM Services and 2x Fedspeakers, including Powell.”


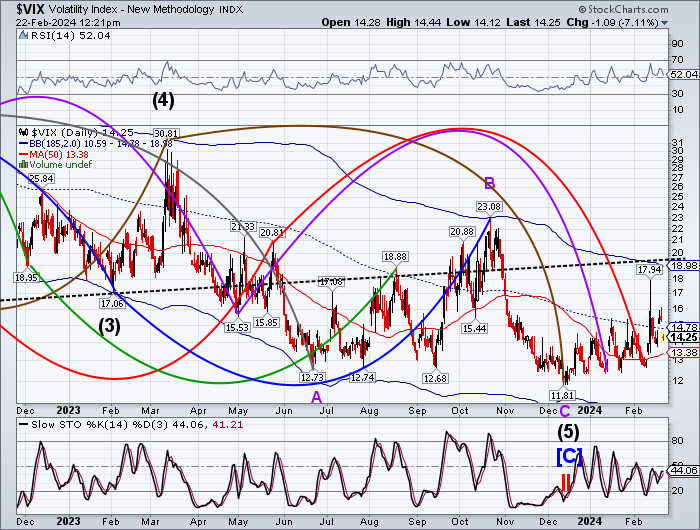
VIX futures appear to be consolidating above the mid-Cycle support at 14.70.  Trending strength is growing with a possible peak over the weekend and each successive weekend through the month of April.  This may not be a coincidence, as the Fed has been attempting to downplay and delay the reports of bank problems until the close on Friday.

Today’s op-ex shows Max Pain at 14.50-15.00.  Short gamma appears at 14.00, but long gamma begins at 16.00 shows strength at 23.00.

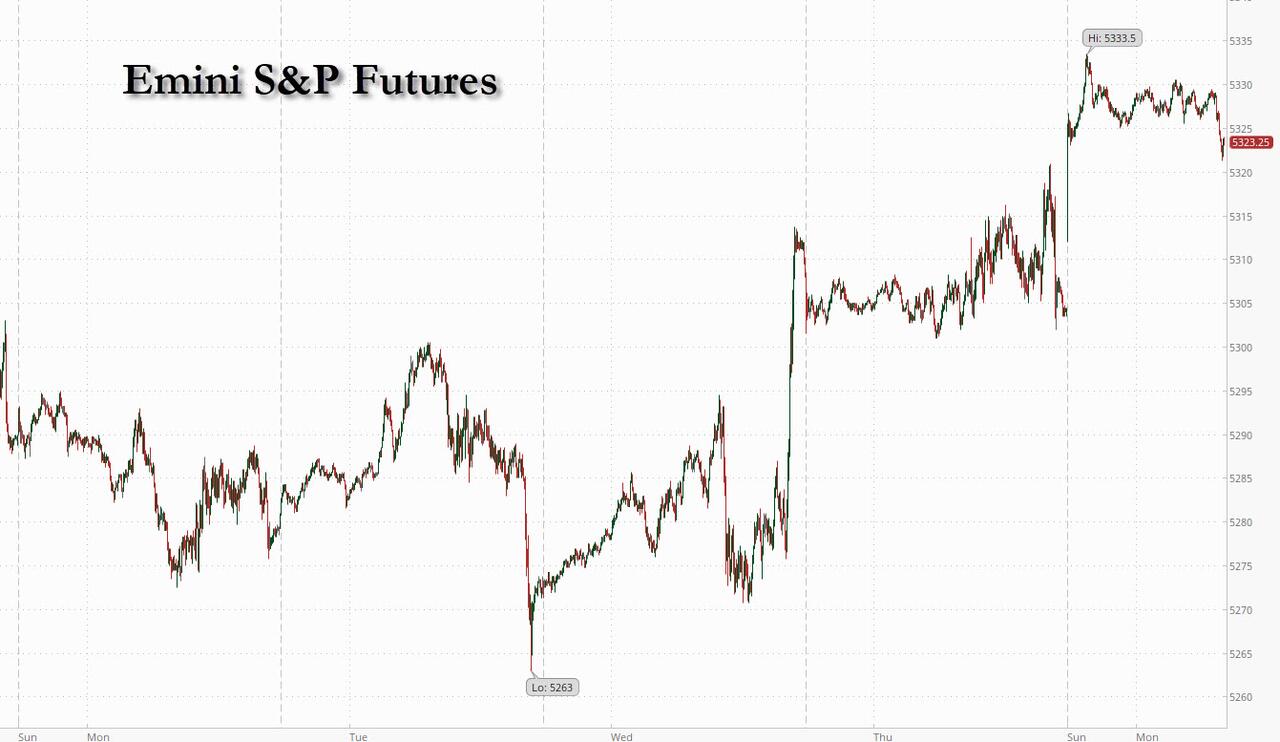
ZeroHedge notes, “5200 matters

This is where the lower part of the perfect Madoff channel comes in, as well as the 21 day moving average. 5200 is the make or break level.”

Source: Refinitiv


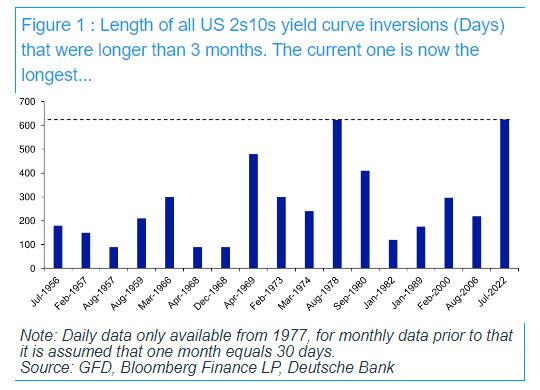
TNX continues to show strength as it advance above this year’s previous highs.  The rally may last another 2-3 weeks, according to the Cycles Model.

ZeroHedge remarks, “Positioning in US Treasuries is becoming less long as the risk of persistently higher yields increases from a cyclically strong US and global economy.

Leading data have been vindicated in projecting a US and global cyclical upturn that coincident data are now unequivocally confirming. Monday’s release of the March ISM showed the index is back into expansion territory, matching the message from the manufacturing PMI.

The US manufacturing ISM is not only the best cyclical barometer of US growth, it is also the best single gauge of global growth given the sector’s outsized importance to the world economy.”


USD futures appear to be consolidating after yesterday’s potential Master cycle high on day 259.  Should it take hold, the reversal may test the mid-Cycle support at 103.76.  Should support hold, USD may be considerably higher by the end of May.


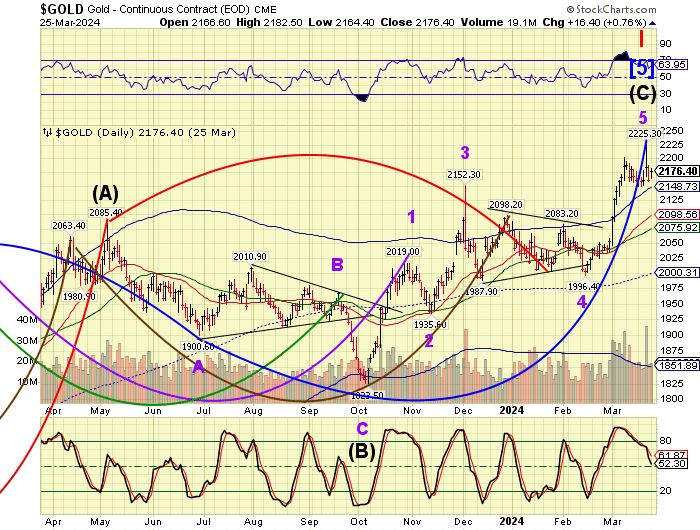
Gold futures have risen to a new all-time high at 2308.85 on day 247 of its master Cycle.  Vigilance should be the by word as gold may reverse at any time in the next week.  The decline may be greater than most would imagine.

ZeroHedge comments, “The rally in the gold price has left me non-plussed … who is behind it and why ? Rather like an Agatha Christie murder-mystery novel, with evidence thin, the culprit or cause may be deduced by excluding what it is not … and what remains, is.

Spoiler alert … I am really not sure of the answer, but follow me … it’s fun anyway. ”


Crude oil futures have advanced to a morning high at 86.08 as it continues its rally to the Cycle Top resistance at 90.44.  There may be approximately 3 weeks left in this rally, so it may be doable.  However, there may be a structural resistance near 86.60 that may impact the rally.  Given that information, it is likely that a pullback toward mid-Cycle support at 79.75 may be in order before pressing higher.

ZeroHedge remarks, “US crude futures pierced $85 for the first time since October, the latest milestone in a rally driven by OPEC+ production cuts, strong demand and heightened geopolitical risks.

As Bloomberg reports, oil has jumped this week as tensions rise in the Middle East, with Iran vowing revenge on Israel for an airstrike on its embassy in Syria that killed a top military commander.

After last week’s surprise crude build and big jump in stocks at the Cushing hub, traders were looking for a slowing build…”


Posted in Published | Comments Off on April 3, 2024

April 2, 2024

10:22 am

SPX has fallen beneath its Diagonal Trendline at 5220.00, giving a sell signal.  It has also challenged its Short-term support at 5189.00.   A further confirmation lies beneath Intermediate support at 5129.32.  Of critical concern is the 1987 trendline near 4900.00, beneath which lies the possibility of a greater decline.


8:15 am

Good Morning!

NDX futures have declined to 18132.60 thus far this morning as the uptrend weakens.  Critical support lies at the trendline and Intermediate support at 18019.69, beneath which lies a sell signal.  Further confirmation lies beneath the 50-day Moving Average at 17822.27.  Once the reversal is confirmed, the Cycles Model suggests a potential decline lasting until mid-May.  Of critical importance to the uptrend is the 1987 trendline which lies just beneath 14000.00.

Today’s options chain shows Maximum Investor Pain at 18275.00.  Long gamma may begin at 18300.00 while short gamma may proceed beneath 18250.00.

RealInvestmentAdvice comments, “During running bull markets, much commentary is written on why this time is different and why investors should not worry about market corrections. One such piece was written recently by Fisher Investments. To wit:

“After the S&P 500’s 26% return last year and this year’s strong start, many investors are worried – understandably – that this bull run is getting ahead of itself. “‘”


SPX futures have slipped beneath the Cycle Top support at 5231.00 for the first time since February when it also rose above the 1987 trendline.  This may justify an aggressive sell signal, although a trendline sell signal lies just beneath 5200.00 where SPX is closing in.    Intermediate support lies at 5120.97, giving further confirmation to the sell signal.  Confirmation of the larger uptrendlies at the 1987 trendline at 4900.00.

Today’s op-ex shows Max Pain at 5245.00.  Long gamma may begin at 5250.00 while short gamma may reside beneath 5225.00.

ZeroHedge reports, “US equity futures are sliding as bond yields spike to 4.36%, the highest level since November, and the price of Brent crude rises to a new five-month high above $89 driven mostly by supply/demand dynamics but a geopolitical fear premium over the brewing Israel-Iran conflict begins to build, and as fears that the Fed may not cut rates in June start to percolate. The rest of the commodities complex is also pushing higher with strength in metals notable as Ags come from sale and gold jumps right back to all time highs despite the recent strength in the dollar.  As of 7:50am, S&P and Nasdaq futures drop 0.4%, as health insurance stocks tumbled after regulators didn’t boost payments for private Medicare plans like the industry had come to expect; Mag7 names are mixed with Semis up small despite NVDA sliding. In Europe, most markets are mostly higher after reopening after the Easter holiday with only Spain in the red: energy, AI, and semis the best performing segments with additional support from banks, as regional curves bear steepen. The risk-on tone in APAC where HK showed significant outperformance. The yield curve is steeper, and the Bloomberg dollar index dropped. Bitcoin slumped after several sharp sell orders hit futures during Asian trading. Today’s macro data focus is on JOLTS and 3x Fedspeakers.”


VIX futures have risen to 14.54, giving a buy signal.  The Cycles Model suggest growing strength, especially on weekends through mid-May.  This may be due to authorities hiding bad news until the weekends, hoping that it will blow over by Monday.  The unusually low stretch of volatility may be about to end.

Tomorrow’s op-ex shows Max Pain at 14.00  Short gamma may reside at 13.00-13.50 while long gamma starts at 15.00 with outliers at 18.00 and 40.00.


TNX has broken above its February high, confirming the buy signal given last Thursday.  The Cycles Model suggests the rally may extend to the week of April 15.  A natural target may be the Cycle Top at 48.28…or higher.  Our lawmakers don’t know how to control their spending. 


Gold futurtes hit a nominal new high this morning at 2287.35 on day 246 of the current Master Cycle.  Gold may be in its final probe to all-time highs before a major correction.  Thus far there is no weakening of the uptrend.  Once the decline manifests, the nearest suport at which a signal may be given is the Cycle Top at 2167.62, approximately 5% beneath its current high.   Be aware that a change in trend may happen rather quickly.


Posted in Published | Comments Off on April 2, 2024

April 1, 2024

10:18 am

BKX may be reversing from its retracement high on Thursday.  It has declined beneath its Cycle Top support at 104.37 creating a possible aggressive sell signal on day 249 of the Master Cycle.  The Wave structure is complete, leaving numerous other indications of an early Master Cycle high.  Tell me if I am wrong, but I see no liquidity report on banks/moneymarkets for last week.


8:30 am

Good Morning!

NDX futures did not make a new high over the weekend, reaching 18392.60, leaving the Master Cycle high  on Thursday, March 21.  NDX has slipped beneath its Cycle Top resistance, leaving a potential aggressive sell signal.  The next support levels are Intermediate support and the Diagonal trendline at 18000.00, where the sell signal is confirmed.  The 50-day Moving Average is at 17794.74 where many traders sell/go short.  Last week ends the 18 out of 22 weekly closes at all-time highs.

Today’s options chain shows Maximum Investor Pain at 18275.00.  Long gamma may begin at 18300.00 while short gamma starts at 18250.00.


SPX futures continued making a new all-time high over the weekend, but have pulled back from the weekend surge to 5275.90.  There may be a pause near the ATH today.  However, should we see a reversal today the decline may gather strength very quickly.  The Diagonal trendline is at 5200.00 with a possible aggressive sell signal.  Confirmation lies beneath Intermediate support at 5114.58.

Today’s options chain shows Max Pain at 5245.00.  Long gamma begins at 5260.00 while short gamma may start at 5230.00.

ZeroHedge reports, “US futures extend their record-breaking meltup following the long weekend (which was to be expected with hedge funds piling into shorts last week, hoping for a reversal), with most European markets still closed and Asian stocks closing lower. As of 7:30am, S&P futures were 0.3% higher, but trading near session lows; Nasdaq futures gained 0.4%. Bond yields are 1-3bp higher with the USD unchanged from its Friday close. Commodities are mixed: oil down and metals are mostly higher this morning as China PMIs beat expectations. While bitcoin suffered one of its trademark futures slamdowns overnight to push it back below $70K despite relentless ETF inflows, gold was on a tear and rose 1.6% to hit a new all time high of $2,265 before easing back. after upbeat China factory data added to Friday’s relatively benign US core PCE figures. This week, keep an eye on Payrolls, ISMs, and Fedspeak (8x this week), and today, we get the Mfg ISM at 10am ET where consensus expects a 48.3 print vs. 47.8 prior.”


VIX futures may be testing the 50-day Moving Average at 13.78 this morning.  A close above it may offer a buy signal for the VIX.  The Cycles Model shows VIX trending higher, with strength appearing later this week.

Wednesday’s op-ex shows Max Pain at 14.00.  Short gamma begins and ends at 13.00, whils long gamma starts at 15.00 and strengthens to 18.00.


TNX is rising, and appears to be testing the mid-Cycle resistance at 42.59.  A breakout above that level confirms the uptrend and buy signal.  The Cycles Model suggests the rally may continue through mid-April with 4 of 6 indicators showing strength.  A possible target may be the Cycle Top resistance at 48.26.

Mish reports, “The BEA reports real income is down, but personal spending jumped anyway. Inflation data is mostly as expected, but much higher than the Fed would like to see.

Personal Income and Outlays, February 2024

Nothing about the BEA’s Personal Income and Outlays report for February 2024 suggests the Fed should cut interest rates at its next meeting.”


USD futures are consolidating today after Friday’s possible Master Cycle high.  If correct, the new Master Cycle may retest support at 103.70.  However, there may be up to a week left of the (old) Master Cycle.  A new high may still be in the making.


Gold futures made a new all-time high over the weekend at 2286.35, then pulled back.  We may be seeing a Master Cycle being completed, or nearly so.  Stand by for confirmation of a reversal.

ZeroHedge remarks, “Gold – on the run

Gold continues the brutal squeeze move. Note we are getting closer to the upper channel of the huge trend channel and RSI is reaching overbought levels.”


Posted in Published | Comments Off on April 1, 2024

March 28, 2024

10:15 am

BKX may be making its last stand on day 245 of the Master Cycle.  A possible reason for the Cycle high ending early may be “window dressing” where sectors may be made to look good for the quarter-end.  The Wave structure appears complete.  Thus far there have been no outright bank failures.  That may all end as the kicked can may be too damaged to withstand another nudge.

  • CRE vacancies and defaults are rising as major corporations are downsizing their real estate footprint.
  • The purchase of treasuries may decline as quarterly pension rebalancing is complete, which may cause yields to rise.
  • The Bank Term Funding Program (BTFP) has ended.  This may erode investor confidence in banks.
  • Bank profitability has eroded as yields have risen, causing savers to choose money markets with more competitive rates.


8:30 am

Good Morning!

SPX futures made a minimal advance overnight to 5251.60, on its way to5300.00.  Today is day 245 in the current Master Cycle, as the reversal door opens wider.  But first, the spike high must be made.  The Cycle Top support lies at 5209.86.  Beneath that lies an aggressive sell signal.  The Diagonal trendline and short-term support lie at 5170.00, confirming the sell signal.  Additional support lies at 5107.04, beneath which resides further confirmation of the sell signal.  Market tops are a process, not an event, unless a Key Reversal is made, breaking multiple supports.

Today’s options chain shows a close race with 5245 as Maximum Pain, with long gamma beginning at 5250.00 and shor gamma possibly beginning at 5240.00.

ZeroHedge reports, “Stock futures are pointing to a flat open on the last trading session of the week, month, and quarter, following a late-session spike that took the S&P 500 to yet another record as the much anticipated quarter-end pension dump (as big as $32BN according to Goldman failed to materialize, but may very well show up today). As of 7:45am ET, both Nasdaq and S&P futures were down 0.1% after Fed Governor Christopher Waller poured cold water on the path to lower interest rates, saying there’s no rush to cut rates given recent “disappointing” inflation figures.

The broadest equity index is set for a gain of 10% for the first three months of the year, with the Nasdaq 100 just short of a 9% rise. Europe’s Stoxx 600 benchmark also notched up another record as Arnaud Cayla, deputy CEO at Cholet Dupont Asset Management, said: “Investors have no reason to sell”, and sure enough, a look at either the weekly S&P candle chart which is up 19 of the past 22 weeks…”


VIX futures are consolidating inside yesterday’s trading range.  Should VIX make a new low today, it may be on day 280 of the Master Cycle, an unusually long duration.  However, other forces may be at work, extending the VIX Cycle.  The  50-day Moving Average is at 13.71 while the mid-Cycle support/;resistance lies at 14.72.  VIX has been ignored as a hedge for so long that it may take a rally above the February peak at 17.94 to wake up investors to looming danger.

Next Wednesday’s VIX ooptions expiration shows Maximum Investor Pain at 14.00., with very little short gamma.  Long gamma rises up at 15.00 and extends to 40.00.


TNX tested its 50-day Moving Average at 41.86, then rallied through the 200-day Moving Average at 42.22 toward the mid-Cycle resistance at 42.57, where a possible new confirmation of the buy signal lies. TNX appears to be at a Trading Cycle low and new strength to the upturn may come next week.  This rally has the capability of running strong through mid-April.

There may be an answer for why yesterday’s 7-year Note auction went so well.  In short, pension rebalancing may be the culprit.  It is a mechanical process and takes no heed to market conditions until something breaks…

ZeroHedge remarks, “We’ve been pointing it out for so long – in fact, for most of our 15 years in existence – that it has become more of a chore than actual reporting, especially since the “number only go up“, as it hits a new all time high virtually every day. We are talking, of course, about the exponential curve that is the US debt, arguably one of the most boring and at the same time, most exciting topics of all time (because one day the “number go up no more” and you want to be far, far away when that happens).

Perhaps the catchiest observation we made on the trajectory of US debt was last September when we first noted that it is rising by $1 trillion every three months, or every 100 or so days…”

ZeroHedge adds, “Crashing is maybe too strong of a word, but bond volatility continues coming off sharply. The MOVE closed at the lowest levels since early February 2022.”


USD futures consolidated overnight after yesterday’s surge.  At day 253-254, yesterday or today may give USD a Master Cycle high.  This suggests a possible decline into mid-May.  A possible target may be the Cycle Bottom at 100.41.


Posted in Published | Comments Off on March 28, 2024

March 26, 2024

12:53 pm

SPX is advancing slowly from its pullback, but the Wave Structure requires one final push higher.  The likely target may be 5300.00.  Some analysts are anticipating a blow-off top, but the trend channel is straight and narrow, suggesting that the trend channel is likely to be obeyed.  The shadow banking system, which has funded this rally is not eager to start another speculation binge.  There is no reason to sell.  However, a 10-year yield above 43.50 may dampen the animal spirits.  The trading channel trendline has risen to 5163.00.

ZeroHedge comments, “Stock market optimism is at full throttle after central banks’ rate-cut reassurances, leaving investors with no reason to sell and bears with little to do but await catalysts that might derail this rally.

The Federal Reserve’s signal that three interest-rate cuts are still on the cards for this year has just propelled Europe’s Stoxx 600 index to its ninth straight week of gains, the longest winning streak in 12 years. While the Stoxx and its blue-chip counterpart the Euro Stoxx 50 may look a tad overbought, there is no real sign of the excesses that would trigger technical red flags.”


8:25 The Feast of the Annunciation moved to April 8

Good Morning!

NDX futures have risen to a morning high of 18327.20 as it makes a final probe into its all-time high.  The anticipate high may be near 18500.00.  Today is day 243 in the current Master Cycle, which means the turn window has opened, leaving two weeks to the anticipated turn date.  Note that, at 258 days, the turn date is an average with reversals occurring about two weeks plus or minus that date. Intermediate support is at 17961.82, parallel to the Ending Diagonal trendline.  A sell signal may be obtained beneath that level.

Today’s option chain shows Maximum Investor Pain at 18290.00.  Long gamma may begin at 18300.00 while short gamma resides beneath 18250.00.

ZeroHedge observes, “Economists and strategists tend to look at everything through the lens of interest rates, as if these are all important in explaining market conditions. But if we look at this year’s shift in money markets, we’ve seen a significant recalibration of expectations, from seven to three Fed cuts, while stock indices hit one all-time high after another and credit spreads continue to tighten.

It suggests that central bank policy may not be the primary force at play. Instead, if it’s collective risk appetite that drives liquidity, market movements are largely independent of central bank action. The concept of endogenous money creation explains how, arguing that the (shadow) banking system itself influences the money supply through lending and borrowing.”


SPX futures have risen to a morning high at 5241.90 as SPX makes its final probe to its all-time high.  The anticipated target for this final move may be 5300.00 over the next few days.  However, the Cycle Model suggests that there may be another two weeks left in the current Master Cycle.  The Ending Diagonal trendline is near 5150.00 while Intermediate support lies at 5092.00.  A decline beneath either may constitute an aggressive sell signal.

Today’s options chain reveals Max Pain at 5230.00.  Long gamma may begin at 5250.00 while short gamma is likely beneath 5200.00.

ZeroHedge reports, “It’s as if Monday’s modest dip never happened: S&P futures are trading are higher, surpassing Monday’s highs, with both Tech and small-caps outperforming, as investors keep a close eye on any potential market impact from the collapse of a major commuter bridge in Baltimore after it was rammed by a container ship. As of 8:00am ET, S&P futures were 0.4% higher, erasing Monday’s 0.3% drop, while Nasdaq futures gained 0.5%. Europe’s Estoxx 50 is similar, trading at multiyear high with utilities and financials outperforming. According to a JPM morning note, it is unclear if yesterday’s moves were tied to month-end/quarter-end rebalancing but generally those flows occur before the last day of the period. USD weakness continues as the yen just refused to drop no matter what; commodity performance is mixed with gold approaching ATHs and oil trading at a 5 month high. Today’s macro data calendar is busy with focus on Durable/Cap Goods, Home price indices, Consumer Confidence, and regional activity indicators (Dallas, Philly, and Richmond); we also get a $67BN 5Y bond auction; let’s see if it goes as smoothly as yesterday’s 2Y auction.”


VIX futures declined to 13.05 this morning.  The Wave structure indicates that VIX may make one further decline beneath the 12.40 low.  Should VIX make a new low tomorrow, it will have stretched its Master Cycle to an unusually long 279 days.

Tomorrow’s options chain shows Max Pain at 14.00  Short gamma lies at 13.50 while long gamma begins at 14.50.

ZeroHedge remarks, “The VIX reset

Zoom out and you see that VIX has spent a lot of time in the 12-16 range over the past 15 years. We saw low teens VIX, and even sub 10, during parts of 2017. VIX around 12 isn’t far from the “natural” floor, but we can stay low for extended periods of time.”

Source: Refinitiv


TNX may have bounced off Intermediate support at 42.32 this morning as it continues upward until mid-April.  A potential target may be the Cycle Top at 48.27.

ZeroHedge observes, “Greater inflation expectations and receding recession risk leave the interest rate cuts priced in for the Federal Reserve more vulnerable than in the UK or Europe.

The market currently sees a similar amount of rate cuts in 2024 for the US, UK and euro area, with ~80 bps seen for the Fed and BOE and just over 90 bps expected for the ECB. The US is more exposed to rising inflation, which is beginning to be reflected in the market’s expectations. The CPI-fixing market has started marking up its estimates of where inflation is anticipated to be over the next 12 months after a protracted period of marking them down.”


Gold futures are consolidating between 2168.00 ans 2200.00 after making a spike high on March 21.  That high may be the limit for the rest of this year and possibly longer, since the last 25 years of rally are due to be retraced, at least in part.  Initial estimates of the decline suggest the first possible support may come in near 1800.00.


Posted in Published | Comments Off on March 26, 2024

MARCH 25, 2024

10:26 am

The Ag Index is at a critical juncture.  It has declined beneath the neckline of a Head & Shoulders formation, leaving it susceptible to a further sell-off.  There may be two weeks left in the current Master Cycle.  However, if it cannot lift above the neckline at 385.00 or the mid-Cycle resistance at 3393.47, it may result in a panic decline in the second half of April.  China has curtailed the purchase of agricultural goods from the US in 2023 and may purchase even less in 2024.

Reuters reports, ” U.S. exports of agricultural and related products reached a value of $191 billion in 2023, down 10% from 2022’s record as both commodity prices and shipment volumes declined.

That marks a three-year low though is similar to the 2021 levels, and it reflects competition from key suppliers, particularly when it comes to satisfying Chinese demand.
Data published by the U.S. Census Bureau on Wednesday shows exports of bulk commodities, which include top-grossing items like soybeans, corn, wheat and cotton, hit a 10-year low by volume in 2023. That volume was down 17% from 2022, the largest year-on-year tumble since 1985.


10:14 am

BKX has pulled back from its Cycle Top at 102.31.  It may show a weakening of its trend beneath the Cycle Top, but May not offer a sell signal until it declines beneath its trendline at 100.00.  The Cycles Model allows two more weeks of rally, but the Wave structure indicates possible completion, or nearly so.  There is a potential for a panic decline in the second half of April.

ZeroHedge remarks, “With The Fed’s bank bailout facility now expired, the 12-month term loans are starting to mature and the fund dropped over $17.2BN last week…

Source: Bloomberg

Money-market funds saw a big outflows of almost $62BN, which we wonder if related to tax-year liquidity issues, but it is a little early in the year…”


8:15 am

Good Morning!

SPX futures have declines to 5213.80, remaining above the Cycle Top support at 5178.81.  It is on a buy signal until further notice.  We may see a rise in volatility in the meantime.  An aggressive sell signal may occur beneath the Ending Diagonal trendline near 5150.00.  The Cycles Model gives this uptick another two weeks, coinciding with the solar eclipse due on April 8.  That may not be a coincidence, as Cycles govern everything, including the planets.

Today’s options chain shows Maximum investor pain at 5235.00-5240.00.  Long gamma may begin at 5250.00.  Short gamma begins at 5200.00.

ZeroHedge reports, “Futs are lower following the S&P’s best weekly performance of the year (sparked by dovish comments by Fed chair Powell during the last FOMC) which sent the market up +2.3%. At 7:50am, S&P futures were 0.4% lower and Nasdaq futures dropped 0.6%, dragged by MegaCap tech names which were mostly lower with AMD and Intel down more than 2% after the FT reported they are being banned from Chinese government computers; NVDA swung from gains to losses after a report that Google, Intel and QCOM execs plan on battling NVDA on AI dominance (well what else can they do?). Meanwhile, JPM says to keep an eye on NFLX on bullish headlines; stock is +29% YTD which would be third among Mag7 names. Europe’s Stoxx Europe 600 dipped following nine straight weeks of gains, the longest run in 12 years. Elsewhere, treasury yields ticked higher and the Bloomberg dollar spot index was slightly lower with the yen a tad stronger after some aggressive jawboning by cartoonish Japanese officials. Oil gained on escalating geopolitical unrest following the Moscow concert hall attack on Friday that killed at least 137 people. The next 2 weeks have a lighter macro data calendar so keep an eye on Fedspeak (3x this week) and bond auctions for bond yield catalysts which could Equity sector performance. Month-end/Quarter-end rebalancing could also pressure stocks.”


VIX futures have climbed to 13.67 this morning, shy of the 50-day Moving Average at 13.81.  Last Thursday may have seen the end of the Master Cycle at 12.40.  A buy signal may be given as VIX rises above 13.81 with additional confirmation above the mid-Cycle support/resistance at 14.73.  There is a slight chance of a probe beneath 12.40 in the next couple of days.  Otherwise, we may see VIX rising even as SPX puts in its final high over hte next two weeks.

Wednesday’s op-ex shows Max Pain at 14.00 with a small contingent of shorts at 13.50.  Long gamma starts at 14.50 and may extend to 30.00.

ZeroHedge exclaims, “Who’s dead?

Intra day volatility is dead, baby.”

Source: GS


TNX is rising from a low on Friday at 42.20 and has surpassed the Intermediate resistance at 42.26.  It is on a buy signal which may have added confirmation above the mid-Cycle resistance at 42.52.  The Cycles Model calls for rising rates to continue to mid-April.  Trending strength may have begun and further boosts in strength may appear in early April.  The Cycle Top at 48.28 may be a likely target.


USD futures declined to test Intermediate support at 103.76 this morning.  A Master Cycle low may be expected next week near 102.00.  The USD is in a secular bull market that may extend through the summer of 2024.


Posted in Published | Comments Off on MARCH 25, 2024

March 22, 2024

1052 am

BKX is making new retracement highs beyond the 61.8% level.  The Cycles Model suggests we may see BKX going sideways or higher for another 2 weeks, while the Wave pattern appears complete.

ZeroHedge observes, ” At the start of the week, a lawyer specializing in advisory services for lenders and servicers of commercial mortgage-backed securities (CMBS) in the United States told us that the office segment of the commercial real estate market has been surprisingly quiet in the first quarter, despite the countless news headlines about towers being dumped on the market for hefty discounts.

The reason for this recent calm in the CRE space might be explained in a note by Vinay Viswanathan of Goldman Sachs on Tuesday.

Viswanathan explained that the total amount of outstanding commercial mortgages set to mature by year-end has exploded from $658 billion at the start of last year to $929 billion in mid-March. ”


9:20 AM

Good Morning!

SPX opened mildly positive, then gave up its gains.  The Cycles Model suggests another two weeks of possible gains in the SPX.  However, the Wave pattern suggests the end may be sooner.

Today’s options chain shows Maximum investor pain at 5230.00.  Long gamma may start at 5340.00, intensifying at 5250.00.  Short gamma may begin beneath 5200.00.

ZeroHedge reports, “Futures dropped modestly but were still on pace for their best week of the year after a raft of central bank meetings indicated that a pivot toward looser policy has been agreed upon at one of the recent central bank conclaves at the BIS tower in Basel, inflation – and 2% inflation target – be damned. As of 7:50am, S&P futures were down 0.2% and poised for a 2.2% weekly advance, the most since mid December; Nasdaq futures were also in the red as they looked to cap another blockbuster week. Friday’s selling came after the latest EPFR data revealed US stocks saw significant outflows in the runup to the Fed’s policy meeting that took the S&P 500 Index to fresh all-time highs. Market euphoria also pushed the MSCI index of global shares more than 2% higher this week so far. Europe’s stock benchmark headed for its longest weekly run of gains in more than a decade. Treasuries rose for a fourth day, taking the 10-year yield almost 10 basis points lower since Monday even as the dollar rose to the highest level in over a month. Gold dipped again after hitting a record high above $2,200 after Powell’s dovish FOMC. There are no scheduled events on the econ calendar; the US session highlight is Powell’s opening remarks at a Fed Listens event in Washington. ”


VIX appears to have made its Master Cycle low at 12.40 yesterday.  It is hovering in the 12.80’s today and may make one more attempt at a lower low.  One potential warning of a trend reversal is when the VIX begins rising while the SPX ventures higher.  It may be wise to add protection to one’s portfolio while prices are low.

Wednesday’s op-ex shows Max Pain at 14.00.  There is a single block of puts at 13.50.  Otherwise the options chain is positive with calls dominating the 16.00 – 20.00 range.


TNX dropped to 42.00 this morning thus far.  It may test the 50-day Moving Average at 41.69 before resuming its run to higher highs.   The Cycles Model suggests that yields may rise with more strength by the end of March.

ZeroHedge remarks, “Today is a historic day, as last night – DB’s Jim Reid reminds us – we quietly passed the longest continuous US 2s10s inversion in history. After the 2s10s first inverted at the end of March 2022, it has now been continuously inverted for 625 days since July 5th 2022. That exceeds the 624 day inversion from August 1978, which previously held the record.

As regular readers are aware, an inverted yield curve has been the best predictor of a US downturn of any variable through history: the yield curve has always inverted before all of the last 10 US recessions, with a lag that is usually 12-18 months, but some cycles – certainly this one – take longer…. much longer.”


Posted in Published | Comments Off on March 22, 2024

February 22, 2024

11:55 am

SPX made a new all-time high this morning, yet NDX has not yet attained a new high.  All of this excitement over one company…We’re looking over the edge, but being pulled back at the last moment.  The NDX is especially vulnerable, as Nvidia and Meta accounted for 70% of this year’s gains.  Today is day 251 in the current Master Cycle, leaving a week to finish off this probe higher.  Positioning is stretched, but no one seems to care.

ZeroHedge reports, “US equity futures blasted higher, and were set to push US the S&P500 to a new all time high when markets open for trading, matching record highs hit earlier in the session for both Japanese stocks…

… and European bourses…

… boosted by blowout earnings by Nvidia which surged in early trading after delivering another eye-popping sales forecast  – it really was the $2BN delta between NVDA’s $24BN revenue forecast for the current quarter and the $21.9BN consensus estimate – that added fresh momentum to a stock rally that already made it the world’s most valuable chipmaker and fanned gains in tech stocks – and really all stocks – around the world. ”


VIX pulled back beneath the mid-Cycle support at 14.78, but maintaining an upward bias.  VIX has two more weeks to go in its current Master Cycle.  A lot may happen in two weeks.


TNX is probing higher, being largely ignored while speculators gorge on their Nvidia gains.  More strength fo the rally in yields is in store for the next two weeks.


Posted in Published | Comments Off on February 22, 2024