June 5, 2023

8:00 am

Good Morning!

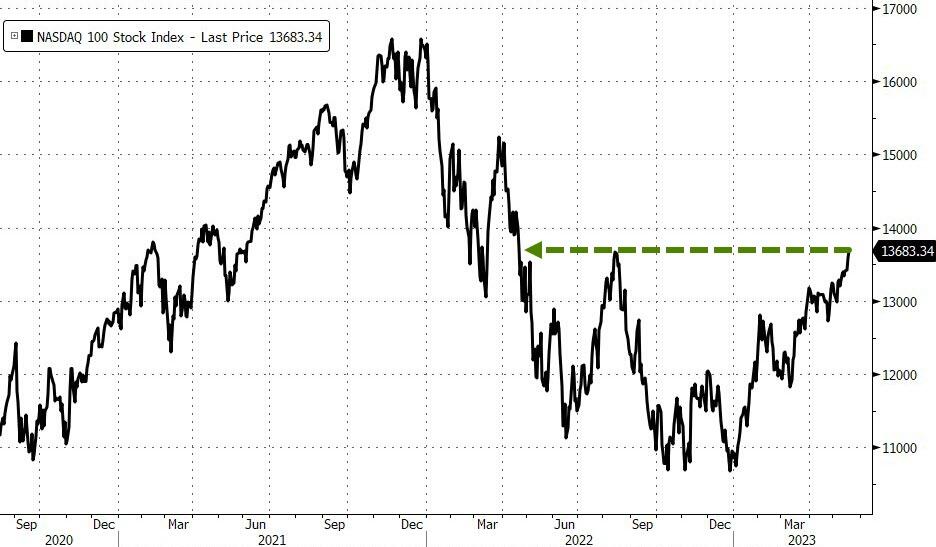
A weekly chart serves us best at this juncture.  The reason is that NDX just rose to the 61.8% Fibonacci retracements level (14324.71) of the 2022 decline on May 26.  To that extent, it has met a common retracement level for a Primary Wave [2].  In addition, on Wednesday it will have complete 18.5 months since its November 22, 2021 high on Wednesday.

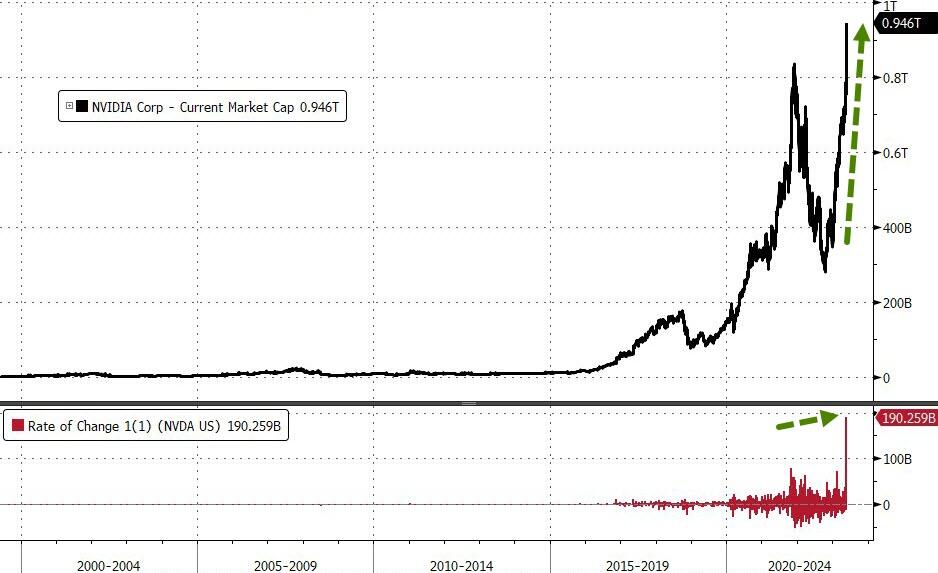
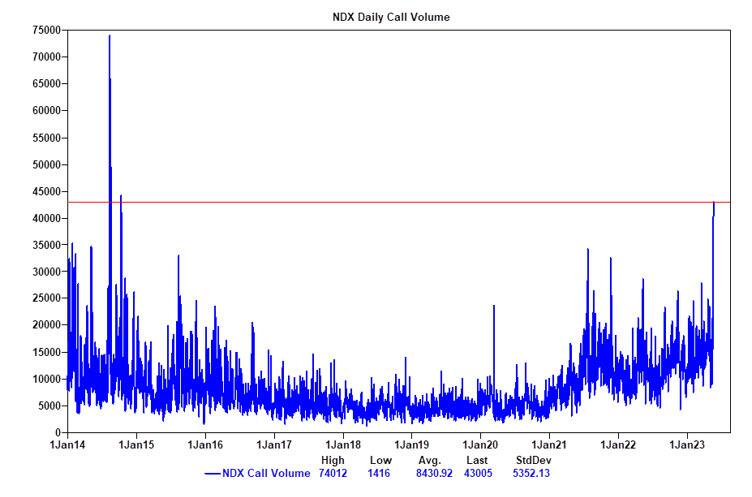
NDX futures are lower this morning, but within Friday’s trading range.  Having met its 61.8% retracement level, it may simply go higher until the Cycle is complete later this week.  NDX is in throw-over, due to a very small number of AI “generals.”

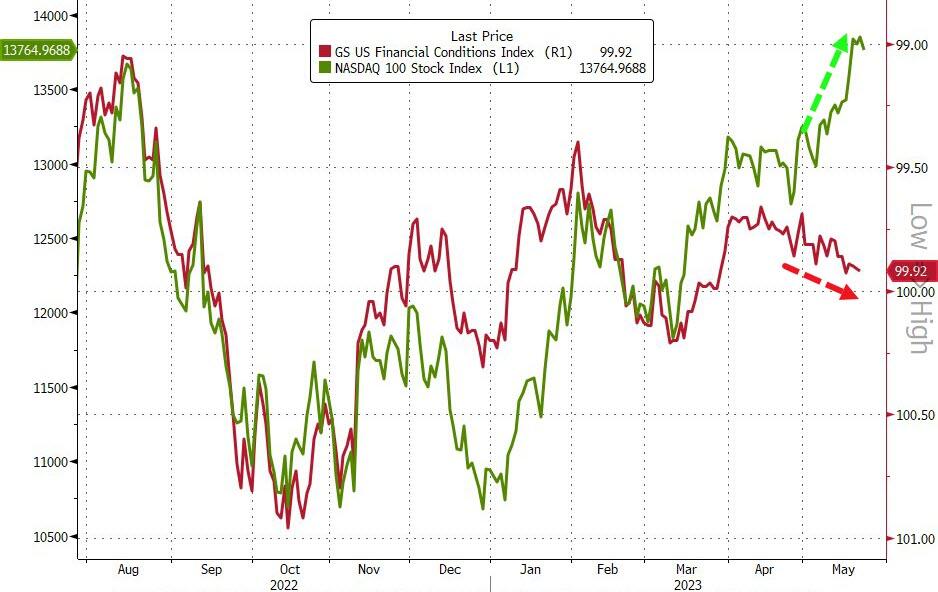
ZeroHedge remarks, “Extremely narrow breadth has historically led to further index upside.

As discussed in my previous post, it is not inconceivable (but still unlikely) that the recent zeal for AI could avert a US recession.

Whether it does or not is really moot as an investor, what’s important is asset performance.

And on that basis, the AI rally is on more solid ground.

In short, narrow leadership often creates its own reality and ends up dragging the rest of the market along with it.

That’s may happen this time too.”


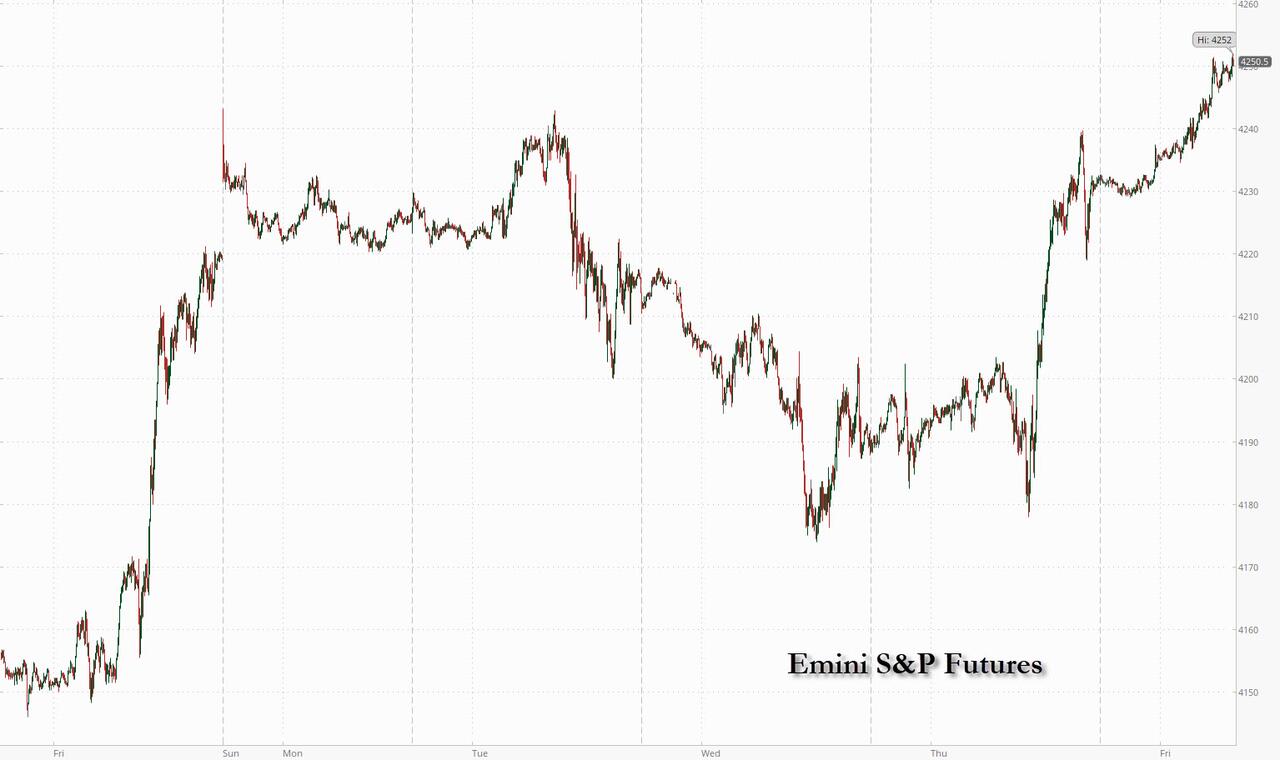
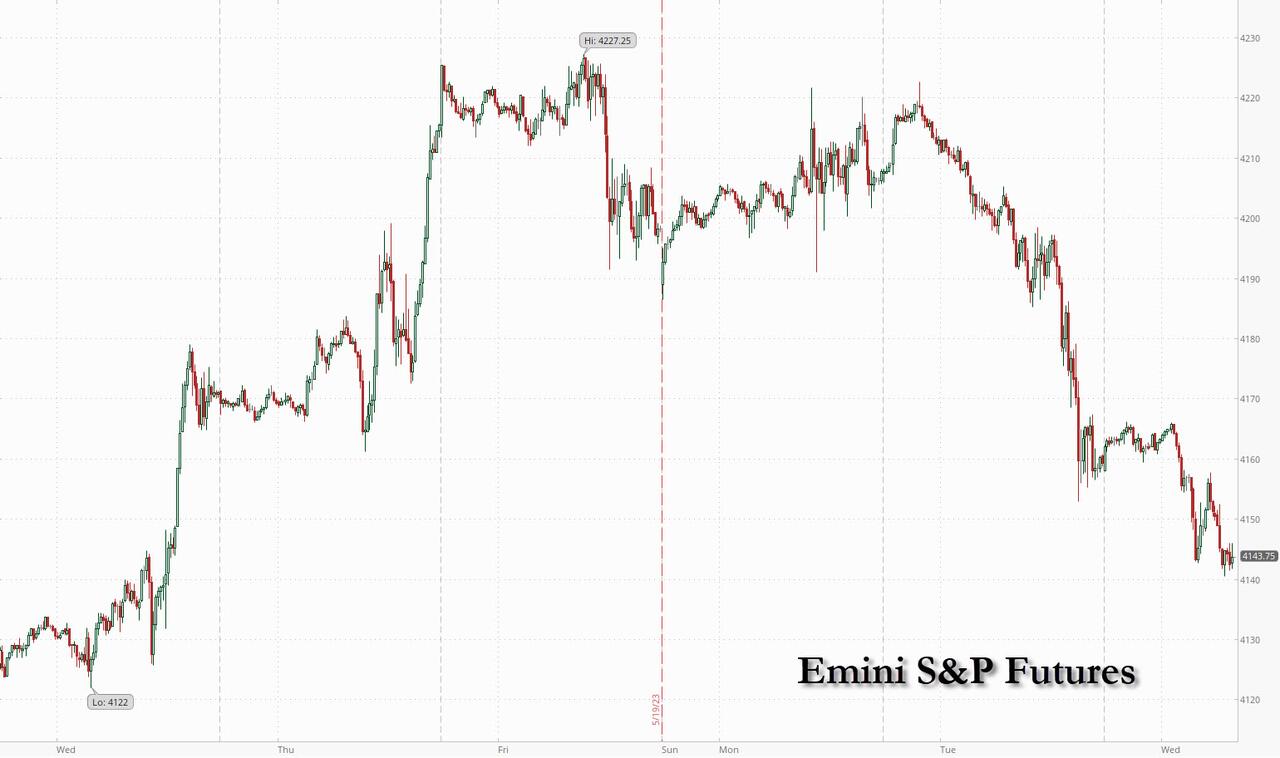
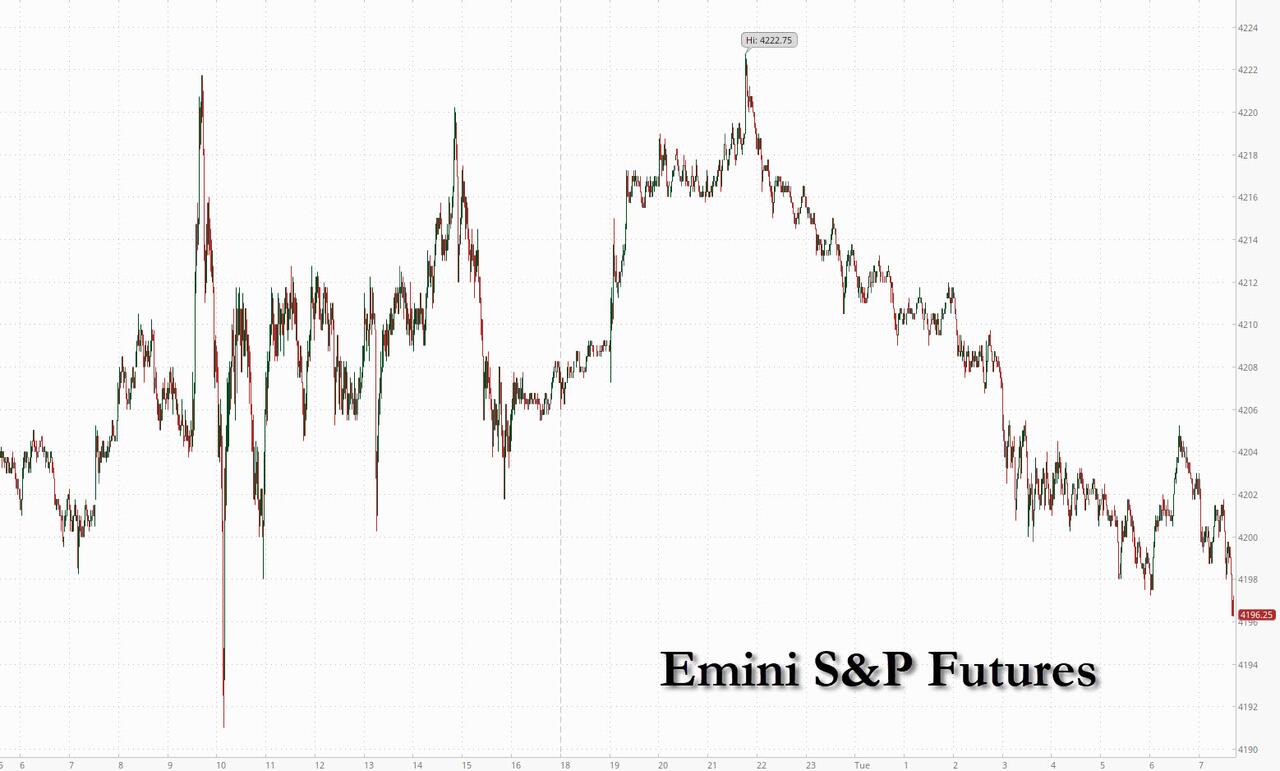
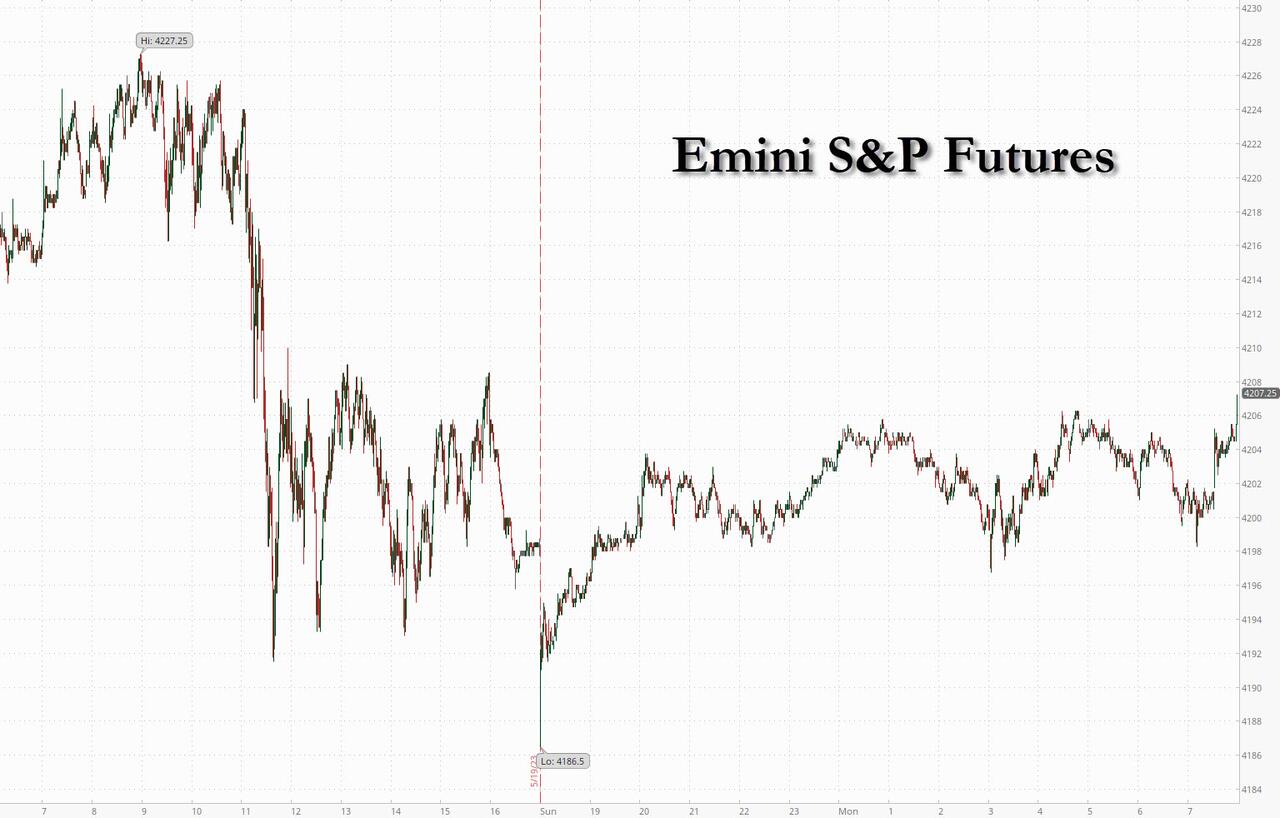
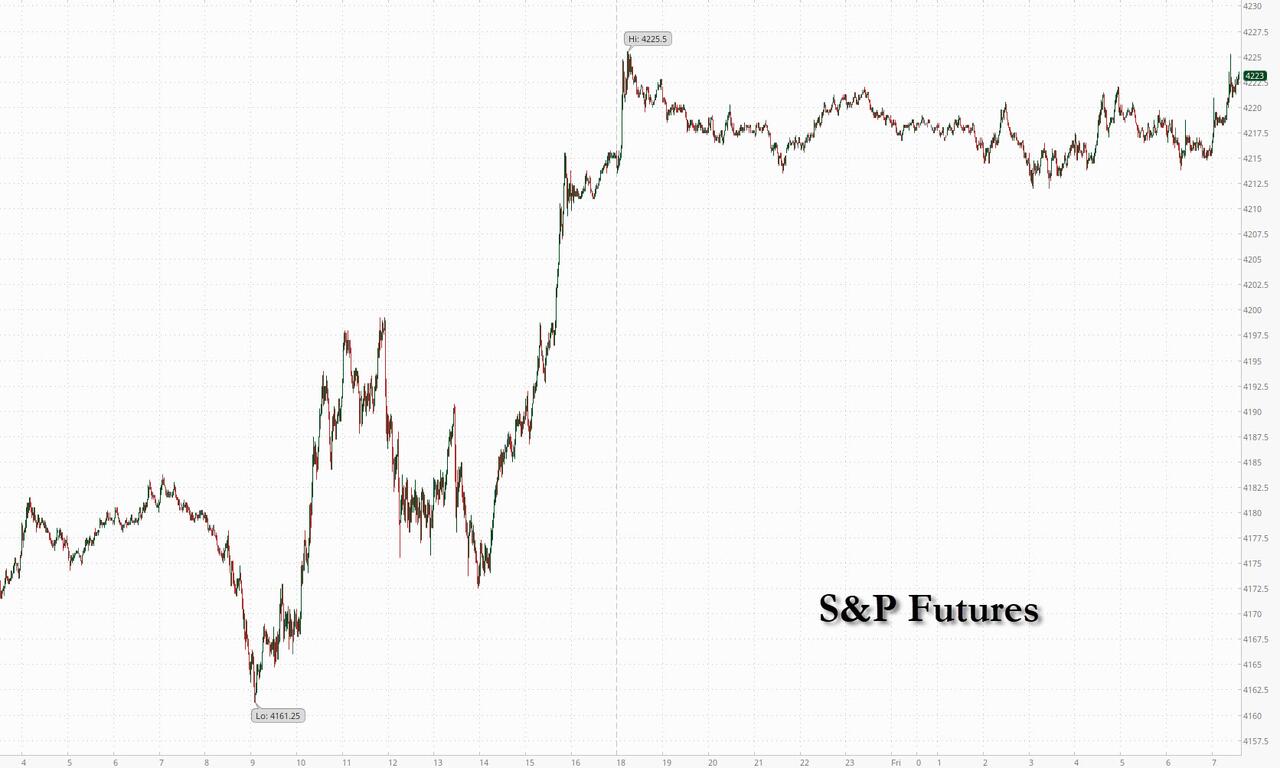
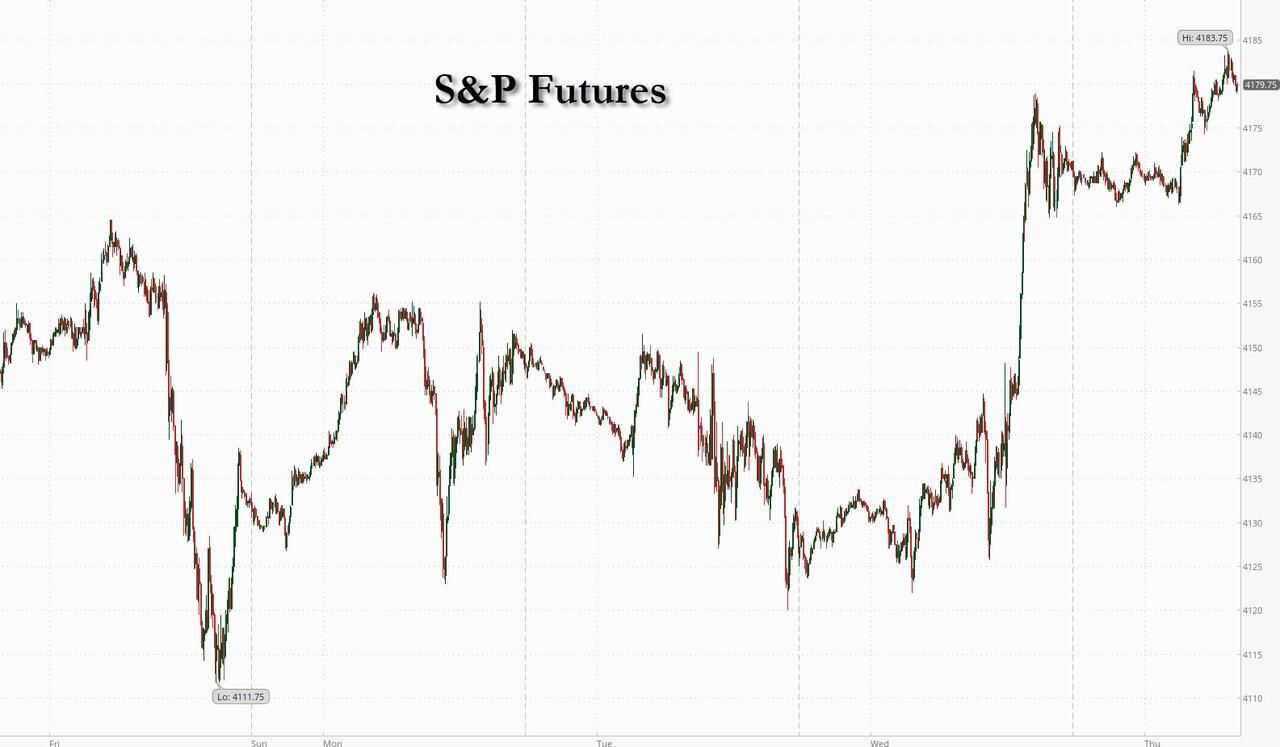
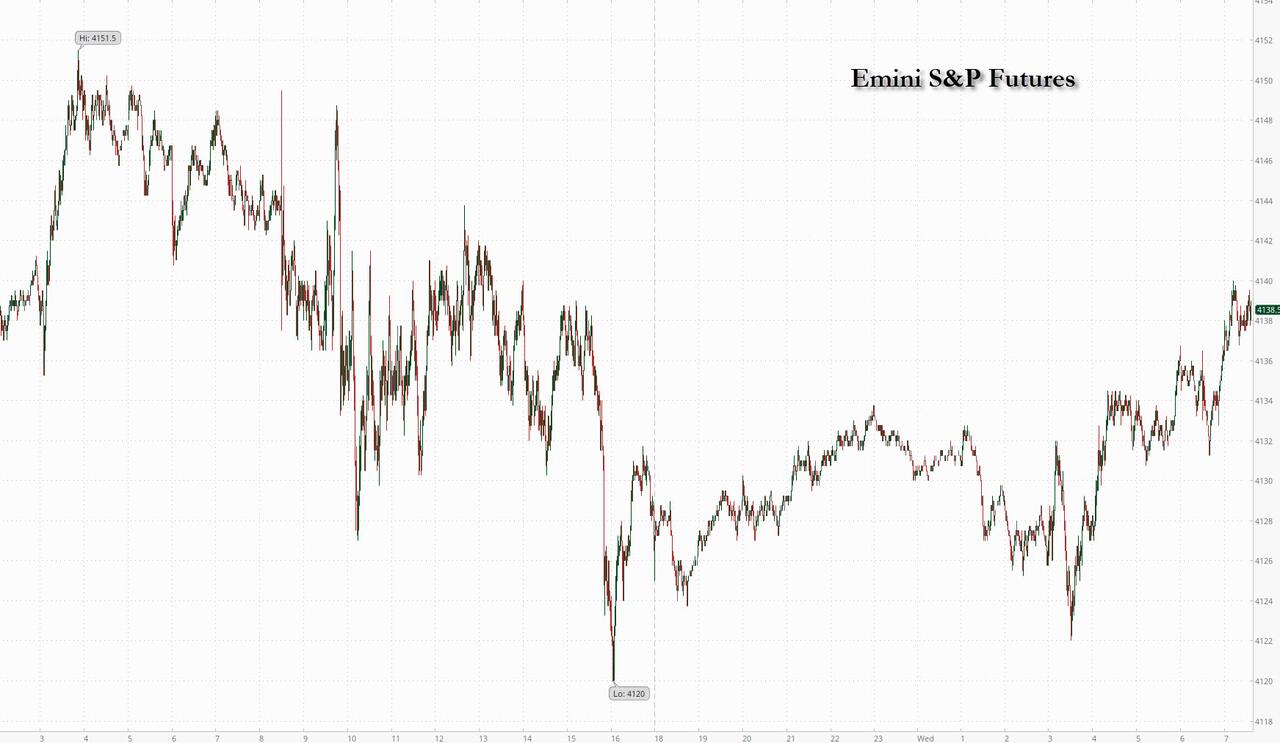
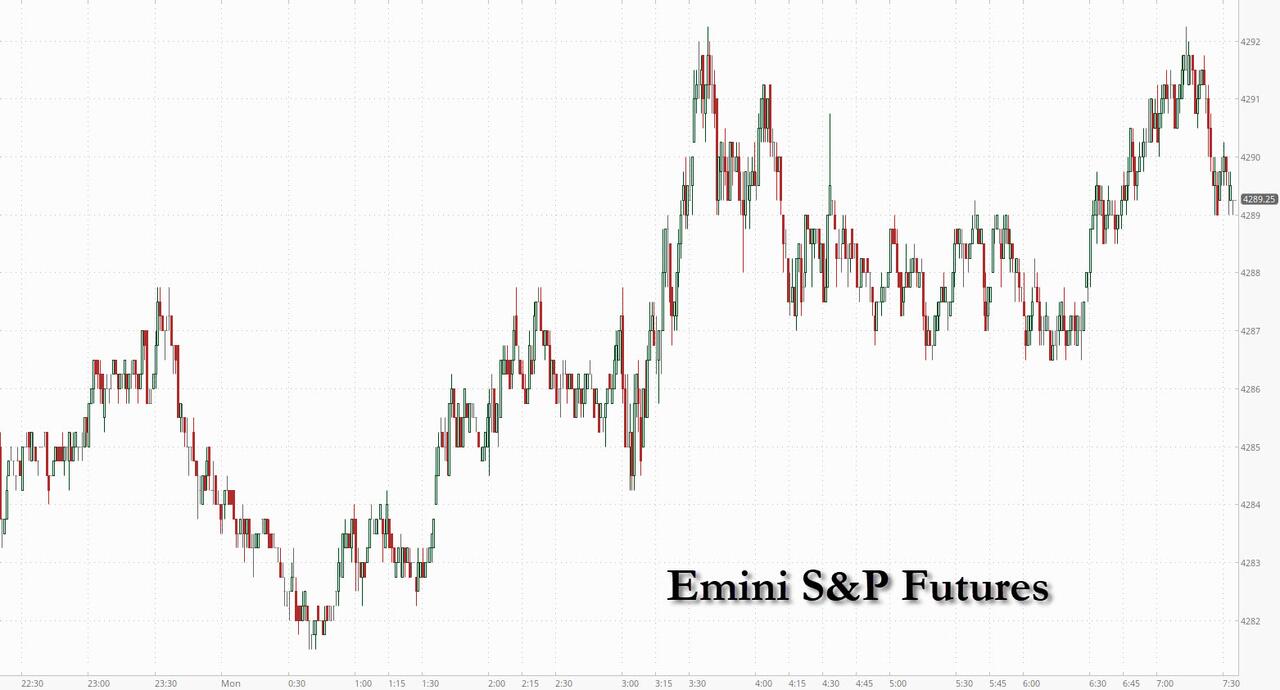
SPX futures are flat this morning.  The 17.2-month Cycle from January 4, 2022 may complete by Friday.  The 61.8% Fibonacci retracement level is at 4311.00.  A reversal from the cycle Top at 4280.00 may produce an aggressive sell signal.  Confirmation of a sell signal lies at Intermediate-term support at 4147.43 or the 50-day Moving Average at 4121.67.

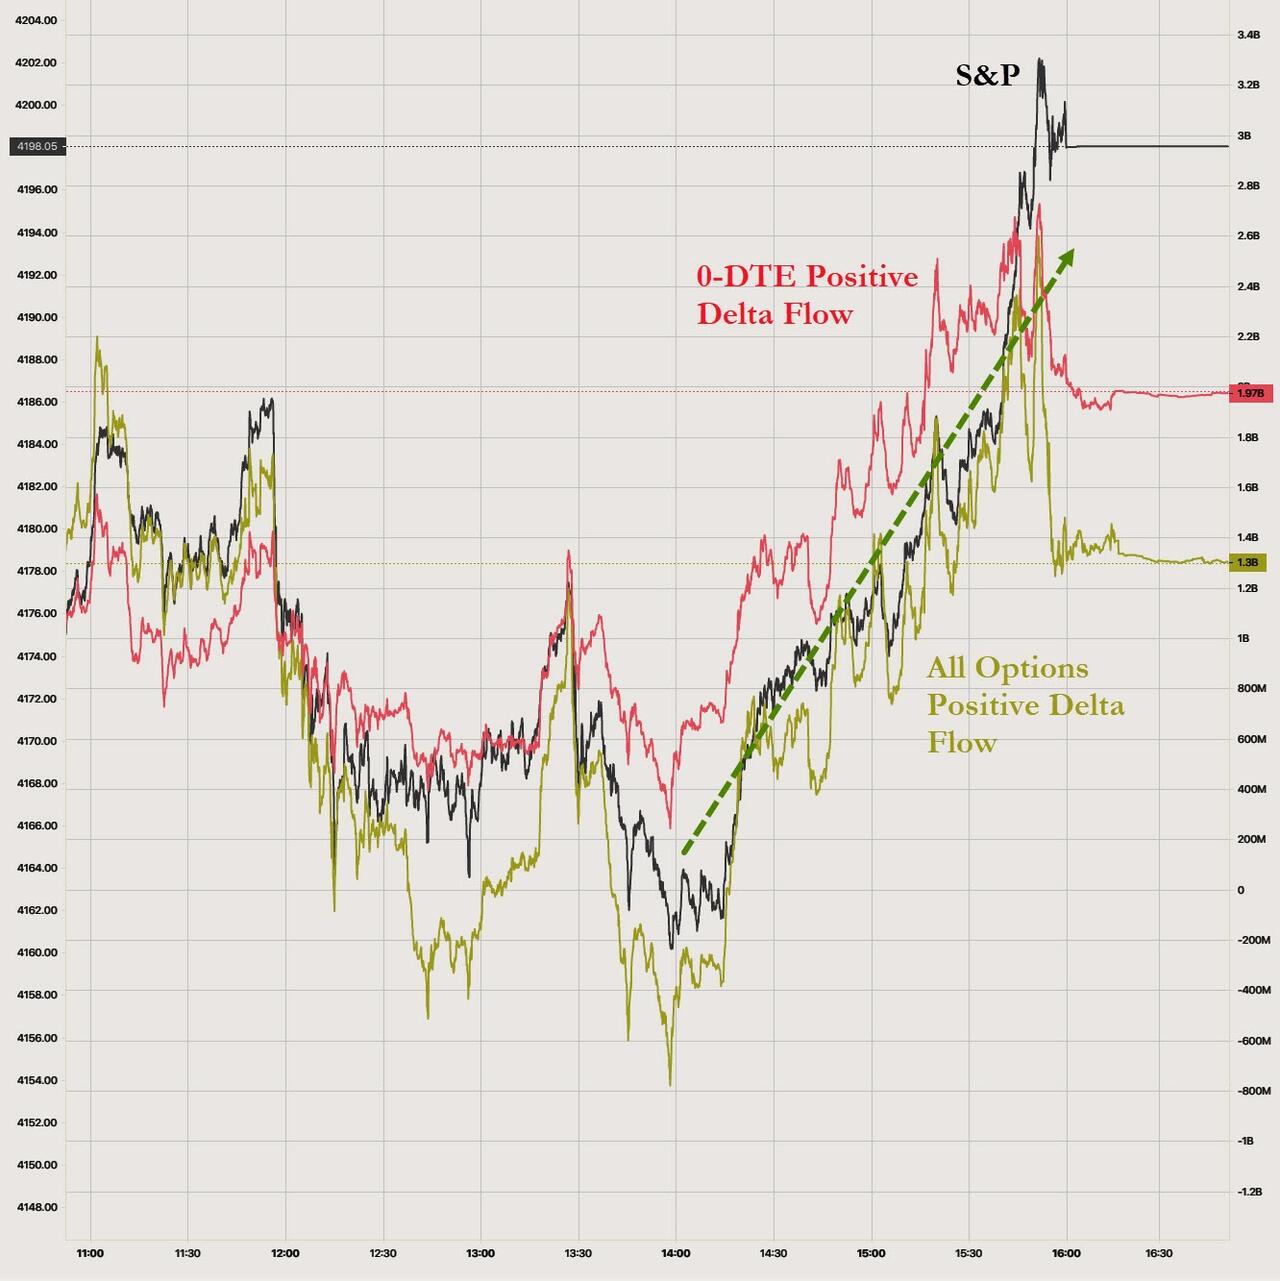
In today’s op-ex, Maximum Pain for options investors is at 4265.00.  Short gamma may begin at 4260.00.  Long gamma may begin at 4285.00.

ZeroHedge reports, “Futures are flat with oil jumping after OPEC+ cut output by an extra 1mm bpd in a unilateral move by Saudi Arabia taking its production to the lowest level for several years.At 7:30am ET, S&P futures were flat, while Nasdaq futures were down 0.2% with some artificial-intelligence exposed stocks like Nvidia Corp. and C3.ai Inc. trading down. In contrast, Apple Inc. surpassed its previous closing record in premarket ahead of what’s expected to be its most significant product launch event in nearly a decade. Oil rose 2%, with oil giants such as Chevron and Exxon up in premarket trading. The Bloomberg dollar index is up as are 10Y yields now that the market’s attention turns to the $1+ trillion deluge in new debt issuance. Gold dropped, as did bitcoin after the crypto currency got its usual Asian session rugpull.”


VIX futures rose this morning after potentially making its Master Cycle low on Friday, on day 266.  The new Cycle low came through a rare and complex W-X-Y-Z extension adding a full month to the already massive Triangle formation, creating a 17.2-month Cycle.  VIX short players are ecstatic while commentators are viewing this as bullish for equities.

In Wednesday’s op-ex, Maximum Pain is at 16.00.  Short gamma is virtually non-exixtent, while long gamma begins at 17.00 and rises to 50.00.

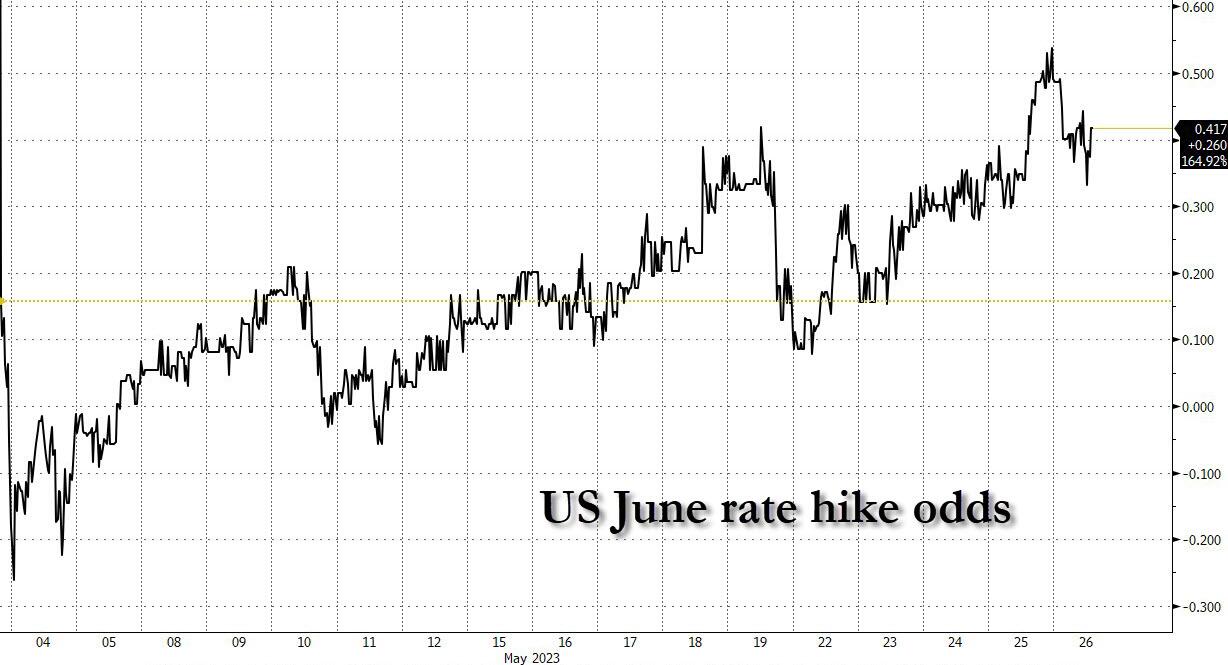
ZeroHedge notes, “It turns out the bulls had every right to be Dancing in the Street as stocks posted a very strong week (even the Russell 2000 and Regional Banks participated). Friday’s jobs data seemed to put the nail in the coffin on rate hike fears. The market has decided, rightfully so, that we are almost done with rate hikes and unless we get disastrous inflation data, any future hikes will be small enough not to act as a headwind.”


TNX leaped above the mid-Cycle resistance at 36.77 this morning, on its way to the Cycle Top resistance at 41.23 in the next month.

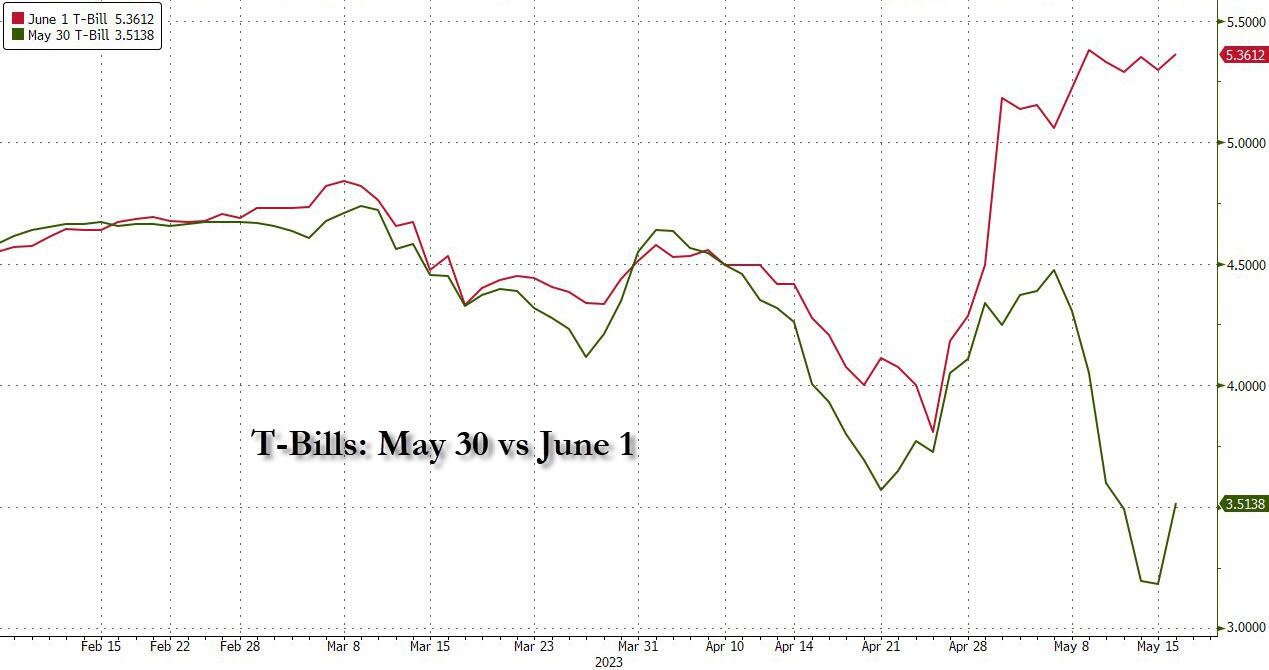
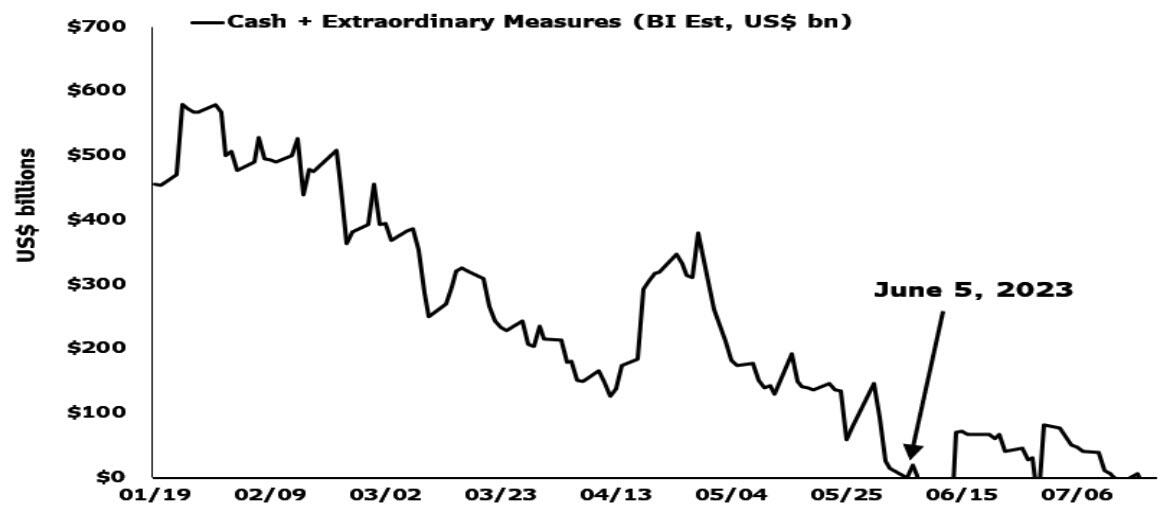
ZeroHedge comments, “As the latest debt-ceiling drama winds down, Americans are varyingly exasperated, angered, anxious and maybe even a little bit entertained by the spectacle.

While their emotions vary, most citizens have something in common: They don’t realize they’re being misled about the actual depth of their government’s financial disorder. Despite all the talk of the federal government hitting a Congressionally-set $31.4 trillion debt limit, the truth is that DC’s actual liabilities are far higher than even that disturbing number.

Estimates by the relatively few scholars and organizations who venture to expose Washington’s charade vary, but they overwhelmingly place the federal government’s true total obligations at over $100 trillion. For example, Truth In Accounting’s latest tally puts Uncle Sam’s total IOUs at $156 trillion.”


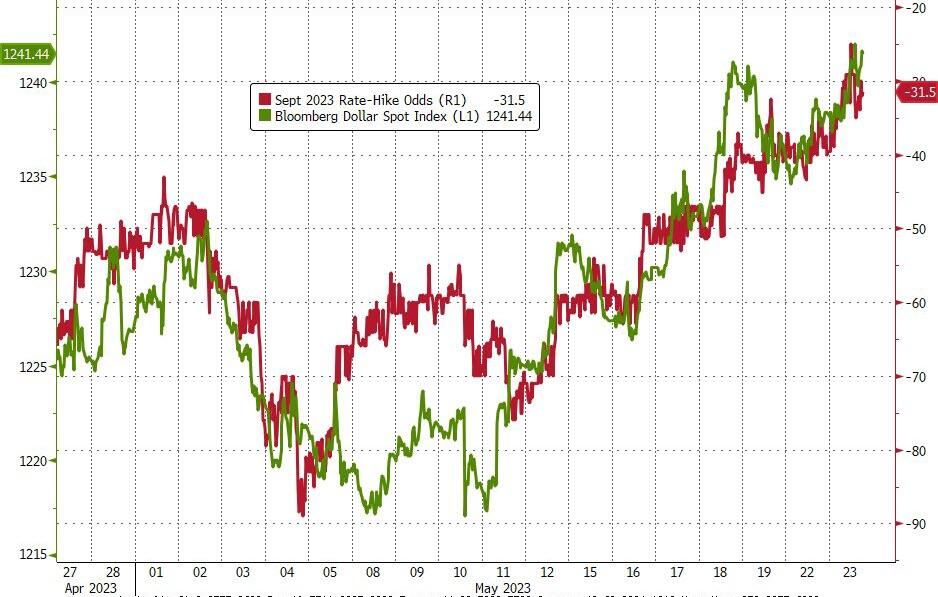
USD futures rose to 104.35 this morning.  The Cycles Model suggests another week of rally prior to a retracement.  The immediate target appears to be the mid-Cycle resistance at 105.31.  While USD may overshoot its target, it may end up back beneath it in the next few weeks.


WTIC futures may bise to test the 50-day Moving Average at 74.54 this morning, adjacent tot he trendline.  Should it succeed in overcoming that resistance, the trend may change to the positive.  However, should it be repelled, the decline may resume for as long as seven more weeks.  Thus far in the current Cycle, the daily Cycle bottom at 67.06 is holding.  However, a resumption of the decline may send Crude Oil to a possible low of 54.00.


Gold futures are lower this morning, caught in a corrective pattern that may end back near the 50-day Moving Average at 1999.70 in the next week or so.  The Cycles Model then calls for the decline to resume with the next Master Cycle going to the end of July.

ZeroHedge observes, “Most politicians have used the “Ukraine invasion card” to justify the massive inflationary burst in 2021-2023.

It does not matter if inflation was already elevated prior to the war.

Supply chain disruptions, demand recovery, wage growth… Many excuses were used to justify inflation, except the only one that can make aggregate prices rise in unison, which is the creation of more units of currency well above demand.

Inflationists will blame inflation on anything and everything except the only thing that makes all prices, which are measured in monetary units, rise at the same: Money supply growth rising faster than real economic output.”


Posted in Published | 16 Comments

June 2, 2023

7:50 am

Good Morning!

The Cycles are providing more answers now, as the rally progresses.  The end of next week will give the initial bearish Cycle and its retracement exactly 17.2 months.  It appears that there may a few more days to complete the pattern, followed by a potential waterfall event.  Initially, the Primary Cycle appeared complete on February 2.  The pattern that followed did not reveal  its true intent until it broke through the February 2 high.

SPX futures are higher this morning, and may rise to the Cycle Top resistance at 4274.54.

ZeroHedge reports, “US Futures extended yesterday’s rally after the Senate passed a bill late on Thursday to raise the debt ceiling and prevent a US default, with risk-on sentiment getting a boost following the sharpest rally in Chinese stocks for three months amid Bloomberg reports that China is mulling a new stimulus package to support the property market after existing policies failed to sustain a rebound in the ailing sector.

At 7:45am, S&P futures rose 0.5% to 4249, while the Nasdaq rose by 0.6% and was set for a sixth straight weekly advance. Europe’s Stoxx Europe 600 index followed Asian benchmarks higher, with luxury-goods makers LVMH and Richemont among the leading gainers after the China stimulus report. Treasury yields were little changed, diverging from higher rates in Europe and the UK. Oil and bitcoin both gained more than 1%, while gold was little changed after three days of gains.”


VIX futures hit a morning low at 15.07, marking a potential Master Cycle low on day 266.  Intermediate Wave (E) has become more complex than expected, but no rules were violated.


Posted in Published | 11 Comments

May 26, 2023

7:45 am

Good Morning!

My internet provider was down most of the day yesterday.  They gave no reason for the outage, except the recorded messages implied that it happened in multiple locations across the country.  I must also report that I will be out of my office all of next week.  The chances of doing a remote blog are slim.

NDX futures have reached a new high at 14005.60 this morning.  Today is day 283 of the NDX Master Cycle.  The number of stocks carrying the market is now just one.  The NDX Hi-Lo Index closed at -119.00.

The Cycles Model shows no outstanding events until the end of next week.  From that I would infer a flat market or a mild decline for the next week.  The Memorial weekend is traditionally neutral-to-positive.  However, things change dramatically in the first full week of June.

Today’s op-ex shows Maximum Pain for investors at 13775.00.  Long gamma begins at 13800.00.  Short gamma begins at 13600.00.

ZeroHedge remarks, “Yes there was macro data: GDP second look improved, jobless claims shitshow due to MS fraud revisions, pending home sales disappointed, Kansas City Fed better than expected; and some Fed Speak (Boston’s Collins sees a ‘pause’ – like everyone else), but really this was all about Jensen Huang (who’s personal; wealth jumped over $8 billion today).

From the open, the day was all about one stock – NVDA, soaring 25% or so and adding just under $200 billion in market cap – that is 2 Intels! – and from the Oct 2022 lows, NVDA has added $665 billion in market cap…

Source: Bloomberg

That is the largest single-day market cap gain for any stock in US equity market history…”

ZeroHedge notes this morning, “Boom

The NDX/NDXE ratio attacking all time highs. It is all about a(i) few great ones.

Source: Refinitiv

Not your normal short squeeze

Nomura’s McElligott weighs in: “…this is “Long Buyers” of the Stock chasing this AI theme; Yet it will likely be a MegaCap Tech “Spot Up, Vol Up” today on UPSIDE breakout and grabbing into what is relatively cheap Gamma, as the real “short squeeze” here will likely be from frequently mentioned Overwriters in MegaCap single-name and broad Nasdaq / QQQ OTM Upside Calls seen through 2023, which now AGAIN risk going “short strikes” and getting forcibly covered which will further bid “Upside”.”


SPX futures rose to an overnight high of 4160.50, suggesting yesterday’s after noon high may be the end of the retracement.    The Ending Diagonal trendline is at 4100.00, giving a confirmed sell signal.  Further confirmation awaits at the 50-day Moving Average at 4087.89.  The NYSE Hi-Lo Inces closed at -111.00 yesterday and is on a sell signal.

Today’s op-ex shows Max Pain at 4170.00.  Long gamma starts at 4190.00, while short gamma begins at 4150.00.

ZeroHedge reports, “US equity futures are higher across the board, amid speculation that a debt deal is taking shape and may be announced as soon as today (whether or not a 0.2% spending cut “deal” is something to be proud about is a different matter) and also thanks to optimism around Nvidia and AI prospects. S&P futures are 0.2% higher, rising to 4,169 and undoing the drop from the previous two days, while Nasdaq futures are up 0.4% amid continued AI-bubble euphoria. Treasury yields are falling, most markedly at the short end, on debt ceiling optimism, while a measure of the dollar is weakening. Commodities are mostly higher led by base metals. Oil prices are set for a weekly gain, climbing higher today. Gold prices are edging higher but still set for their third weekly decline.


VIX futures may be testing the 50-day Moving Average at 18.63.   The Cycles Model suggests a peak in the VIX by mid-June with a possible higher peak at the end of the month.  This activity seems to be related to the debt ceiling, but there may be something else afoot.

Next Wednesday’s op-ex shows Max Pain at 19.00.  Short gamma fizzles out at 16.00, while long gamma remains strong to 30.00.  Not much to see, yet.


TNX continued its relentless climb higher this morning.   The Cycles Model suggests a probable (minor) Trading Cycle low at the end of next week, so it may not be advisable to take any further action until the dust settles.

ZeroHedge notes, “The market’s recent re-pricing of the Federal Reserve’s rate trajectory is nothing short of dramatic. Investors will find it challenging to price Friday’s slate of data going into the long weekend while being fully mindful of the risks centered in Washington.

Just after the Fed raised rates earlier this month, the markets were assigning a more-than-50% chance of a rate cut in July and fully factoring in a reduction by September. After some hawkish jawboning from James Bullard as well as Neel Kashkari and Thursday’s better-than-forecast 1Q GDP numbers, interest-rate traders see the Fed raising rates yet again in July. Talk about the markets turning on a dime.

Will Chair Jerome Powell, who all but signaled that the Fed would stay on hold when it meets next month, be persuaded otherwise if today’s PCE data turn out to higher than the markets estimate? And will consumers’ expectations of inflation in the University of Michigan survey jump yet again, putting paid to the school of thought that inflation is oh-so-2022?


USD futures are lower this morning, although the Cycles Model does not confirm that it may last.  Additional strength may be coming online over the weekend followed by another boost in trending strength over the next two weeks.  A cross above the 200-day Moving Average may silence the dollar bears.

ZeroHedge opines, “Debt-ceiling worries are driving the dollar up for now, but real yields, the fiscal deficit and structural overvaluation favor the medium-term downtrend remaining intact.

All of the recent move higher in nominal yields (discussed here) has been driven by real yields. Inflation, erroneously, is seen as yesterday’s problem, with breakevens remaining near the lower end of their two-year range.

Higher real yields might be expected to be good for the dollar. The currency has indeed risen in recent weeks, but this is more to do with safe-haven demand in the event the debt ceiling becomes binding.”


GOLD futures are higher, to 1957.05 and may go as high as the 50-day Moving Average at 1996.88 in a short burst of strength.  However, the decline may resume shortly with an anticipated low by mid-June.

Investing.com comments, “Gold is finding support in the $1950 area on this week’s declines but is not finding support from buyers on the rally above $1985.

Gold is stuck in a range

Gold is stuck in a range

Support for this trading range is provided by the area of the late January price peak, which has also acted as a pivot point more than once in this growth cycle, halting the rally. The ability to hold above this previously strong resistance for an extended period is an important signal for speculators.


Posted in Published | 1 Comment

May 25, 2023

2:30 pm

Good Afternoon!

SPX may have completed its first hourly Cycle from its high.  If so, we may expect to see the decline begin from here.  More on Friday.


Posted in Published | 1 Comment

May 24, 2023

8:15 am

Good Morning!

NDX futures hit a new morning low at 13614.80 after breaking through the (August peak) trendline support at 13720.91.  It is currently challenging the Cycle Top support at 13616.00 and on an aggressive sell signal.  The throw-over bottom is at 13600.00, confirming the sell.  The NDX Hi-Lo Index closed at -1.00 and may be poised to give further confirmation beneath 0.00.

Today’s op-ex shows Maximum Pain for options investors at 13725.00.  Long gamma begins at 13750.00.  Short gamma may begin at 13700.00, with a growing number of contracts reaching 13500.00.

ZeroHedge observes, “The last few weeks have seen the market’s expectations for Fed’s rate trajectory shift significantly more hawkish (as the weights of the bi-modal probability distribution shift from ‘recession-emergency rate cut’ to ‘high for longer’) and that has dragged the dollar higher with it (on almost a tick-for-tick basis)…

Source: Bloomberg

The stronger dollar and higher rates have significantly tightened financial conditions in May, but stocks just don’t care…”


SPX futures declined to 4128.70, challenging the Intermediate-term support at 4130.65.  A further decline gives an aggressive sell signal which may be confirmed the the Ending Diagonal trendline at 4100.00.  The 50-day Moving Average lies just beneath it at 4077.33, giving a final confirmation of the sell signal.  The Cycles Model suggests a sideways-to-moderate decline through the next week, due to the Memorial Day holiday, which is seasonally positive.  However, the decline intensifies the first full week of June and continues at a strong (panic) phase through the end of the month.The NYSE Hi-Lo Index closed at -5.00 yesterday with the decline being confirmed beneath -32.00.

Today’s options expiration shows Maximum Pain for investors at 4160.00.  Long gamma starts at 4175.00 while short gamma begins at 4150.00.

ZeroHedge reports, “US equity futures drift drift lower for the second day following a deluge of bad news across global markets driving European stocks to their biggest drop in two months, pushing copper below $8,000 and snuffing out this year’s gains in China equities. As of 730am ET, S&P futures were down 0.4% to 4,143  following Tuesday’s 1.1% drop with Nasdaq futures sliding the same amount. Treasury yields are flat trading around 3.67%, the USD is slightly stronger, and bitcoin got the usual Asian session trapdoor as gold rose. Commodities are mixed: energy rallied (WTI + 2.1%) while metals are falling on concerns about China’s fading recovery. Yesterday, we saw de-risking in crowding stocks with Momentum Winners and MegaCap Tech being the biggest laggards. On debt ceiling negotiation, two parties have not come to an agreement. Today, we will receive the FOMC Minutes at 2pm ET; AI-leader Nviidia reports after the close.”


VIX futures hit a new high at 19.74 this morning after challenging the 50-day Moving Average yesterday.  It is on a buy signal with plenty of elevation ahead of it.   The primary target over the next few months may be the 2020 high at 85.47.  The Cycles Model suggests a peak as early as mid-June, with a probable higher peak at the end of June.

Today’s expiring options show Max Pain at 17.00 with virtually no short gamma to report.  Long gamma extends to 40.00.

Despite the buy signal, some analysts believe the low VIX is bullish.

RealInvestmentAdvice offers this comment, “Last week, the S&P 500 volatility index (VIX) fell below 16 for the first time since November 2021. The VIX index uses options prices to imply how much future volatility the market expects. Typically, in upward-trending markets, the VIX trends below 20. Conversely, in bearish markets or shorter drawdowns, it lingers in the 20s but can peak above 50. Lower volatility, like the current reading of 16, implies the market is very comfortable with potential risks.”


TNX may pull back to the mid-Cycle support at 36.58 this morning and may even extend the pullback as far as the 200-day Moving Average at 36.04.  However, once accomplished, it may offer a burst of energy higher.  The Cycles Model maintains that yields may climb until early July.

ZeroHedge Notes, “Two weeks ago we published a lengthy report looking at the hypothetical consequences of a US default – including “Clearinghouse Collapse And Shockwave Of Catastrophic Treasury Margin Calls” – which again are purely hypothetical: as we first said last week…

… and as Stifel’s Brian Gardner confirmed just a few days later…

Federal revenues cover only 75 percent of outlays so at some point, without an increase in the debt limit, Treasury will be unable to pay all of the government’s bills.  It seems clear that Treasury will prioritize the payment of principal and interest on U.S. Treasuries, so the chances of a default on Treasuries is remote.  Also, it is unfathomable that the government would not pay Social Security recipients or meet payroll of the American military. On any given day, however, Treasury would likely have to delay payments of some obligations. Depending on who the creditor is (a government contractor, veterans’ benefits, other social safety net payments, etc.), delayed payments would likely increase political pressure which would, in turn, increase the chances of reaching a debt ceiling deal, but would also be accompanied by some economic disruption and possibly a downgrade in the credit rating of U.S. government debt.

… because despite all the posturing, the US can and will prioritize debt and interest payments and avoid a technical default, even if it means that some 20 million deep state bureaucrats go unpaid for a week or two.”


Posted in Published | 2 Comments

May 23, 2023

2:48 pm

BKX appears to be in an irregular correction that may have further to go.  Despite poor fundamentals, BKX appears to be headed higher…for a time.  If so, BKX may venture to its April high of 85.95 before resuming its decline.  The debt ceiling impasse may have a positive effect on bank stocks.  It may be the Treasury refilling its coffers after the impasse is settled that will nail bank stocks due to rising interest rates.


2:35 pm

VIX has challenged the 50-day Moving Average at 18.85 on a trending strength day.  This lends further confirmation to the buy signal.  While trending strength may diminish over the Memorial Day holiday, it may pick up strength in the first full week of June, which purports to be an active month.  Meanwhile, traders are picking up nickels in front of a steam roller shorting the VIX.

ZeroHedge notes, “I mean seriously… make it stop, please!”

Nomura’s Charlie McElligott is worried that things are just a little too good to be true for traders currently.

Specifically, he highlights that the dangerous dance builds – as from a risk-adjusted basis, “Short Vol” is crushing even “Long Stock” in everything but QQQ / Nasdaq Long only, with the AI “manna from heaven” – as a lot of the Asset Manager complex looks at the SPX fully-valued here at 19x and is more than happy to keep Overwriting (while others Underwrite), and Systematic “Short Vol” prints.

Over the past two weeks a strategy of selling Daily 25-Delta Puts has a Sharpe Ratio of… wait for it… 34!

But… and it’s a big butt! The cross-asset strategist warns that this impossibly-smooth “Short Vol” return in recent weeks, this “smooth risk-adjusted return” path is indicative of asymmetry, fragility and instability.”


8:00 am

Good Morning!

NDX futures consolidated inside yesterday’s trading range as the markets await the FOMC announcement on Wednesday.  NDX is in a throw-over phase of its Ending Diagonal formation.  Once finished, the target is commonly the starting low in October.  An aggressive sell signal awaits investors beneath the August high at 13720.91.  The Cycle Top at 13594.16 provides confirmation.

Today’s op-ex shows Maximum investor Pain at 13800.00.  Long gamma starts at 13825.00.  Short gamma may start a t 13760.00,  but not a lot of conviction.

ZeroHedge comments, “Big five PE

Narrow and powerful…Jeff writes: “…29% of the stocks outperforming and the top five stocks driving 78% of S&P 500’s returns this year.”

Source: Jefferies

Lowest since 1999

The number of stocks outperforming the SPX has crashed formidably.


SPX futures are trading lower, but still within yesterday’s range.  Intermediate-term support is at 4129.30, beneath which an aggressive sell signal may be taken.  Friday May 19 remains the Master Cycle high in the SPX.

Today’s op-ex shows Max Pain at 4190.00.  Long gamma starts at 4215.00, while short gamma may begin at 4175.00.

ZeroHedge reports, “US equity futures are lower, as treasuries also dropped across the curve, with the two-year yield rising for an eighth day, after the latest round of talks between Joe Biden and Kevin McCarthy Monday ended without a deal, while Eurozone manufacturing activity shrank at the fastest pace since the pandemic shuttered factories three years ago, threatening to sap momentum from an economy driven by services. The dollar rose as did bitcoin, gold fell again while oil reversed earlier losses and jumped to session highs after Saudi Arabia’s energy minister told oil speculators to “watch out” just over a week before the OPEC+ alliance is due to meet.

At 7:45am ET, US equity futures dropped 0.2% to session lows, dropping back under  4,200, whlie the Nasdaq was shocking in the red perhaps finally realizing where the 10Y yield is. Lowe’s slipped 1.5% in pre-market trading after cutting its sales outlook. In Europe, a rout in luxury-goods makers including Hermes International and LVMH dragged the Stoxx 600 lower after Deutsche Bank AG analysts warned the sector is crowded and valuations are lofty. Tokyo’s Topix index fell for the first time in eight days, with semiconductor-related stocks turning lower on news that Japan’s tighter export controls will take effect July 23.”


VIX futures rose above the trendline at 17.60, giving a technical buy signal.  The Cycles Model shows increasing trending strength starting today.  The next phase may last through mid-June, but the final target may not come until the end of June.  Hedge when you can, not when you must.

Tomorrow’s op-ex shows only long gamma, starting at 17.00.  Currently, long conviction rises to 40.00.  Note; the June 21 conviction rises to 85.00.


TNX continues its rise above all resistance levels with the exception of the Cycle Top.  Trending Strength is rising, according to the Cycles Model.  Any pullback may only be a retest of supports as low at 36.00.  Meanwhile, the Cycles Model shows rising rates into early July.

Zerohedge remarks, “The White House and GOP negotiators plan to meet again Tuesday to continue negotiations on a months-long impasse over raising the nation’s $31.4 trillion debt ceiling before a default occurs.

Republicans say the White House isn’t negotiating in good faith, with House Financial Services Chair Patrick McHenry (R-NC) saying on Tuesday that he’s not sensing urgency from the White House – which waited months to arrive at the bargaining table at the 11th hour.

Rep. Garret Graves (R-LA), who authored the House GOP’s opening bid on permitting reform, says that Republicans and the White House are still ‘far apart’ on a deal.

After a Monday night meeting between President Biden and House Speaker Kevin McCarthy (R-CA) – their third meeting, failed to produce meaningful progress, White House aides headed back to Capitol Hill for further talks throughout the night.

House Appropriations Committee Chairwoman Kay Granger, a Republican, also suspended work on pending funding bills this week “to give the Speaker maximum flexibility as talks continue,” she said in a statement.

The lack of clear progress continued to weigh on Wall Street with U.S. stock indexes set to open lower Tuesday morning and global markets on edge. –Reuters

Meanwhile, the Treasury Department has asked federal agencies if they can delay payments, the Washington Post reports, citing two people familiar with the matter, as the Biden administration looks for ways to limp things along until a deal is struck – or June 15 quarterly tax payments roll in, buying Congress a bit more time to negotiate before the so-called “X-date” when reserves run dry.”


Posted in Published | Comments Off on May 23, 2023

May 22, 2023

8:00 am

Good Morning!

NDX futures declined to 13749.90, just above the trendline at 13720.91.  On Friday it made a new yearly high at 13874.42, on day 276 of the Master Cycle.  While the NDX may go as high as 14200.00, the Cycle is very stretched.  A decline beneath the trendline may constitute an aggressive sell signal.  Should a reversal occur, the NDX is due for a decline to the end of June.

Today’s options expiration shows Maximum Pain for options investors at 13790.00.  Long gamma begins at 13820.00, while short gamma starts at 13750.00, at the tip of the Ending Diagonal.

ZeroHedge remarks, “Nobody talks about this one

Majority of pundits are only talking about the big SPX spec short, but there are many offsetting positions, one of them the NASDAQ long…currently at rather long levels.

Source: DB

NASDAQ technicals

The break out has managed sucking people in. We continue to trade inside the trend channel. Note the 14k, give or take, is a big resistance area to watch.”


SPX futures have remained in a very narrow corridor between 4175.00 and 4197.00.  SPX managed to make a new 2023 high, but remained beneath the August peak.  The top of the trading channel is near 4220.00.  Intermediate-term support lies at 4127.30, where a potential aggressive sell signal lingers.  Although the probability of a new high was evident, the surprise came late in the day.

Today’s op-ex shows Max Pain at 4175.00.  Long gamma starts at 4200.00. while short gamma begins at 4150..00.

ZeroHedge reports, “US futures are flat as we start a new week and inch closer to the debt ceiling x-date: as a reminder, according to Janet Yellen the US could be in default in just 10 days. At 8:00am ET , S&P futures were up 0.1%, near session highs, after trading in a narrow range overnight; the tech-heavy Nasdaq was pressured by losses on semiconductor stocks after China said products from Micron Technology had failed a cybersecurity review. Micron shares dropped more than 5% in New York premarket trading, dragging down other chipmakers, including Nvidia and Qualcomm.  Asian markets are higher, while European stocks trade near session lows. Bond yields are higher, rebounding from session lows, while the USD is slightly in the green with commodities also erasing earlier losses. MegaCap Tech names are up slightly pre-market. McCarthy and Biden spoke on Sunday and will resume negotiations today. Fed’s Kashkari, a Fed dove turned hawk (and soon to turn dove again) is now open to holding rates steady in June; OIS now sees more than 80% odds of a pause at the June mtg. Biden expected ties with China to improve very shortly and considers lifting sanctions on Chinese Defense Minister.”


VIX futures rose to a weekend high at 17.43, approaching the trendline at 17.60.  Although the VIX may waver near the low, the correction appears complete.

ZeroHedge observes, “What happens when Ranges are broken? Finally some moves…

a. What is the client feedback in the last 48 hours as debt deal optimism increases? Who ya got?

  • I have been pinged more times in the past two days than all year. Clients are re-engaging and sentiment has dramatically improved. If there are positive headlines over the weekend, this rally has legs. Current short (low risk) positioning is not reflective of improving sentiment and a potential move higher.

b. Who is moving off the sidelines back into equities (said another way, was the equity demand real or covering related)?

  • S&P trading above $4200 Friday morning, which is the top end of the range. I think investors will continue to add risk next week if we see any positive developments over the weekend and the top of the range gets extended to $4300/$4400 to the topside.

c. What is client consensus and what does the consensus think about the consensus?

  • Bearish sentiment continues to wane. No one wants to be forced into the market, and that entry be the new top tick. This feels more orderly and buying the highest quality sustainable themes. The worst thing would be a correction shortly after the cover bid is completed.”


TNX may be beneath Friday’s peak, but it still appears on its way higher, adding strength along the way.  It is now above mid-Cycle support, giving it legs to go higher.  Trending strength may appear this week, but comes back in spades in mid-June.

ZeroHedge notes, “Negotiations in Washington DC over the debt ceiling have taken a big step back over the weekend, as the White House and House Republicans continue to point fingers at each other.

It seems as though he wants default more than he wants a deal,” House Speaker Kevin McCarthy (R-CA) told Fox News on Sunday. “We have got 11 days to go,” McCarthy continued, urging Biden and the Democrats to be “sensible about this.”


USD futures took a small step back after its rally last week.  However, trending strength may arrive as early as today and may continue dominating for the next three weeks.


Gold futures may resume their decline after testing the 50-day Moving Average at 1988.74.  Gold is on a confirmed sell signal.  The Cycles Model suggests that the decline may continue through mid-June.  The next support level is the mid-Cycle support at 1836.69.  Don’t be surprised should it go there.


Posted in Published | Comments Off on May 22, 2023

May 19, 2023

3:02 pm

BKX also suffered a reversal  just beneath the 50-day Moving Average after an irregular correction.  We may see a panic decline over the next three weeks.  Note that TNX broke out this morning, signalling higher rates (and more bank losses).

ZeroHedge remarks, “Amid a major short-squeeze which has lifted the regional bank stocks almost 10% this week – the best week since Nov 2020 – CNN is reporting that during Thursday’s meeting with the CEOs of large banks, Treasury Secretary Janet Yellen told executives that more bank mergers may be necessary as the industry continues to navigate through a crisis, two people familiar with the matter told CNN.

Yellen echoed remarks from US regulators who have said there may be bank mergers in the current environment, one person familiar with the matter said.

Additionally, this is nothing new as during an interview with Reuters this week, Yellen said a certain degree of consolidation in the regional and mid-size banking sector could occur.

“This might be an environment in which we’re going to see more mergers, and you know, that’s something I think the regulators will be open to, if it occurs,” Yellen told Reuters.

Roughly translated that means expect more imminent bank failures.”


2:39 pm

SPX did not take long to make its reversal.  A close beneath 4160.00 may make it a Key Reversal.

ZeroHedge notes, “As we discussed last night, Goldman’s Sales and Trading desk was bombarded on Thursday by clients eager to know what has been behind the recent meltup in tech stocks. In response, Goldman shared several explanations starting with the near record Nasdaq gamma squeeze which saw the most NDX call buying since 2014…

… as well as several other mostly technical catalysts:”


8:30 am

Good Morning!

NDX futures reached an overnight high at 13905.00, but have eased back to the flat line.  Should NDX go higher, today is day 276 of very stretched Master Cycle.  The August high and Cycle Top resistance have both been challenged.  The Cycles Model maintains that the next move may be a decline to the October low by the end of June.

Today’s op-ex shows Max Pain at 13660.00.  There is virtually no short gamma, while long gamma begins at 13700.00 and runs to 14000.00.  If options investors have their way, NDX would rise to 14000.00. today.

ZeroHedge remarks, “Today is one of those 12 days a year where 0-DTE and monthly OpEx are the same and despite the overwhelming strength from yesterday and Goldman noting that it is a relatively small expiry with a total of $1.7 trillion notional ($735bn of this is AM expiry, with the remaining $1trillion of this SPX pm + ETF + single stock), SpotGamma believes there are some reasons for concern.

But first, Goldman’s derivatives guru Brian Garrett sets the scene:

Dealers are long ATM and downside options, but short upside tail (we saw how powerful this can be yesterday into the bell!)…

Also of note – for any breakout risk – the 1 month trading band hasn’t been this tight in years

historically, this level of “coiled spring” has a short lifespan… now it’s just a question of breakout or breakdown.”


SPX futures have reached an overnight high at 4214.00 and remain near the high thus far this morning.  Yesterday I mentioned the weekly mid-Cycle resistance at 4198.50.  Note the close was nearly spot-on.  Whether the SPX goes higher today or not, all the signs point to an imminent reversal with a decline to the end of June.

Today’s op-ex shows 4150.00 being hotly contested, with long gamma above running to 4300.00 and short gamma beneath it running to 4000.00.

ZeroHedge reports, “After breaking out to new 2023 highs, US equity futures are up small (on “debt talk progress” even though there has been zero actual debt talk progress) ahead of Powell’s speech today, trading in a narrow 10 points. As of 730am ET, S&P futures are up 0.2% to 4,220 while Nasdaq futures are up 0.1%. European stocks are up 0.8%m near session highs with Germany’s DAX set for a record close for the first time since January 2022 while the Nikkei 225 closed at a 33-year peak, as momentum carried over from Wall Street.  Bond yields reversed earlier losses and hit session highs around 3.65% while dollars are weaker. Pre-market, megacap tech, where we just saw the biggest call buying since 2014, continues to drive higher amid yesterday’s rally. Commodities are mixed: oil is set to close its best week since mid-April while base metals are lagging. Macro calendar is quiet today with the major focus on Powell’s speech at a panel at 11am ET (Fed) where former chair Ben Bernanke will also be present. Keep an eye on the key 4200 level today.”


VIX futures made a new morning low at 15.86.  Despite that, the VIX is very tightly wound up at all degrees for a sizeable breakout .


TNX has clearly broken out above its April high and due to go higher.  Today is already showing strength and may be due for more.  The Cycles Model suggests that TNX may continue to rise until early July.  Powell’s highly anticipated speech at 11:00 am may give further impetus to the new trend.


Posted in Published | 1 Comment

May 18, 2023

12:30 pm

SPX reversed shortly after 11:00 am and is now beneath the 2-hour Cycle Top at 4175.55.  This may be interpreted as an aggressive sell signal with confirmation beneath the lower Triangle trendline at 4120.64.  Note that a new high was not made, per the Cycles Model.  However, the NDX did make a new high just above the August 16 high at 13720.91 and may be in reversal also.

ZeroHedge warns, “The world and their pet rabbit appears to have bought into the idea that all we need for a sustained rally in stocks to the moon is s debt ceiling deal, removing all that uncertainty and unleashing animal spirits. Of course, one would need to ignore The Fed (only way they are cutting is if shit hits the fan in the markets, so careful what you wish for there), sticky global acyclical inflation (the decline in headline inflation has been driven by the fall in the cyclical component, while the structural component is still near its highs), the ongoing banking crisis (no deposit outflows have not stopped… and won’t all the time MM funds offer 4-5%), and global geopolitical risk escalation (Ukraine and Taiwan).

The ‘safe haven’ (AI) driven surge has lifted the Nasdaq to 13 month highs in the face of all this…”


8:00 am

Good Morning!

NDX futures hit a new retracement high at 13624.90 this morning.  Yesterday it hit the 50% retracement of the 2022 decline at 13565.00.  It also challenged the Cyclically important weekly mid-Cycle resistance at 13450.00.  These are all indications of a Cyclical ending, not a new beginning.  NDX has “thrown over” both its Ending Diagonal formation and the daily Cycle Top at 13531.31.  This is not a breakout, as some analysts suggest.  It is an ending that vacuums up the last holdout, so that everyone is long.  The NDX Hi-Lo Index has not had a positive close since March 3, telling us that the leadership in this rally is very narrow.  Will it make the August 16 high at 13720.91?  We may know the answer in just a few hours.

Today’s op-ex shows Maximum Pain for options investors at 13350.00.  There is no short gamma.  Long gamma may start at 13375.00, but not with a lot of conviction until 13700.00.

ZeroHedge comments, “When ranges are broken

Japanese equity price action has been impressive to say the least. Note that Nikkei wasn’t so exciting, only a few weeks ago. The index was stuck in a range, and decided to kill the shorts. Trading ranges is an art…especially when they are broken. Will we see a similar set up?

Source: Refinitiv

Signal too strong to ignore

Soc Gen says this on “pain trade” in the S&P: strongest net shorts in 12 years but index performance still positive.


SPX futures are hovering near the flat line this morning.  Today, day 275, is the last day that the Cycles can be “pushed.”  The hourly and daily Cycles Models both suggest a turn this morning, so be on the alert.  However, be advised that a new high may be made in the process in a possible “key reversal.”

Today’s op-ex shows that 4150.00 may be the Max Pain trade, with long gamma beginning at that level and stretching to 4200.00.  Short gamma rules at 4145.00 and may run to 3985.00.

ZeroHedge reports, “Futures are slightly higher following yesterday’s strong session driven by what the narrative says is debt ceiling deal optimism after US President Biden said he was confident the US would avoid a default, although how rising stocks – which eases pressure for a debt deal – makes a deal more likely is beyond us. S&P futures were up 0.2%, pointing to a second day of gains for the index, and US regional lenders kept up their momentum in premarket trading, with Western Alliance Bancorp adding 2% and PacWest Bancorp up 6%; longer-dated bond yields are up 1-2bps, with the 10Y TSY trading at 3.60%. USD strength continues despite many investors indicating potential weakness into the x-date; commodities are weaker across all three siloes after the Black Sea Grain Initiative was extended by 2 months, reducing near-term inflation risk. Biden says another debt ceiling update will come Sunday after positive momentum in negotiations. Today, we receive WMT earnings which beat beat on revenue, earnings and comps, pushing the stock higher and a further read on the consumer plus jobless data.”


VIX futures are also flat this morning.  The Cycles Model shows a probable steady gain with a burst of energy early next week.

The May 24 options expiration shows Max Pain at 17.00 with not short gamma.  Long gamma starts at 18.00 and runs strong to 40.00.

ZeroHedge comments, “There was a comically circular element to the stated reason behind today’s market meltup, which – according to most superficial takes – was due to “debt ceiling optimism” (according to JPM TMT trader Ron Adler, “There is more optimism around the Debt Ceiling this morning as futures reclaim most of yesterday’s late day sell-off”).

It’s comical, because the only motivation Washington has to get a debt limit deal done is pressure from the market (i.e. a sharp drop in stock prices) and by rising instead, the impetus to get any deal done disappears even if it makes a technical default – and a market puke – that much more likely. Then again, in a market where 0DTEs dominate and set the market’s “momentum mood” on an hourly basis, even if makes zero sense, nothing surprises any more.”


TNX gapped above the 200-day Moving Average at 35.85 this morning.  Recognition of a change in trend may come quickly as TNX also challenges its April 19 high at 36.39.  It may see a burst of strength this weekend, stretching into mid-week.  The new trend may have staying power, as the current Cycle may last to early July.

ZeroHedge remarks, “Another day, another hawk… and this time the market seems to be starting to believe it…

“After raising the target range for the federal funds rate at each of the last 10 FOMC meetings, we have made some progress,” Dallas Federal Reserve President Lorie Logan said in prepared remarks for a speech to bankers in San Antonio.

The data in coming weeks could yet show that it is appropriate to skip a meeting. As of today, though, we aren’t there yet.

“We haven’t yet made the progress we need to make. And it’s a long way from here to 2% inflation,” Logan said, referring to the Fed’s longer-run goal.

The response was quick with futures hitting the lows of the day, extending losses after the ‘good’ initial claims data…”


Posted in Published | 1 Comment

May 17, 2023

7:45 am

Good Morning!

NDX futures challenged the trendline at 13430.00 this morning, but did not make a new high.  This leaves yesterday’s high as the probable Master Cycle pivot on day 272.    The lower trendline of the Ending Diagonal formation appears at 13300.00, offering investors a potential sell signal should NDX decline beneath it.

Today’s options expiration shows Maximum investor Pain at 13370.00.  Long gamma starts at 13400.00, while short gamma begins at 13350.00.  There does not seem to be much confidence in either direction.

QQQ (327.16) options show Maximum Pain at 328.00.  Long gamma starts at 329.00, while short gamma begins at 325.00.

ZeroHedge opines, “It is narrow – SPX edition

The SPX/SPX equal weight ratio vs the SPX. Watching the gap closely…

Source: Refinitiv

Beautiful big tech

The NASDAQ vs Russell ratio is printing new recent highs. We are not far from the post Covid panic highs for this ratio. Investors are sucked into chasing tech here, as who on earth can justify being long the crap and not the big quality stuff?


SPX bounced above Intermediate-term support at 4116.69 after closing beneath it.  The bounces are weakening to the point where support isn’t holding.  We may expect the decline to gain strength imminently.  Remember, an aggressive sell signal was made two weeks ago.   Aggressive signals often lead to retracement or (in this case) boredom, but it would be unwise to second guess the outcome.  Once the decline is underway, the Cycle may continue its decline until mid-June.  The Cycles Model suggests that SPX may continue to toe the flat line until the X-date, near June 1.

Today’s op-ex shows Max Pain at 4120.00.  Long gamma starts at 4140.00, while short gamma begins in strength at 4100.00.  The neutral channel is narrowing…

ZeroHedge reports, “US stock futures crept higher on Wednesday and traded near the best levels of the session, as investors remained focused on debt ceiling talks while negotiators seek a framework agreement for Joe Biden and Kevin McCarthy to review upon the president’s return from a truncated trip to Asia. Contracts on the S&P 500 were up 0.3% as 7:45am ET a.m. while Nasdaq 100 futures added 0.2%. Europe’s Estoxx50 little changed on the day; while Japan’s Nikkei 225 closed above the 30,000 for the first time since September 2021 a day after the Topix closed at its highest level in more than three decades. Treasuries are slightly richer across the curve with spreads broadly within 1bp-2bps of Tuesday’s close while the dollar is flat. Oil rebounded from an earlier drop concerns over demand in China and expectations of rising stockpiles in the US. Iron ore continues its week in the green, while gold and bitcoin declines.”


VIX futures have eased back, but has remained above the long-term trendline.  There may yet be a potential surge of strength this week, although much has been accomplished beneath the surface (see below).  The next surge in trending strength comes early next week, suggesting more delays in the debt ceiling debacle.

Today’s op-ex shows Max Pain at 20.00, with short gamma extending to 15.00 and long gamma extending to 50.00.

ZeroHedge reveals, “With the debt ceiling game of chicken reaching a crescendo, and just two weeks left until the June 1 X-date, which the Treasury market has already decided is when the US will default (technically) unless a market shock forces Washington to reach a compromise, as observed by the record divergence between the May 30 and June 1 Bills…

… some in the otherwise sleepy and bizarrely complacent equity market are quietly waking up and expecting nothing less than a VIX shock in the next few weeks.

As Goldman trader John Flood writes in his daily market recap, “the street continues to get lifted on wingy VIX upside, something to be mindful of if we do get any vol shock around the debt limit” and specifically, today a Goldman institutional customer bought 50,000 x 150,000 VIX Aug 40-60 1×3 call spreads (bought 60 strike).”


TNX has challenged the 50-day Moving Average at 35.23 this morning, but bounced above it.  It may yet test the trendline and Intermediate-term support at 34.70 before trending higher.  Trending strength may return by Friday.

ZeroHedge remarks, “Yesterday, in her crusade to scaremonger Republicans into submission and yielding to Biden on the debt ceiling negotiations, Janet Yellen repeated that the Treasury X-Date will be in early June, potentially as soon as the first of the month. The former Fed chair then cranked up the doom to 11, and six years after predicting “no new financial crisis in our lifetimes”, Yellen said that a US default could see “a number of financial markets break – with worldwide panic triggering margin calls, runs and fire sales.” Basically all the worst parts of the bible. And incidentally, Yellen isn’t wrong: a US default would indeed be the end, but of course that will never happen as US tax receipts are more than enough to pay debt interest and maturities; the worst that will happen is that the bloated US deep state and some 25 million government workers will be out of a job, which is long overdue anyway.

Yellen is probably also correct about the timing of the X-Date. As Bloomberg rates strategist Ira Jersey writes, he concurs with Yellen’s assessment “that the debt ceiling X-date could be as early as June 1″ although his calculations suggest the date is a few days later (June 5-8), as shown in the chart below.”


USD futures are moving higher, after overcoming the 50-day Moving Average at 102.29.  The Cycles Model suggests the trend may continue until mid-June.  The next resistance to challenge is the 200-day at 105.67, running neck-to-neck with the mid-Cycle resistance.


Posted in Published | Comments Off on May 17, 2023