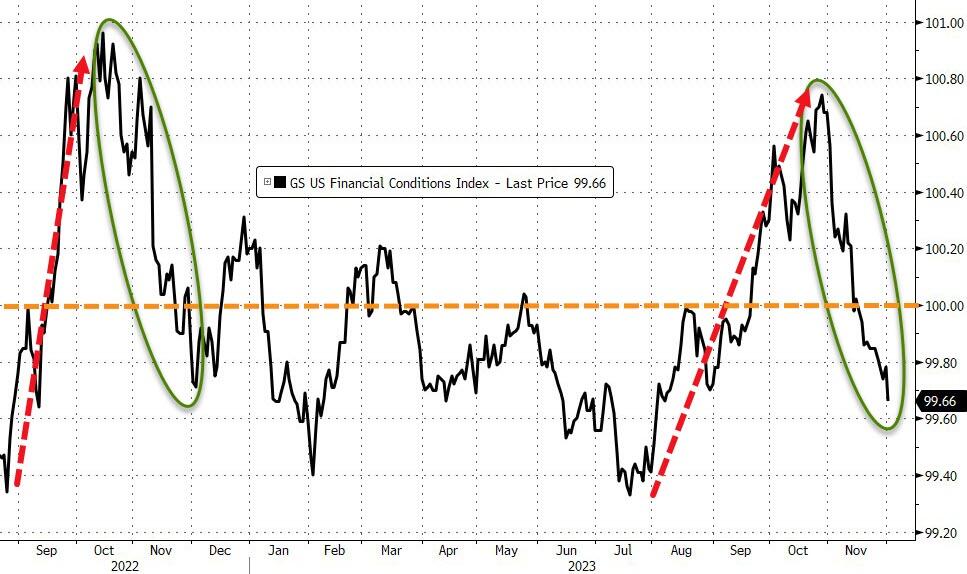
December 13, 2023

1:28 pm

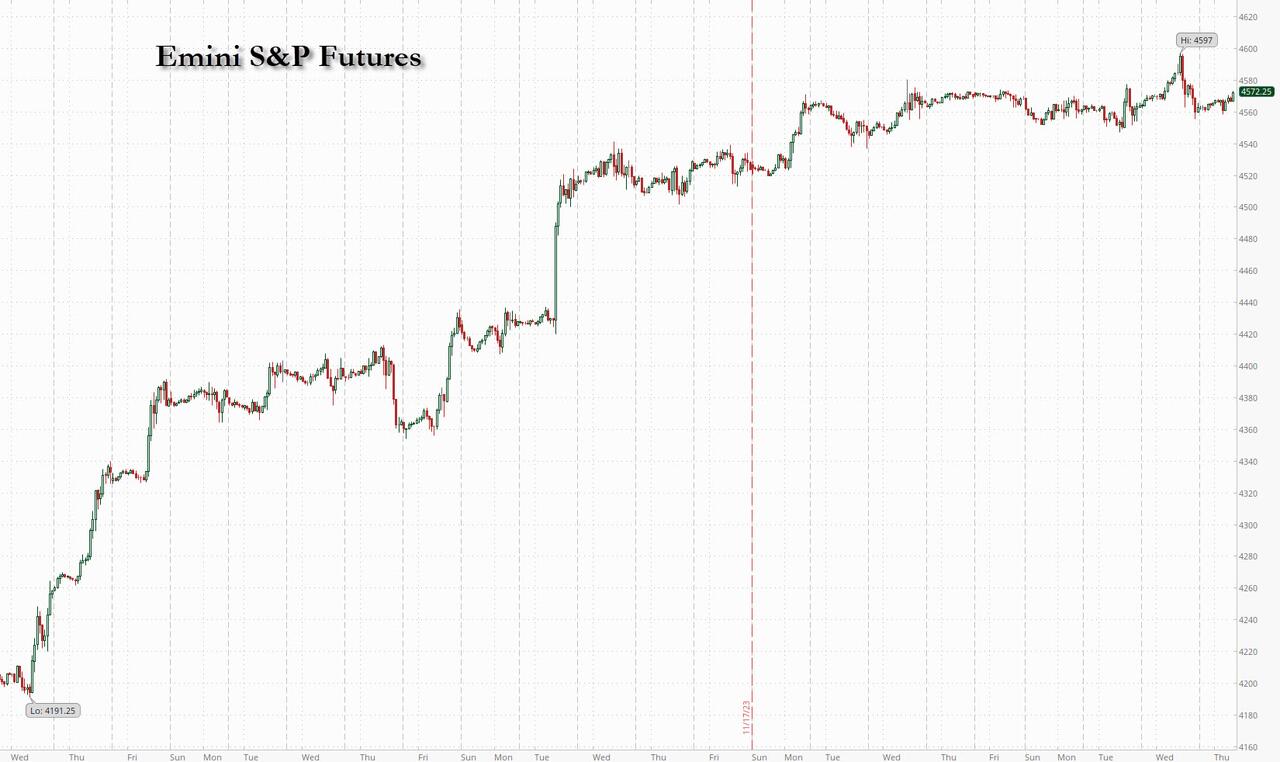
SPX has given up its morning gains.  There is no signal yet, but here are some levels to consider:  (1) A decline beneath 4600 may produce a Key Reversal which is considered a reliable sell indicator by many traders.  (2) A further decline beneath Short-term support at 4571.30 may offer an aggressive sell signal.  Further declines to supports beneath that may confirm the sell signal.  Aggressive signals are subject to blowbacks, but may eventually prove correct.  The rally is only sitting on a one-legged stool (retail buyers) as CTAs and corporate buy-backs have left center stage.

ZeroHedge remarks, “Back on Oct 17, almost to the day the market hit its lowest level since May, we wrote that “CTAs Are Now Buyers In Every Scenario“, a bullish thesis which was further underscored by the arrival of massive stock buybacks a few days later once the buyback blackout period ended (see “Here Comes The Surge In Stock Buybacks As Goldman Models A Record $142BN In CTA Buying“) not to mention a huge short squeeze among the hedge fund community (see “After “Record 14 Weeks Of Shorting”, Hedge Funds Steamrolled In Epic Meltup Squeeze“). What has followed since then is what The Market Ear called “one of the biggest vol adjusted rallies ever”, which only makes sense a few weeks after Michael Wilson said to “forget” about a year-end rally, arguably the worst call in recent history.”


8:00 am

Good Morning!

NDX futures continued their relentless march higher, to 16393.70 thus far.  The intended target may be the Cycle Top at 16638.79.  It may have a structural limit not to exceed 16660.00.  Today is day 275, which is an outer boundary of the time allotted to the Master Cycle.  What comes next may be a violent reversal.

Today’s options chain shows Max Pain at 16340.00.  Long gamma begins at 16350.00, while short gamma is in short supply.  A reversal today may be a total surprise.

ZeroHedge observes, “All I want for Christmas

Everyone apparently needs to have more Tech. Most inflows into the S&P Tech Sector (XLK) yesterday in the last 5 years…

Source: GS sales

Terrific Tech Tuesday

Themes / sector performance yesterday somehow feels bullish. Everything tech / AI / growth did well. And the mega-caps are back at doing what they do best after a litte well-deserved rest.”


SPX futures also maintain their climb to 4652.10 thus far.  The apparent upper limit may be the Cycle Top at 4677.43.  A rough calculation of the 1987 trendline places it at 4705.00, which ay be an alternate limitation to the rally.  A normal decline from here may target the Cycle Bottom at 3992.42.

Today’s op-ex shows Max Pain at 4590.00.  Long gamma starts at 4600.00.  Short gamma begins at 4575.00.

ZeroHedge reports, “S&P 500 futures continued to grind to fresh 2023 highs, quickly approaching all-time highs ahead of the Federal Reserve’s last interest rate decision for 2023, after Tuesday’s cash close was at highest level since January 2022. As of 7:45am ET, S&P futures rose 0.12% while Nasdaq futures continued their relentless ascent, adding another 0.2% as investors looked ahead to the Federal Reserve’s interest-rate decision, bracing for any warnings from Chair Jerome Powell that market expectations of policy easing are overdone (our full FOMC preview is here). European stocks are also ahead, with the Stoxx 600 rising 0.2%. Asian stocks fell, with Chinese equities leading declines on disappointment over a lack of more stimulus from a key economic leadership meeting, while European stocks rose, with the Stoxx 600 rising 0.2%, and touching fresh 2023 highs. Sterling tumbled after UK GDP printed -0.3%, contracting more than the lowest consensus estimate while the Bloomberg Dollar Index rose 0.2%. oil prices are little changed, with WTI trading near $68.70. Spot gold rises 0.1%.Bitcoin traded just above $41,000. Today’s macro focus is on PPI and the Fed. The Fed is expected to make no changes to its policy, Powell is expected deliver a hawkish press conference, and for the dot plot decline by 50bps. For markets the keys will be the dot plot and whether Powell discusses a pathway for cuts.”


VIX futures are bouncing off yesterday’s low at 11.81 to a morning high at 12.27 thus far.  A rising VIX in tandem with a rising SPX is a sign of danger ahead, since on or the other is wrong.  Yesterday was day 274 in the Master Cycle, stretched to its outer limits.  Should VIX move lower, the Cycle Bottom lies at 11.18.

Today’s options chain shows Max Pain at 16.00.  Short gamma runs from 12.00 to 15.00.  Long gamma may start at 21.00 to 23.00.

ZeroHedge remarks, “Vol keeps resetting lower into this Spot Equities Index rally (VIX at levels which would be a fresh “post COVID closing low”)…

…and as is so often then the case, a “virtuous feedback loop” ensues: the persistent absolute wreckage in realized Vol allows for mechanical “VaR-up”, as Exposures are bought back and price-momentum / trend re-builds to the Upside…

Nomura’s Charlie McElligott estimates a cumulative $notional of Equities purchased across “Systematics” Vol Control + CTA Trend ~+$104B since early November as a proxy.

This all fits with his warning of an “equity upside pain-trade scenario into year-end”.


TNX is revisiting the trendline at 41.50 in a normal retracement, testing the support there.  Once the rally resumes, it may continue to the first week of January.  The target for this rally may be the Cycle Top at 49.58.   The ultimate target for Wave (5) may be near 5.3% or higher.

ZeroHedge observes, “he Federal Reserve’s dot plot is likely to push back on the notion of deep rate cuts priced in by the markets for 2024, spurring a selloff in Treasuries.

The median of policymakers on Wednesday may show the funds rate for next year at 4.9%, implying 50 basis points of rate cuts. That would fly in the face of market pricing for a reduction that has swung between 110 basis points and 125 basis points over the past few days.
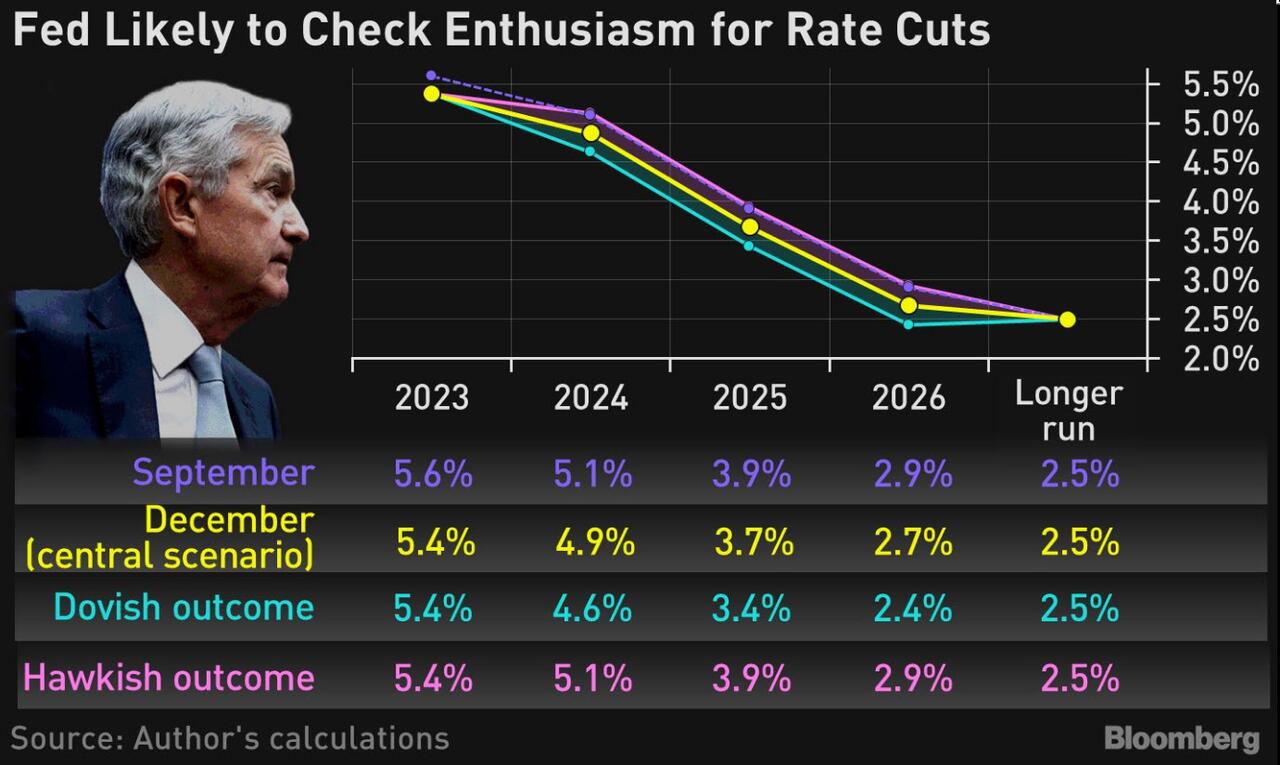
The yield on two-year Treasuries climbed more than 12 basis points at the end of last week after the jobless rate for November, defying predictions, headed lower to 3.7%, hovering near the lowest it has been in decades. A dot plot along the lines portrayed above would send two-year Treasury yields higher toward 5%.”


USD futures plunged to 103.28 this morning.  Mid-Cycle support may act to reverse this probe, since the Cycles Model suggests the rally may resume to the end of the year.  The Cycle Top at 106.86 may be the target.


Crude oil futures continue tis decline this morning to 67.72.  The Cycle Bottom at 66.21 may be the intended target.  However, the trendline at 63.57 may be at risk of being broken, which may change the near-term outlook.

ZeroHedge comments, “Oil plunged again today, on pace for its longest weekly losing streak since 2018, after inflation data prompted some fears that The Fed will not be cutting rates as soon as many hoped.

Traders are worried that the Fed does not have inflation under control and will have to keep the foot on the accelerator when it comes to interest rates, said Phil Flynn, an analyst with the Price Futures Group.

The oil market shrugged off reports from The BBC that Yemeni’s Iran-backed Houthi rebels hit a Norwegian tanker with at least one missile, leading to a fire.

“Add a drop off in China’s crude imports to 5-month lows to our current lull in refined products demand, we’re seeing an increasingly well-supplied crude market,” said StoneX’s Kansas City energy team.”


Gold futures dropped even lower to 1988.00 this morning as the decline continues beneath Intermediate support/resistance at 2002.00.  The decline may continue to the year-endwith the neckline at 1823.50 in sight.  Should that be brokien, further declines may be in store.


Posted in Published | 2 Comments

December 12, 2023

8:00 am

Good Morning!

NDX futures made an overnight high of 16270.70 as it relentlessly powers higher on day 274 of the current Master Cycle.    The liquidity hose is running dry with buybacks ending this week.  It will all be on the backs of retail investors for the next  five weeks.  CPI is being announced this morning and the FOMC is meeting with their report due Wednesday afternoon.  A reversal is expected.

Today’s options chain shows Max Pain at 16225.00.  Long gamma may begin at 16250.00 while short gamma starts at 16200.00.

ZeroHedge remarks, “Losing the rates connection?

NASDAQ has traded in close tandem with rates since July. The latest “mini” decoupling is noteworthy…

Source: Refinitiv

Not your normal recovery

“Up until recently, the path toward a new SPX record conformed with the average recovery looking back at all of the corrections and bear markets through the 50s. However, the rally in Nov changed things. Typically, the recovery after a 25% drawdown starts to lose steam after Y1 (+9% avg.), with returns over the 2Y matching the same +9% pace. At present, we are up ~30% from when we first broke the -25% boundary, and the current 484 days since we last saw an new ATH is ~half a trading year ahead of when the historical average suggests we might be ‘due’ for one”


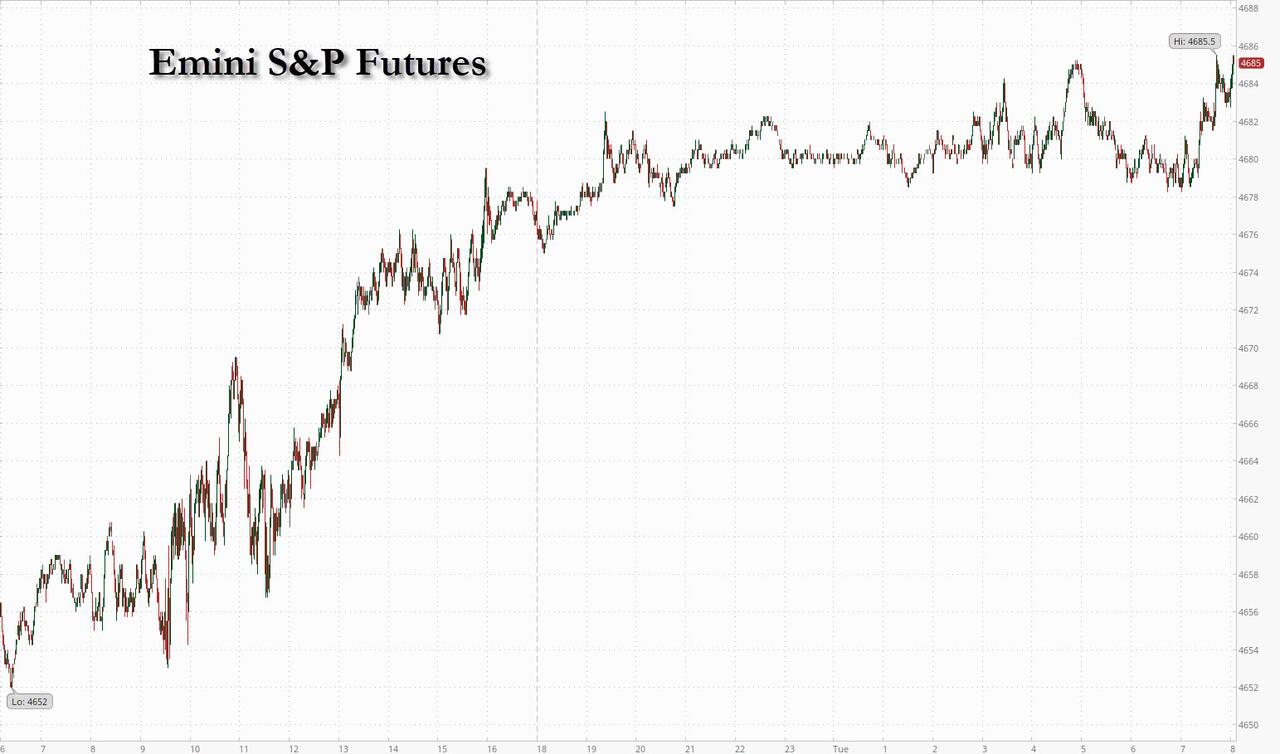
SPX futures are still climbing, currently at 4631.00.  Should the rally persist, the Cycle Top may be the target at 4675.23.  However, the Cycle is stretched to an extreme and may be susceptible to a sudden reversal.

Today’s options chain shows possible Max Pain at 4620..00.  Long gamma starts at 4625.00 with an outlier at 4600.00.  Short gamma may begin at 4615.00, becoming strong beneath 4600.00.

ZeroHedge reports, “S&P 500 futures were little changed as markets enter the first of the two last big days of 2023, with CPI on deck today and the FOMC decision due tomorrow. As of 7:55am ET, S&P futures were up 0.1% to 4,683, trading in a very tight range overnight as equity traders were reluctant to make big bets ahead of this week’s heavy load of economic data and interest-rate decisions, Nasdaq futures gained 0.3% ahead of the November inflation report; The Bloomberg dollar index slipped 0.3%. Treasuries rose across the curve, with 10-year yields falling four basis points to 4.19%. The latest NY Fed survey showed a decline in year ahead inflation expectations, dovetailing the Univ. of Michigan print on Friday; today is all about the CPI.


VIX futures are hovering near the low.  The Master Cycle appears to have been made last Friday.  However, there may be room for another probe lower, as the structure may be incomplete.

Tomorrow’s options chain shows Max Pain at 16.00.  Short gamma extends from 12.00 to 15.00.  Long gamma may begin at 21.00.


TNX futures had been drifting lower, to 41.42 before the CPI report snapped it higher.  This may have been anticipated by the Cycles Model which had called for a burst of trending strength early this week.  TNX had made its Master Cycle low last Thursday and is due to rise until early January.

ZeroHedge observes, “In today’s second Treasury auction (as a reminder, thanks to the FOMC we are on a very truncated issuance schedule this week), and just 90 minutes after an ugly 3Y sale, moments ago the Treasury sold $37BN in 10Y paper in the form of  a 9 Year 11-Month reopening of Cusip CJJ1, which was almost as ugly as the day’s earlier auction.

The last 10Y auction of the year priced at a high yield of 4.296%, which while a notable drop from last month’s 4.519% and the highest since September’s 4.289%, also tailed the When issued 4.282% by 1.4bps, which as shown below, was the 3rd consecutive tailing 10Y auction, and the 9th tail in the past 10 auctions. An even more remarkable statistics, is that since the end of 2021, there have been 24 10-Year auctions, of which only 4 have not tailed, suggesting that demand for benchmark US paper is in a slow-motion collapse.”


USD futures sank to 103.07 and challenging mid-Cycle support at 103.34 before bouncing back above that support on the CPI report.  The Cycles Model calls for a renewal of trending strength this week.


Crude oil has declined this morning to 69.53.  It may be testing its Cycle low.  The likelihood is that last week’s low may remain intact as WTIC emerges from an oversold condition.  The Cycles Model infers that the new trend may be strengthened by the end of the week.


Posted in Published | 1 Comment

December 11, 2023

9:56 am

BKX, our liquidity proxy, has slipped beneath its Cycle Top at 88.88.  Friday’s peak at 88.95 was on time at day 259.  Although there is an outside possibility of probing to the neckline at 90.50, the upside risk is minimal compared to the potential downside target.  It is rare to see this large a retracement within a Wave (3).  In addition, there are multiple signs of a potential panic decline into mid-January.

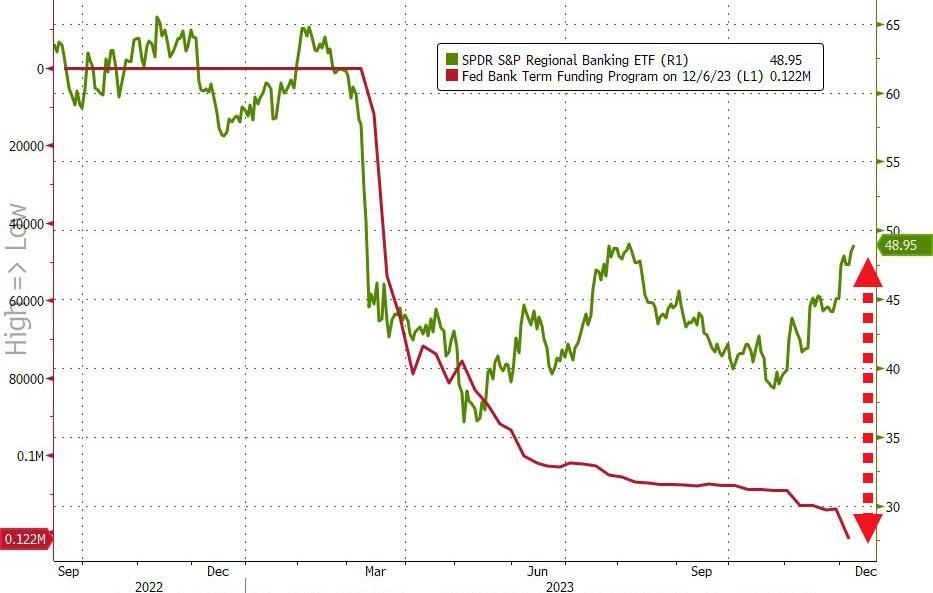
Late Friday ZeroHedge reported, “Yesterday we found out that inflows to money-market funds continue to be huge ($290BN in six weeks), and more importantly, regional banks’ usage of The Fed’s BTFP bailout facility surged to a new record high (even as regional banks surged…

Source: Bloomberg

And so, with that shitshow in mind, we await the glorious manipulation of The Fed’s bank deposits data to reinforce that equity confidence.”


8:00 am

Good Morning!

The NDX futures could not break above 16100.00 over the weekend as it lagged behind blue chips and small caps.  This morning it is lower, although it hasn’t declined back beneath short-term support at 15926.08, where an aggressive sell signal lurks.  As mentioned last week, NDX may lead the pack in the decline.

Today’s options chain shows Max Pain at 16130.00.  Long gamma (what little there is) may begin at 16175.00 while short gamma starts at 16120.00.

ZeroHedge highlights last week’s activity, “The S&P 500 rose for a 6th straight week and made new YTD highs, as investors digest a busy week of macro data and await US CPI + the latest central bank policy decisions next week. Bitcoin Sensitive stocks, High Retail Sentiment, and Regional Banks outperformed on the week, while Commodity Sensitive stocks, China ADRs, and Renewables were under pressure.”


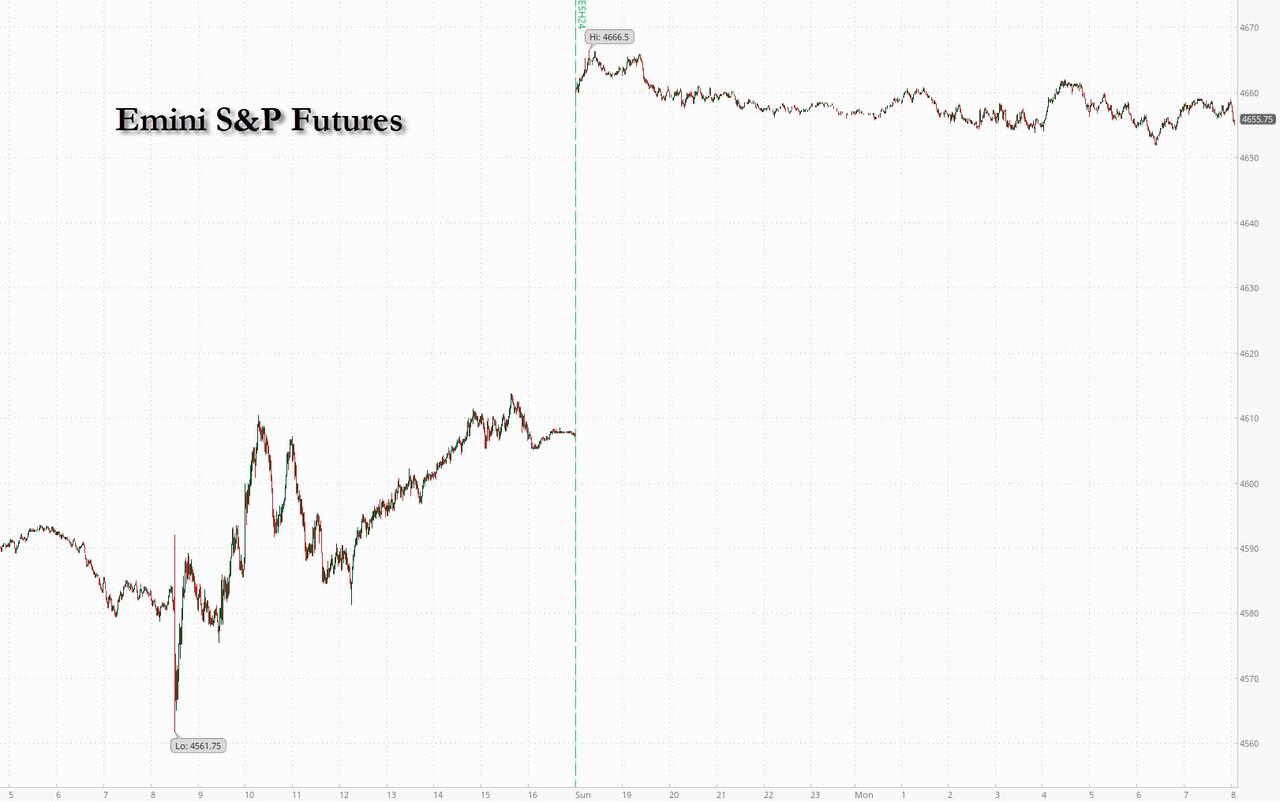
SPX futures made a marginal new high at 4609.70. then settled down to hover near 4600.00.  Today is day 273 of the Master Cycle in a very stretched situation.  The powers that be may attempt to push the markets higher as the FOMC meeting concludes on Wednesday, a noticeable consistent practice.  However, stocks are overbought and may react quickly to bad news.  The chances of the rally extending beyond Wednesday are practically nil, based on historic data.

Today’s options chain reveals Max Pain a t4595.00.  Long gamma may start at 4600.00 while short gamma begins at 4590.00.  The tension is rising and anything beyond a flat market may produce some fireworks.

ZeroHedge reports, “US equity futures are flat while global markets posted only modest moves at the start of a busy week of economic data and central bank meetings that will test optimism among investors that interest rates will soon head lower. As of 7:55am ET, S&P500 futures contracts fell just under 0.1%, off the session’s lows, while Nasdaq futures were also modestly lower. The dollar is higher, while 10Y yields are rapidly reversing all recent declines and up again on Monday, hitting a 1-week high of 4.28%; in commodities oil is recovering from the market’s longest weekly losing streak in five years while crypto tokens are swinging violently as Bitcoin drops back toward $40,000. Keep an eye on retailers following the weekend news of an LBO bid for Macy’s: XRT is up almost 16% from its Oct lows and sits about 11% from its 52-week high. Today’s macro data focus is the Fed’s 1-year inflation expectation; it may reflect similar optimism as the Univ of Michigan data which saw 1-year expectations fall from 4.5% to 3.1%.


VIX futures are consolidating within Friday’s trading range after Friday’s extended Master Cycle low on day 270.  The Cycles Model suggests a burst of strength may occur imminently.  Should the reversal take place, VIX may rally with trending strength through the year-end.

Wednesday’s options chain shows Max Pain at 16.00.  Short gamma resides from 12.00 to 15.00.  Protection is very cheap as investors anticipate easing of interest rates.


TNX edged higher this morning as TNX has bounced from neckline support at 41.00.  A burst of trending strength may be imminent as TNX re-establishes its uptrend.  The bounce off the double support may imply an aggressive buy signal.  This rally may prove, once and for all, that the Fed has little to do with interest rates.

ZeroHedge observes, “Biden Says Jobs Numbers Should Deter More Fed Rate Hikes

Bloomberg reports Biden Says Jobs Numbers Should Deter More Fed Rate Hikes

President Joe Biden said Friday’s jobs report shows the labor market remains resilient as inflation continues to ease, an economic “sweet spot” that he said shouldn’t prompt the Federal Reserve to raise rates further.

The comments marked a rare example of Biden weighing in on central bank policy making. They came as the president gears up for a reelection campaign that will be decided in part on his stewardship of the US economy, which voters have rated poorly, polls show.”


USD futures declined to 103.55 before moving back into Friday’s trading range.  The Cycles Model suggests today may be a day of strength for USD.  If so, it may jump-start a brisk move higher until the year-end.  Two likely targets for this move are the Cycle Top at 106.85 and the Head & Shoulders neckline at 107.50.


Crude oil is consolidating inside last Friday’s trading range where it made a reversal out of Thursday’s possible Master Cycle low.  Should that be correct, crude may be in for a two-month rally, taking it back to the  Cycle Top at 91.13.


Gold futures are testing Intermediate support at 2002.26 this morning.  Should it break through, the next target may be the mid-Cycle support at 1969.00.  The Cycles Model suggests a burst of trending (downside) strength early this week followed by another later in the week.  The likely target may be the neckline at 1825.00.


Posted in Published | 1 Comment

December 8, 2023

8:30 am  Sorry for the delay.  Internet issues being resolved.

Good Morning,

NDX futures have fallen back beneath short-term support at 15906.84, but appears to be bouncing.  NDX is on an aggressive sell and is expected to show increased volatility.

Today’s options chain shows Max Pain at 16000.00 with calls outnumbering puts at a ratio of 2-1.  However, there is an anomalous finding of a large number of puts at 16070.00.

ZeroHedge remarks, “Ahead of today’s jobs report (which we previewed as being focused mostly on the unemployment rate), we said that the whisper was for a stronger report due to the mandatory political talking points for the White House taking credit for all those strikers coming back to work…

… and lo and behold, that’s precisely what happened, with the total number of job gains in November coming in at 199K, above last month’s 150K and, more importantly, well above the consensus forecast of 183K.”


SPX futures continue to consolidate in its two-week trading range.  Support is at 4544.00 where an aggressive sell signal awaits.  This phase of the Cycle takes great patience and alertness, as the long consolidation acts like a coiled spring.

Today’s options chain shows Max Pain at 4580.00-4585.00.  Long gamma starts at 4600.00 while short gamma may begin at 4575.00.  Options also appear tightly wound, waiting for a trigger to set off an explosive move in either direction.

ZeroHedge reports, “S equity futures and bonds both dropped after a tech-fueled advance in the previous session, while the dollar and oil gained in what were small moves ahead of the November jobs report while will provide more information on whether the labor market is cooling fast enough to bring the Federal Reserve closer to cut rates as soon as March (full payrolls preview here). As of 7:55am ET, S&P futures dropped 0.1%, erasing a part of Thursday’s rally while Nasdaq futures dropped 0.3%.  Treasury 10-year yields approached 4.2%, rising for a second day. The dollar was little changed as the Japanese yen weakened, paring its biggest gain since January, while the Canadian dollar reversed four sessions of losses to edge higher. Oil futures rose 1.5% from the lowest closing level since July. In macro, the day’s big event is the jobs report where consensus expects a 183K print and unemployment remaining flat at 3.9%


But, after the jobs report, the markets are confused.  ZeroHedge observes, “Flat wage growth (hotter than expected MoM), lower unemployment rate (good news is bad news), more jobs added (good news is bad news)… but the narrative-delivers claim “goldilocks”.

This looks anything but goldilocks and the kneejerk reactions agreed with rates and the dollar higher (hawkish) and stocks lower.

But that has basically all been unwound now.

Dollar is down…


VIX futures briefly spiked to 13.17before moving lower this morning.  VIX is another tightly wound spring, ready to violently break out.  The Cycles Model calls for trending (upside) strength to return early next week.

Next Wednesday’s options chain shows Max Pain at 16.00.  Short gamma reigns from 12.00 to 15.00.  Long gamma of any consequence is not to be found.


TNX lurched higher to 42.79, before subsiding, still at a substantial increase.


Posted in Published | 1 Comment

December 7, 2023

10:31 am

BKX, our liquidity proxy, has met its Cycle Top yesterday at 88.56 on day 257 of the Master Cycle.  It has made a Key Reversal, as well.  The month-long rally in BKX mirrored the decline in TNX within 31.42 days.  Are banks little more than mortgage REITS?  If so, the articles below have significance.

ZeroHedge observes, “At the Sohn Conference in London on Wednesday, Carson Block, the founder of Muddy Waters Research, warned that Blackstone’s Mortgage Trust (BXMT) is facing a “perfect macro storm.” He suggested that a crisis in commercial real estate could potentially lead to a “liquidity crisis” in the trust.

Block told attendees at Sohn that Muddy Waters is short BXMT because “borrowers will be unable to refinance and repay” the trust. He cautioned that BXMT is at “risk of a liquidity crisis” and explained, “This is not a story where bad people have done bad things, they are just unlucky.”

ZeroHedge comments further, “The Federal Reserve’s reverse repo (RRP) facility has been a key support for liquidity and stocks this year. But it is falling. As it approaches zero, markets face much less benign conditions as a formidable tailwind is extinguished.

Everyone’s a plumber, or at least should be.

Not in the sense that we all need to get handy with a spanner, but in that every investor should have at least a basic knowledge of financial plumbing in the modern central-banking regime.

A good place to start is the Fed’s RRP facility.”


8:00 am

Good Morning!

NDX futures have declined to a morning low of 15769.40, beneath Short-term support at 16877.91, before a bounce.  It is on an aggressive sell signal.  The signal becomes confirmed beneath Intermediate support at 15335.75.  The 50-day Moving Average is at 15180.91.  The new Master Cycle in the NDX has passed the Cyclical marker of one standard deviation in time from its high, reducing the capability of making a new high to approximately 10% or less.    Bullish momentum may now be dead.

Today’s options chain shows Max Pain at 15880.00.  Long gamma may start at 15900.00 while short gamma begins at 15850.00.

ZeroHedge remarks, “The latest quarterly hedge fund monitor report from Goldman (discussed here) was, as usual, an informative snapshot into the stock and flows of the fast (if no longer smart) money, but most importantly, revealed that – as most had long expected – hedge funds are nothing more than glorified momentum chasers (aka “levered beta monkeys”), with Goldman’s Ben Snider revealing that “hedge fund crowding reaches new records as popular positions enjoy momentum” …


SPX futures made a new low at 4543.10 as bullish momentum withers.  Short term support (not shown on the daily chart) is at 4534.11, where an aggressive sell signal awaits.  The 100-day Moving Average is at 4421.80, where a confirmed sell signal lies.  SPX is now approaching 3 weeks of relatively flat performance, a rarity that may not last.  New to the chart is a Head & Shoulders formation that most analysts won’t catch.  This implies that the SPX may revisit the October 2022 low in the decline that follows..

Today ‘s Options chain shows Max Pain at 4580.00.  Long gamma may start at 4600.00 while short gamma is running hard beneath 4560.00.  The options market may become unruly.

Zerohedge reports, “S equity futures are mixed with tech outperforming notably, as both GOOG and AMD rose +2.8% and 3.7% pre-mkt, respectively. As of 8:00am ET, S&P futures were up 0.1% to 4,560 and Nasdaq futures gained 0.2%.  10Y Treasury yields rose 5 basis points as Japanese bonds tumbled and the yen surged 1.6% against the dollar amid renewed speculation that the Bank of Japan will scrap the world’s last negative interest-rate regime as soon as the Dec 19 BOJ meeting (spoiler alert: it won’t). Of course, if the BOJ does indeed hike yields, US yields will move sharply higher. Elsewhere, the USD is weaker and commodities are higher led by a rebound in the energy complex; WTI is back above $70. Today’s macro data is on Job Cuts, Initial/Continuing Claims, and Consumer Credit. Tomorrow’s NFP data is the more market moving data.”


VIX futures are rising, hitting 13.28 this morning.  The VIX is coiled like a spring, ready to burst out.

Next Wednesday’s options chain shows a lively interest and possibly Max Pain at 15.00.  Short gamma resides at 14.00 while long gamma rests at 23.00, but little interest above that.  This makes buying protection against a decline very cheap.

ZeroHedge observes, “JPY breaking the huge trend line

JPY continues moving aggressively. We are taking out the big trend line as of writing, trading well below the 100 day moving average. The 200 day is at 142.

Source: Refinitiv

Not all vols are dead

The moves in the JPY are getting relatively little global “attention”. JPY 1 month volatilities at the highest levels since August, while VIX remains in “no care” mode.”


TNX may finally be in reversal on day 265 of its former Master Cycle.  If so, we may see yields rising into the year-end.  The reason that this Cycle has attracted so much attention is that it was “straight down” for 31.42 days, where most Cycles are parabolas.

ZeroHedge remarks, “Extreme Bond-Market Positioning Heralds Pain Trade

Disappointments are the deepest when just about everyone in the markets is positioned for the same outcome.

With the disinflationary narrative in the US evolving in line with the Fed’s estimates, traders are bracing for that definitive inflection point in the economy that will send Treasuries soaring.

In fact, traders are clamoring for bonds relative to stocks at a pace close to the fastest in two decades, possibly setting a low bar for disappointment – and potentially making it the markets’ next big pain trade.


USD futures continue to consolidate their gains above the mid-Cycle support at 103.32.  The Cycles Model infers that the rising dollar may continue to the end of December.


Crude oil made a new low at 69.28 before bouncing.  The last master Cycle may have been completed on November 30.  If so, a bounce may develop to the mid-Cycle resistance at 78.09 before the decline may resume for up to two months, due to the breakdown beneath the November low.   Critical support is at 64.30.

ZeroHedge opines, “It is often useful to contrast rhetoric with reality. The phrase, an “energy transition,” the goal to replace hydrocarbons, has origins that trace back to a 1977 speech by President Jimmy Carter. It was an “address to the nation” that commandeered national media, as is the convention on occasions when presidents seek to deliver momentous news. That address became known, infamously, as the “MEOW” speech because of President Carter framing the “energy challenge” as the “moral equivalent of war.” We find a lot of familiar rhetorical turns of phrase in that speech, not least the urgent need for a putative “energy transition” as being “the greatest challenge that our country will face during our lifetime,” and the need to “act quickly” in order to “have a decent world for our children and our grandchildren.” Back then, the urgency was motivated by the belief the world was running out of oil and natural gas.”


Gold futures are consolidating beneath the Cycle Top, on a sell signal.  The next critical 9intermediate) support is at 1999.73.  Probable reversal areas are the Neckline at 1825.00 and its target at 1561.00.  This decline may last through the end of January.


Posted in Published | 1 Comment

December 6, 2023

10:50 am

BKX has hit the Cycle Top at 88.56 this morning and may be in reversal, as it has declined to 88.04 as I write.

9:46 am

BKX, our liquidity proxy, is fast approaching its nemesis, the Cycle Top at 88.56 on day 257 of its Master Cycle.   The “firehose of liquidity” was meant to keep the banking system alive, only to sputter out at the peak.  There may be yet another day of rally, but once it hits the Cycle Top, the curtain is drawn.  The Cycles Model suggests the decline may extend in force to mid-January.

ZeroHedge remarks, “Several weeks ago, as the Fed’s Overnight Reverse Repo tumbled below $900 billion for the first time since June 2021 amid a growing debate of where and when the Fed’s reserve scarcity constraint will be hit, we warned that liquidity is rapidly approaching the reverse repo constraint level which could emerge as soon as the RRP facility dropped to $700 billion, at which point the market’s all-important credit plumbing will start to crack.”


8:10 am

Good Morning!

NDX futures rose to 15961.00 this morning in a bounce off Short-term support at 15847.00.  Overhead resistance is near 16000.00.  Today may be the last test of 16000.00 as money flows have weakened.  Money flows have come from (1) Short covering, (2) Massive stock buy backs, coupled with insider selling, (3) A virtual firehose of liquidity from the Fed, (4) Wishful thinking that the Fed would soon ease and (5) Overconcentration in the Magnificent seven (see below).

Today’s options chain shows Max Pain at 16000.00, a highly contested level.  Dealers have taken short positions at 100 point intervals beneath that level, while there is little long gamma left.

ZeroHedge remarks, “Over the weekend, when observing the multiple violent rotations taking place below the market’s remarkably calm surface following November’s frenzied breakout, we pointed one that stood out like a sore thumb: the rotation out of the “Magnificent 7” recent market darlings and into “trash” companies such as non-profitable tech. And even after a modest reversal in this trend today, one can still see just how out of favor the formerly most desired companies have become at the expense of some of the worst of the lot (the thinking is that the Fed slashing rates so fast it would imply the US is in a brutal recession in 2024 is somehow good for said “trash” companies).


SPX futures are at 4583.90 this morning in what may be the final probe at 4600.00, as well.  The global equities Cycle is near its top at the time that the liquidity plug may be pulled.  The Cycles Model is neutral this week, aside from Friday’s Master Cycle high, made on day 263.   The chance of another high has decreased substantially.

Today’s options chain shows Max Pain at 4570.00.  Long gamma starts at 4575.00 while short gamma may begin at 4550.00.

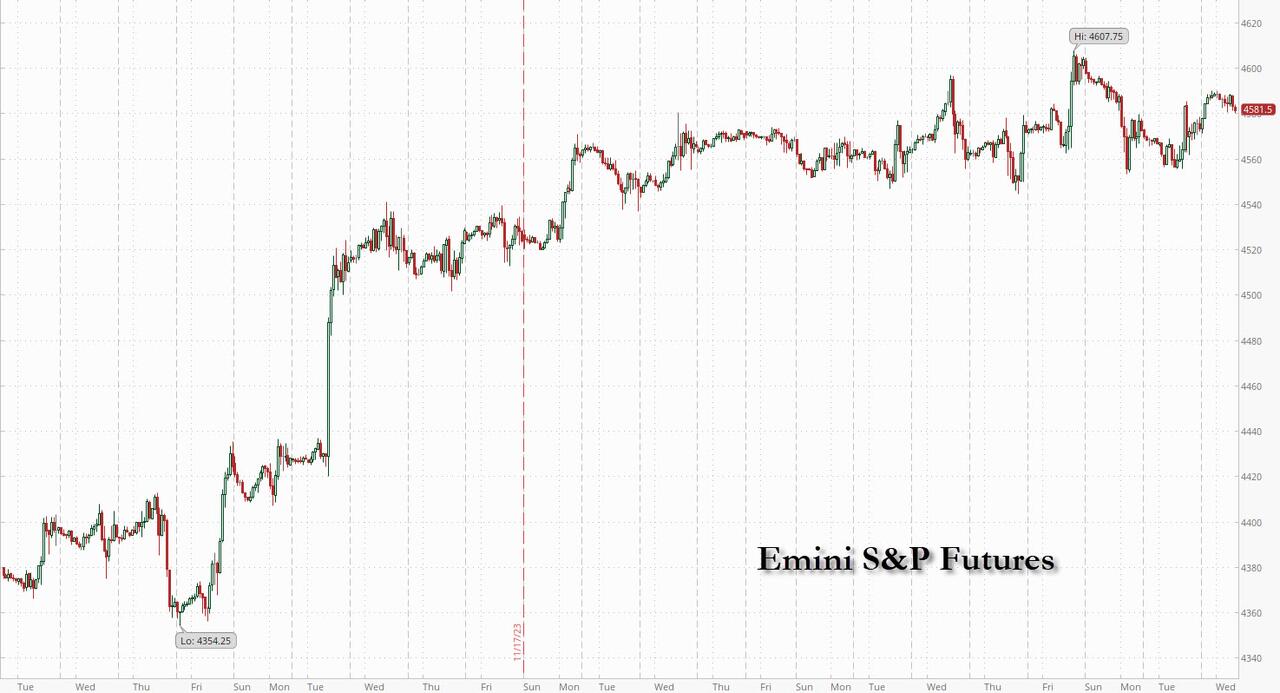
ZeroHedge reports, “US equities were set for modest gains on Wednesday even as they drifted lower from session highs, as a weakening labor market boosted bets that the Federal Reserve is done with interest-rate hikes and could pivot to monetary easing sooner, even as we are approach levels of priced-in rate cuts which some say guarantee a recession. As of 7:30am ET S&P 500 futures were up 0.1% to 4,581.50, wile Nasdaq futures rose 0.3%. Asian stocks rebounded from a three-day losing streak, while Europe’s Stoxx 600 index traded near the highest level in four months. A rally in bonds stalled with the US 10-year yield rising toward 4.2%. The US Dollar is lower, its first down day this week. Commodities are mixed with Energy weaker, Ags stronger, and base outperforming precious. Bitcoin traded close to the $44,000 mark in the longest winning streak for the largest cryptocurrency since May, fanned by expectations of looser monetary policy. The macro data focus today is on ADP, 23Q3 readings on productivity/labor costs, mortgage applications, and the trade balance.”


VIX futures sank to 12.69 this morning before a bounce.  At the same time, VIX may have hit its “floor” on November 24th, which is being tested.  The Cycles Model suggests the remainder of the week may be relatively quiet while trending strength may return early next week.

Today’s options chain shows Max Pain at 14.00.  Short gamma rules from 12.50 to 13.50.  Long gamma starts at 15.00 and may extend to 39.00.


TNX futures hit a new Master Cycle low at 41.37.  The cash market registers its low at 41.40.  Today is day 264 in the Master Cycle, at one standard deviation (in time) from the mean.  That may indicate it’s time for a reversal.  Another indicator is the neckline at 41.00, acting as a very solid support.  In addition TNX shows a double strength indicator, suggesting that the reversal may be dramatic.  Contrary to the sage opinions of the experts, all hell may be about to break loose.

RealInvestmentAdvice comments, “After hiking rates by 5.25% since March 2022, the Fed is in a wait-and-see period, commonly deemed a pause. Since the Fed started hiking rates, inflation has declined meaningfully but remains moderately above the Fed’s 2% target. The economy continues to thrive, fueled by a strong labor market.

Despite the good news, a dark cloud lingers on the horizon. The Fed’s primary fear is that the lag effect of prior rate hikes has yet to impact the economy fully. They desire a soft landing, implying little economic degradation. But a much stronger downturn can’t be ruled out in their minds or ours. Given the odd juxtaposition between strong economic growth and recession fears, a Fed pause is the most likely action.”

ZeroHedge counters, “The rally in Treasuries is beginning to look tired. Yields are moving in lock-step with short-term rate-cut expectations, which are looking overcooked given the loosening in financial conditions has likely helped push the timing of the next NBER recession further out.

Treasuries are becoming progressively overbought after an impressive rally of over 5% since mid-October. The rally was not unexpected as it came off oversold conditions, but the pendulum has, as usual, swung too far in the other direction, where the drop in yields is hard to square with economic expectations.”


USD futures may be consolidating above the mid-Cycle support at 103.31 as the new Master Cycle gains traction.  USD is on a buy signal that may last through the end of the year.  This may have escaped the notice of the investment community.  However, trending strength may be coming back next week.


Crude oil futures are making a new low at 70.56 this morning.  At this rate, the Head & Shoulders target and Master Cycle low may be only days away.  WE are watching this low very carefully, as it may indicate more downside to come.

ZeroHedge remarks, “Oil prices fell for the fourth straight day to close at five-month lows today as US oil exports neared record highs amid record high domestic crude production flooding the market, overshadowing Saudi Arabia’s pledges that OPEC+ will deliver on its planned production cuts.

“The voluntary element of the deal left the markets questioning whether the supply reduction would actually come into effect,” said Fiona Cincotta, financial market analyst at StoneX.

Meanwhile, the demand outlook is being hurt by rising concerns about China, she said.”


Gold futures are consolidating and may retest  the Cycle Top at 2056.14 before moving lower.  The Cycles Model suggests the new trend may last to the end of the year.  What happens after that depends on how much damage is done to the uptrend.


Posted in Published | 1 Comment

December 5, 2023

10:45 am

GKX appears to be on a buy signal, but with only 1-2 weeks left in the current Master Cycle, there is a risk of another low.  Liquidity is becoming rarer and some domestic agricultural commodities are still declining.

ZeroHedge observes, “Corn prices tumbled to a three-year low as mounting supplies from the US and Brazil collided with sliding demand. This downturn helped push down the Bloomberg Grain Spot Subindex, which tracks near-term futures contracts for soybeans, corn, and wheat, leading to its largest annual decline in a decade.

Bloomberg Grain Spot Subindex records the worst yearly slump since 2013.

Ag traders are waiting for a US Department of Agriculture’s monthly WASDE report on Friday to gauge the status of foreign and domestic harvests.”


10:20 am

BKX may have begun its descent today, on day 256 of the current Master Cycle.  The Cycle Top at 88.50 has not bee reached, leaving room for a small probe higher.  However, it may not be profitable waiting for the last tick, should there be one.  It appears that, should the reversal be in effect, the decline may last to the January options expiration.  The Head & Shoulders formation is in effect.


8:00 am

Good Morning!

NDX futures are lower, but within yesterday’s trading range, having bounced at 15732.00.  It is beneath the Short-term support at 15836.00, giving it an aggressive sell signal.  The next level of support where the confirmed sell signal lies is at 15287.67.  The Cycles Model suggests new strength may be added to the decline today.

Today’s options chain shows Max Pain at 15830.00, where both types of investors have the least gain.  Long gamma starts at 15900.00 while short gamma begins at 15800.00.

ZeroHedge comments, ” While we have discussed the various micro drivers and catalysts behind the “November to Remember”, which included record buying by CTAs, record stock repurchases by corporations (more than $5bn per day), record dealer gamma, a brutal hedge fund short squeeze, a flood of retail buying of meme stocks, favorable seasonals and a Q3 earnings season that came in stronger than expected and ended the earnings recession of the past year, one may as well just forget about all of these and simply consider the macro elephant in the room, by which we mean the monster liquidity injection by central banks – and especially the Fed – last month.

According to Goldman calculations (available to pro subs in the latest must read “Global liquidity update” report), with $350BN added in November, liquidity (in USD terms) from the G4 central banks + the PBOC was nothing short of a fire hose.”


SPX futures are trading at the lower end of yesterday’s trading range.  It remains above the Short-term support at 4512.00.  One may consider an aggressive short position beneath 4525.00-4537.00.   The Cycles Model suggests a bit of strength may add to the decline today.  The 100-day Moving Average lies at 4421.00, where the sell signal is confirmed.

Today’s options chain shows Max Pain at 4565.00.  Long gamma starts at 4580.00 while short gamma begins at 4530.00.

ZeroHedge reports, “US stocks were set to extend Monday’s drop into a second day after hitting 20-month highs, as the recent rally looks increasingly stretched and traders scale back rate-cut bets while Chinese stocks tumbled to fresh five year lows after Moody’s downgraded China’s credit outlook to negative on soaring debt. As of 7:40am ET, S&P 500 futures slid 0.4%, trading at session lows, after the benchmark rose last week to its highest since March 2022 on bets the Fed would soon pivot to monetary easing; Nasdaq 100 futures dropped 0.5%. Bond yields eased as did the USD; 10Y TSY yield dropped 2bps to 4.22%. Commodities were seeing a bid within Ags and Energy while metals underperformed on China weakness despite better than expected PMIs. Bitcoin held near a 19-month high, just below the $42,000 mark. Today’s macro data focus is on JOLTS job openings and ISM Services (52.3 consensus vs. 51.8 prior).”


VIX futures are also consolidating.  An aggressive buy signal (apart from the Cycles indicator) lies above 14.30.00.

Wednesday’s options chain shows Max Pain at 14.50.  Short gamma resides between 12.50 and 13.50.  Long gamma rises at 20.00, but not much conviction to 30.00.

ZeroHedge comments, “The perfect flow Tsunami

We have had a perfect flow Tsunami over the past few weeks where “everyone” needed to buy equities. This has played out now and, more than on the margin, things will get incrementally less supportive from here. Our experience is that inflection points like these are normally a good time to put on short term tactical shorts. And guess what, doing it via options is record cheap & attractive.

Holding out for the last $20bn…?

Do you fade the CTAs here after close to $100bn of fast buying in US equities or do you wait for them to go back to historic max longs that would imply a $20bn or so of more buying?”


TNX made a new Master Cycle low at 41.99 on day 264.00.  An extension such as this is not unusual, being less than 1 standard deviation from the mean.  Once the reversal is complete, we may see TNX rally to the first week of January.  The ;target may be 53.00 or higher.

ZeroHedge remarks, “Front-end Treasuries have rallied big in the past month, but labor market data will pose a key test for traders this week.

Yes, Federal Reserve Chair Jerome Powell did reiterate on Friday that the central bank is prepared to tighten policy further, but was just jawboning against the recent loosening of financial conditions rather than a statement of real intent given the clear disinflationary momentum we have seen of late.

The two-year Treasury yield, which was hovering around 5% before softer-than-inflation readings for October, has since shed some 40 basis points. While the decline has made the maturity look rather rich on the curve, some optimism is justified by comments from Governor Christopher Waller who became the first Fed official to explicitly open the door to rate cuts.”

However, ZeroHedge observes, “Expectations of rate cuts in the US are liable to come unstuck as easing financial conditions raise the risk the Federal Reserve returns to the fold with another hike…

Be careful what you wish for.

The market’s increasing zeal for lower rates has rekindled the so-called everything rally. But if it persists it contains the seeds of its own destruction as it ultimately pushes the Fed to recommence raising rates, wrongfooting growing expectations of rate cuts, and leaves stocks and bonds prone to selling off.”


USD futures are consolidating in the high end of yesterday’s trading range.  It made a buy signal on Friday and is expected to continue rising to the end of December.  The likely target may be the neckline of the Head & Shoulders formation near 107.50.


Gold futures are even lower today, at 2033.55 after a Key Reversal made yesterday.  Last Friday I had a private conference on gold, where I opined that it could not make a new high.  I was wrong on that count.  However, my reasoning was that gold was due for a strong reversal early this week, which did take place.  The Cycles Model suggests the decline may last to the end of December.  The tow targets may be the mid-Cycle support at 1965.00 or the 50-day Moving Average at 1957.00.


Crude oil futures made a new low at 72.18 before a slight bounce.  The sell signal remains in effect until the end of the month.  The Head & Shoulders target is in effect with strong support at the Cycle Bottom at 65.08.  A drop beneath 63.57 may forecast a further decline.


Posted in Published | 4 Comments

December 4, 2023

3:50 pm

BKX is nearing its Cycle Top resistance at 88.43 today, day 255.  That means a high likelihood of a reversal tis week.  The Head & Shoulders target is still active and may influence the outcome of the new Master Cycle that extends through mid-January.  Prepare yourselves.  Bank runs are no fun.

XeroHedge observes, “The Secretary of the Treasury and the Financial Stability Oversight Council would like you to believe that climate-change and unregulated non-bank financial institutions are the biggest threats to financial stability. If financial regulators were actually safeguarding the integrity of banks and financial markets, they would recognize, and do something about, the largest immediate threat to financial stability: the nearly $1.3 trillion of unrealized interest rate related losses in the regulated banking system.  This is the real systemic risk today.

The $1.3 trillion is my estimate of the banking system’s total unrealized interest rate related losses as of June 30, 2023. Using bank regulatory data, I estimate that the banking system has total unrealized losses of about $548 billion on bank-owned securities and about $726 billion in interest rate driven losses on bank loan and lease portfolios.”


10:15 am  Technical difficulties… we are not getting updated charts

Good Morning!

SPX futures have declined to a low of 4555.60 this morning.  Short-term support lies at 4537.00-4542.40.  An aggressive sell signal may be given beneath that level.

Today’s options chain shows Max Pain at 4585.00  Long gamma starts at 4600.00 while short gamma begins at 4570.00.

ZeroHedge reports, “US equity futures, most European bourses and Asian markets as well as global bonds all retreated after five consecutive weeks of gains, as traders paused to digest November’s blockbuster rally and to consider the case for interest rate cuts, which they aggressively priced in after Powell’s “not as hawkish as feared” fireside chat on Friday. As of 8am ET, S&P futures were lower by 0.3%, dropping back below the 4,600 unwinding a portion of Friday session rally (which however left hedge fund bruised and battered as the most shorted stock soared much more than the HF VIP basket); USD is stronger and commodities are weaker: crude futures are lower by around 0.4%, adding to Friday losses; 10-year Treasury yields added five basis points to 4.25%. Despite the rise in the DXY, Bitcoin surged past $41,000, while gold briefly touched an all time high. With the Fed in its blackout window, the macro data releases will be the key focus; no treasury auctions this week. Today, that focus is on factory orders and durable/cap goods; this week we get a deluge of labor data starting with the latest reading on US job openings (or JOLTS) tomorrow, followed by ADP’s National Employment Report on Wednesday and non-farm payrolls on Friday.”


VIX futures have elevated to a morning high of 13.70 thus far.  A breakout above 14.30 gives us an aggressive buy signal.

Wednesday’s options chain shows Max Pain at 14.50  Short gamma may exist between 12.50 and 14.00.  Long gamma may start at 15.00 but it is not well populated.


TNX has risen to 42.91 thus far this morning.  Futures made a new low this morning at 41.96, ending the old Master Cycle on day 263.  The Cycles Model indicated a high level of positive trending strength arriving tomorrow.

ZeroHedge observes, “There are fertile conditions for volatile markets this week as a raft of labor data is released at the same time as liquidity sees a sizable drop versus last month’s buoyant conditions. With positioning in bonds now very long, yields are at risk of rising, triggering a selloff in stocks.

Focus returns to the US labor market this week as JOLTS, ADP, Challenger layoffs, ISM services employment and payrolls are released.

The jobs market is slowing but the question remains: will it deteriorate fast enough to prompt the Federal Reserve to act even sooner than rates markets are expecting?

This comes at the same time as a non-negligible drop in liquidity and skewed positioning in bonds. The JPMorgan Treasury Survey of active clients is registering an all-time high in net longs.”


Posted in Published | Comments Off on December 4, 2023

December 1, 2023

2:30 pm

SPX may have hit its final resistance at 4600.00 that I had announced on Monday.  Let’s see if it sparks a reversal.  Another interesting point.  At 1:00 pm today the SPX concluded exactly 31.42 market days (PI = 3.1416) from the October 13 high.   In fact, 7 of the 10 reversals this year were at PI intervals.


2:15 pm

BKX is finally reaching its Cycle Top at 88.57 this afternoon, on day 252 of its Master Cycle.  Something is afoot here, since the Cycles Model calls for a possible massive panic decline starting this weekend, or possibly today.  Don’t let this fool you,  There are numerous indicators pointing to some event-driven decline starting this weekend.  Note: this may be a global event.

ZeroHedge reports, “Money-market funds saw a massive $102BN inflow last week (the largest since the middle of the SVB crisis in March). The fifth straight week of inflows pushed total MM fund assets to a new record high of $5.84 TN…”


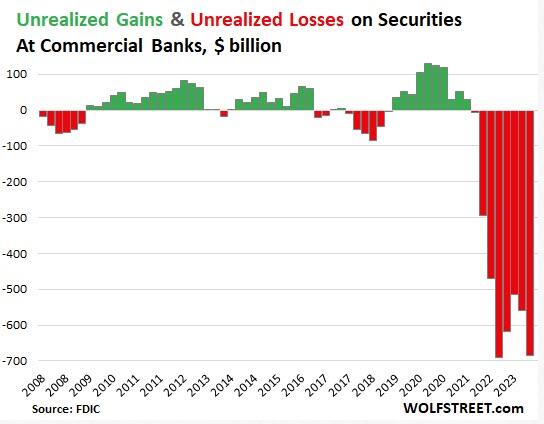
ZeroHedge further sates, “Unrealized losses on securities held by US banks exploded by 22% in the third quarter.

Of course, unrealized losses don’t really matter — until they do.

This is yet more evidence that the financial crisis that kicked off last March continues to bubble under the surface.

Unrealized losses, primarily on US Treasuries and mortgage-backed securities rose by $126 billion in Q3 and now total $684 billion, according to the FDIC’s quarterly bank data release.”


8:00 am

Good Morning!

NDX futures rose to Short-term resistance at 15986.00 (not shown) this morning before pulling back.  Critical support is at 15745.00, which indicates an aggressive sell zone.  Wednesday’s peak at 16166.50 may have fulfilled all the requirements for a completed Master Cycle at day 261.

Today’s options chain shows Maximum investor pain at 15950.00.  Long gamma starts at 16000.00 while short gamma begins at 15950.00.

ZeroHedge remarks, “A significant miss in the November manufacturing ISM, released later today, leaves stocks open to downside, as overboughtness and less favorable liquidity conditions meet hard-landing fears.

The US manufacturing ISM is one of the most consequential pieces of macro-economic data for markets.

It is the single largest explanatory factor for the performance of global stock markets, it is leading, and it is minimally revised. Last month it surprised to the downside, coming in at 46.7 versus 49 expected.”


SPX futures rose to 4578.00 in the overnight session, then declined back into the red.  Critical support lies at 4489.00, where an aggressive sell signal lies.  Wednesday’s high remains as the probable end of the rising Master Cycle.  Should that be true, the new Master Cycle may decline until mid-January.  The Cycles Model indicates a triple whammy of (downside) strength beginning this weekend, possibly today.

Today’s options chain shows  Max Pain at 4555.00.  Long gamma may begin at 4570.00 while short gamma lies at 4550.00.

ZeroHedge reports, “US futures reversed some of Thursday’s gains to start the final month of the year after a blowout performance in November, as European stocks gained, and Asia stuttered. US Treasuries and the dollar posted small moves before comments from Fed Chair Jerome Powell at 11am ET that may offer clues on the path of interest rates. Oil rebounded after OPEC+ promised further output cuts but was hazy on details. Israel resumed fighting against Hamas in the Gaza Strip after a weeklong truce ended: Israel’s army said Hamas violated the cease-fire terms by firing toward its territory. Bitcoin soared to its highest price so far this year. Base metals are rallying after the strong China Caixin Mfg. PMI results (50.7 s. 49.6 survey vs. 49.5 prior). Today, we get the November ISM-Mfg. at 10am ET (exp. 47.9, last 46.7) and hear from Powell at a “fireside chat” at Spelman College in Atlanta on Friday at 11am ET ahead of Fed’s blackout period. Focus for Powell events is whether he’ll back dovish comments earlier this week by Fed Governor Waller, which spurred a rally across front-end of the Treasuries curve.”


VIX futures are consolidating near the bottom of its trading range.  Last Friday’s Master Cycle low gave warning that the trend is about to change.  Those who follow the VIX realize that downside risk is now minimal.  The change in trend is confirmed above Wednesday’s high at 14.30.

The December 6 options chain shows Max Pain at 14.50.  While short gamma rules between 12.50 to 14.00, long gamma takes over at 15.00.  There’s not a lot of conviction on the long side, but that is how reversals happen at tops and bottoms.

ZeroHedge observes, “VVIX squeezing

The VVIX squeeze we outlined last week continues. The gap vs VIX is huge. Last time the VVIX was here, VIX was at 19 ish…”


TNX is pulling back from yesterday’s high at 43.52.  Support lies near 43.00, while a breakout above 13.52-43.75 offers an aggressive buy signal.  Trending strength returns early next week, giving TNX a boost higher.

ZeroHedge remarks, “Remember, remember, the surge of November…

Global bond and stock markets added over $11 trillion in capitalization in November. That is the second biggest monthly gain in history (Nov 2020 added $12.5 trillion)…

Source: Bloomberg

Who could have seen that coming?”


Posted in Published | 4 Comments

November 30, 2023

2:55 pm

As mentioned before, NDX may be the first index to give a sell signal.  Be prepared for a bounce to 16000.00-16060.00 before a larger reversal down.  A decline beneath short-term support at 15744.00 confirms the aggressive sell.  The sell confirmed lies at 15235.00.


10:08 am

GKX, the Ag Index has risen above the 50-day Moving Average at 396.93, confirming a buy signal.  Trending strength may “double up” starting tomorrow and continue through mid-December.  Should the Head & Shoulders neckline be broached, there may be follow-trough to or above the upper trading channel trendline.

ZeroHedge reports, “Rice prices are on the verge of hitting new 15-year highs as the damage effects of the El Nino weather phenomenon across Asia have damaged farmlands, leading to dwindling supplies.

Thai white rice 5% broken hit $640 per ton this week. These prices are back to levels not seen since October 2008. Prices are up over 50% since the start of 2022.”


9:51 am

BKX, our liquidity proxy, is  making a potential Master Cycle high today.  There is every confirmation that the banking Cycle is linked to the bond Cycle (see TNX).  The flush of cash into the banking system has lifted all stocks, especially bank stocks.  Now, on day 251, the Cycle may be over, or imminently so.  The Cycles Model suggests that, if the reversal happens in the next 24 hours, next week could be a bloodbath in BKX.  There is much to speculate about that could cause such an event.

3:00 pm

ZeroHedge  remarks, “Unrealized losses on securities held by US banks exploded by 22% in the third quarter.

Of course, unrealized losses don’t really matter — until they do.

This is yet more evidence that the financial crisis that kicked off last March continues to bubble under the surface.

Unrealized losses, primarily on US Treasuries and mortgage-backed securities rose by $126 billion in Q3 and now total $684 billion, according to the FDIC’s quarterly bank data release.”


7:55 am

Good Morning!

NDX futures consolidated within yesterday’s trading range.  Yesterday was day 261 (of an average 258 days) in the old Master Cycle.  The new Master Cycle may have begun.  A decline beneath Short-term support at 15869.00 may offer an aggressive sell signal.  The next support is the 100-day at 15216.00, confirming the sell signal.  There may be an effort to keep the NDX elevated due to the month-end.

Today’s options chain shows Max Pain at 16040.00.  Long gamma may begin at 16100.00 while short gamma starts at 1620.00.

ZeroHedge remarks, “Shooting star watch

Interesting dynamics playing out on an intra day basis. So far a rather big rejection in equities. Note NASDAQ loves making short term tops with this type of candle….but as always, we need a confirmation.”


SPX futures are attempting a bounce after yesterday’s shooting star formation. This indicates a potential top in this rally, but needs confirmation.  Short-term support is at 4518.00, giving investors a possible aggressive sell signal.  The next nearest support is at the 100-day Moving Average at 4417.00 where the sell signal is confirmed.

Today’s options chain shows Max Pain at 4550.00.  Long gamma starts at 4570.00 while short gamma may begin at 4530.00.

ZeroHedge reports, “US equity futures, European bourses and Asian markets all advanced, and Treasuries steadied at the end of a blistering November run after more dovish comments from hawkish Fed officials this week, and as investors waited for a key US inflation metric for further evidence that price pressure are cooling.  As of 7:55am ET, S&P futures rose 0.3% while US 10-year yields climb 3bp to 4.29%. Treasuries paused their strongest monthly gain since 2008, with yields on 10-year paper up four basis points at 4.30%. The dollar bounced 0.4% at the end of its worst month in a year, sending all major developed- and emerging-market currencies lower. The euro traded down 0.5% versus the greenback as the pace of price growth in the region cooled. Today’s macro focus will be the PCE, Personal Income/Spending and Initial Jobless Claims. The PCE release today will provide us with more details on the disinflation trend in Q4: Consensus sees core PCE printing 3.5% YoY vs. 3.68% prior. Eyes will also be on OPEC+ today as the group may consider a production cut at today’s meeting: RTRS sources said OPEC+ ministers agreed for a preliminary cut for over 1mn bpd.”


VIX futures are also consolidating this morning.  The old Master Cycle appears to have ended last Friday.  Trending strength may be building for a potential breakout this weekend.

The December 6 options chain shows Max Pain at 14.00.  Short gamma dwells at 13.00-13.50.  Long gamma is in short supply, as traders have not yet begun to hedge.


TNX is bouncing back from its Master Cycle low yesterday.  The reversal from the trendline may give an aggressive buy signal, but a stronger signal lies above 44.50, which is short-term resistance (not shown).  The reversal was on time at day 258.  The length of the decline, 37 days, has given traders the impulse to draw straight lines into the future.  They have forgotten that the prior trending rally was 52 days in length and went further than the decline.  The new rally may gain strength early next week as it powers higher into the year-end.

ZeroHedge remarks, “TLT upside mania

What a difference a month makes. We outlined the contrarian TLT logic on October 23, in our post Dare the TLT? The world’s most hated asset back then has reversed and we are trading above the 100 day for the first time since May. The “easy” part of the trade is behind us. For the ones that enjoyed the move, consider switching into call spreads, the VXTLT has come down a lot (chart 2), offering relatively cheap options plays.”


USD futures appear to be consolidating above the mid-Cycle support/resistance at 103.31.  It may have given a buy signal to be confirmed with just a little more elevation.  Yesterday’s key reversal brought an end to the old master Cycle at day 266.  Should that be correct, the new Master Cycle may start with a burst of trending energy over the weekend and last to the end of the year.


Gold futures have dropped to 2034.00 tis morning, below the Cycle Top support at 2063.73.  This has created a sell signal for gold in mid-Cycle.  The Cycles Model also indicates a triple threat of trending strength after the reversal.  This may mean a potential panic decline as gold investors attempt to raise cash.

ZeroHedge observes, “It was almost exactly one year ago when a puzzled market was looking at the suddenly surging price of gold – which erupted from a 2022 low of $1630 in early November to close some $200 higher by year end, in the process diverging dramatically from real interest rates to which it had previously been pegged…

…. and trying to figure out what was behind the sharp move higher.

We were happy to reveal the answer, when we first showed that China had officially resumed its gold purchases in November 2022 for the first time after a three year “quiet period”…”


Crude oil futures rallied to 79.59 this morning on day 255 of the current Master Cycle.  It may attempt to reach Intermediate term resistance at 80.67 while making a top.  Today is day 255 of the current master Cycle, so it may be imminent.

ZeroHedge comments, “Ahead of the already once-delayed OPEC+ virtual meeting tomorrow – which may or may not be delayed again – the leaks, trial balloons and outright manipulation by various cartel delegates is approaching a level that would make the Fed and ECB blush.

In the latest such leak, moments ago the WSJ largely repeated what we already reported last week, namely that to halt the drop in oil price, most OPEC+ members are considering – and in favor of – an additional 1 million barrels per day production cut. And while delegate sources confirmed that Nigeria and Angola, the two biggest African oil producers, still resist a downgrade of their individual quotas, as does the United Arab Emirates, Saudi Arabia is in favor of the new cuts. And what Saudi Arabia wants, it usually gets.”


Posted in Published | 2 Comments