
9:37 am

BKX, our liquidity proxy, may make another attempt at the Cycle Top at 95.93 today. The Master Cycle low occurred on January 18 which gives the BKS about a week to complete a bounce, barring any catalyst that would break the Cycle. The Cycles Model suggests the decline may be underway again by the end of the week.
ZeroHedge comments, “With credit card delinquency rates at their highest levels in more than a decade, getting approved for a new line of credit is getting harder, Fed analysts warned.

According to a new report from the Philadelphia Fed, 3.19% of credit card balances were at least 30 days past due by the end of the third quarter of 2023.
That’s up from 2.76% in the second quarter and the highest level since 2012.”
8:15 am

Good Morning!
NDX futures have pulled back from their intraday all-time high at 17450.30, making a morning low of 17297.50. The Wave structure does not allow NDX to exceed 17523.00, so we may consider the rally complete, or very nearly so. Large hedge funds and certain institutions are leaving the party early. They must offload their longs slowly, since they cannot sell in bulk without showing their hand. The Cycle Top is at 17080.95, beneath which lies an aggressive sell signal. A confirmed sell signal lies at 16574.00 where we find the Ending Diagonal trendline and Intermediate support.
Today’s options chain shows Maximum Investor Pain at 17330.00. Long gamma may begin at 1735.00 while short gamma starts beneath 17300.00. Puts are layered at 50-point intervals beneath 17300.00.

The NYSE Hi-Lo Index shows how narrow this market has been over the past month, despite making new all-time highs. The market highs are being led almost exclusively by the magnificent seven. I have never seen this before in my 43 years of observing the market. It may have met its Master Cycle high yesterday, on day 263.

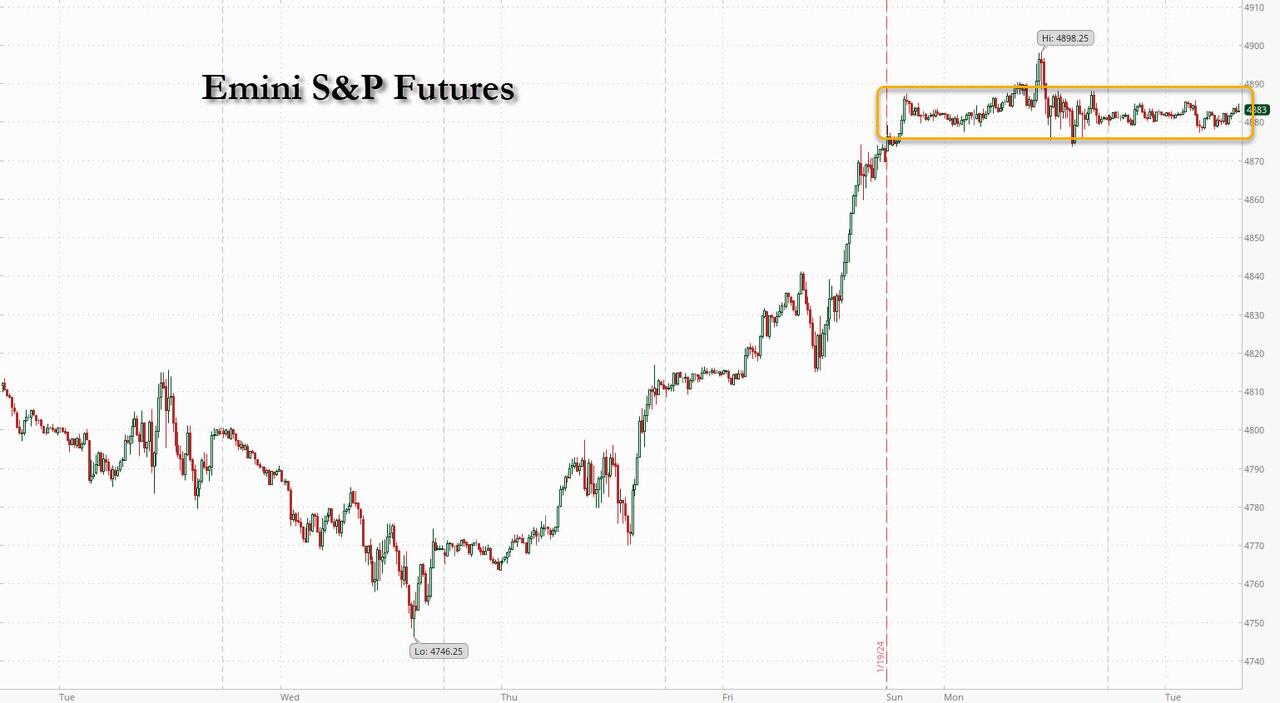
SPX futures have consolidated within yesterday’s trading range. It has met an equality guideline at 4834.00 but has the ability to move somewhat higher. It is still in its throw-over stage and may not be complete unless it makes a final probe near 4900.00. Round numbers attract, so if SPX goes higher, it may land there. The Cycle Top support is at 4806.00 while the 1987 trendline is near 4780.00 where aggressive short positions may be made, The short-term Diagonal trendline is at 4730.00 , where a confirmed sell signal may be made.
Today’s options chain shows Max Pain at 4840.00. Long gamma starts at 4850.00. Short gamma may begin at 4830.00.
ZeroHedge reports, “S&P futures are flat after back-to-back record closing highs for the S&P 500 index, with Europe mixed and Asia higher after a Bloomberg report indicated that China was “mulling” a 2 trillion yuan market rescue package to contain the relentless rout hammering Chinese stocks. As of 8:05am, S&P futures were up 0.1% despite a barrage of disappointing earnings releases from the likes of DR Horton, General Electric, and 3M. Nasdaq futures, as usual, gained more and were last trading up 0.3%. The Bloomberg dollar index was flat, erasing an earlier loss while the yen reversed an earlier gain following hawkish comments from BOJ head Ueda. WTI crude oil futures are down 0.5%, with Brent trading just under $80/barrel.”

VIX futures are hovering near their lows at 13.17. Today and Thursday are days of trending strength. Unfortunately, VIX is beneath its mid-Cycle resistance at 15.22, so the strength may easily lead lower…or a catalyst may energize the VIX higher.
Wednesday’s op-ex shows Max Pain at 14.00. There is a limited amount of short gamma near 13.00. Long gamma begins at 15.00-17.00 and extends to 30.00.

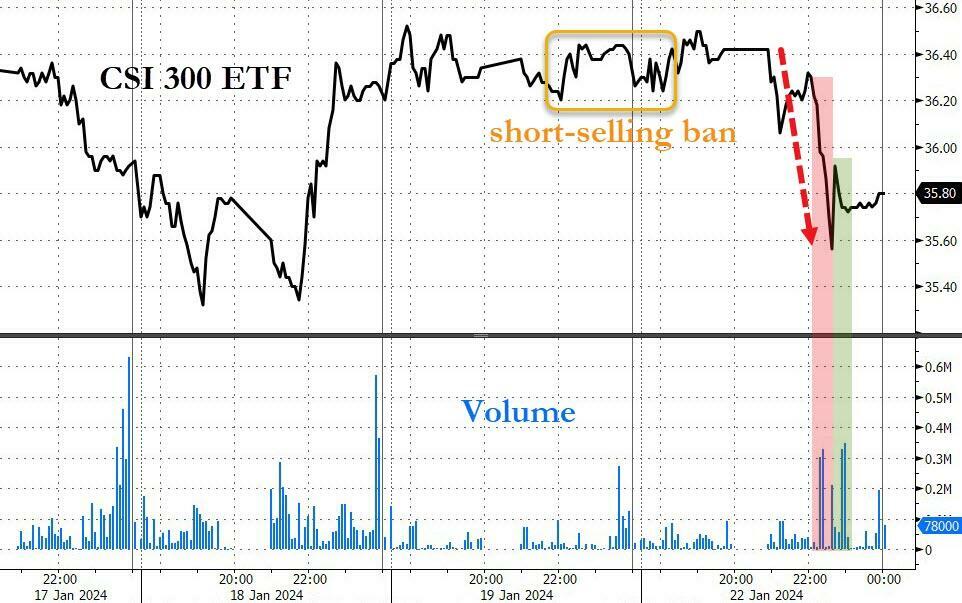
The Shanghai Composite Index made a new low at 2724.00 today. Should Beijing’s latest market rescue not succeed, there may be a waterfall event. The authorities made the wrong move by banning short sales, thinking they were the cause of the crash. Crashes are caused by a lack of buyers, not short selling. Short sales provide the incentive to take profits and, in doing so, give the market a floor. Instead, sellers may be motivated to sell the bounce, as it may be their last chance to get out before the next rout. US investors have avoided China stocks, adding to the political tension between our countries.
ZeroHedge reports, “Earlier today, we lamented the latest implosion in Chinese markets, which we discussed in “China Stocks Crash Through ‘Snowball Derivatives’ Trigger Levels Overnight“, in which we pointed out the unprecedented failure of the centrally-planned market to halt its collapse be it through short selling bans, or even the latest impotent intervention by the “National Team”, China’s Plunge Protection Team, which today failed to spark even a modest rebound in the relentless selling which had triggered key liquidation levels.”

TNX has bounced back above the trendline at 41.00 with a possible show of trending strength. The next hurdle is the 50-day Moving Average at 41.72. Should it break above it, the trend resumes in strength. However, the 200-day Moving Average at 40.77 or the Intermediate support at 40.23 may be retested before the breakout.
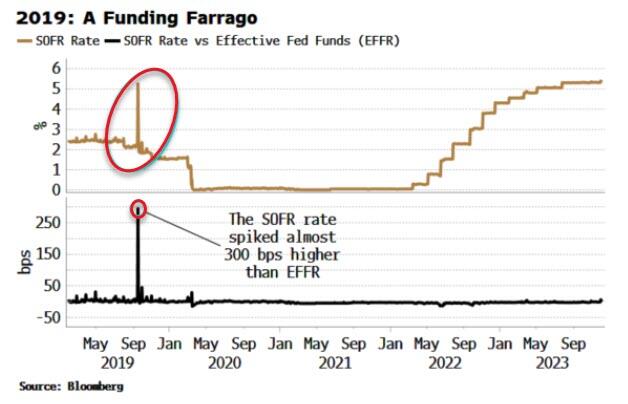
ZeroHedge observes, “As the Federal Reserve proceeds with quantitative tightening, markets are increasingly sensitive to funding and liquidity conditions. That makes it paramount to identify – ahead of time – when funding stress is about to manifest.
September 2019 is not a month the Fed wants to revisit. Funding conditions rapidly deteriorated, leading to spikes higher in repo and other short-term interest-rates that are at the base of financial markets. Without smoothly functioning funding markets all assets are vulnerable, as the cost of financing positions becomes punitive, or evaporates altogether.”

USD futures continue to consolidate beneath the mid-Cycle resistance at 103.46. The Cycles Model shows today as a day of trending strength which may lead to a breakout above the mid-Cycle and back to a recognized positive trend.