
The Lord’s Prayer
Our Father, who art in heaven, hallowed be thy name. Thy Kingdom come, Thy Will be done, on earth as it is in heaven. Give us this day our daily bread and forgive us our trespasses, as we forgive those who trespass against us. And lead us not into temptation, but deliver us from evil. Amen
1:25 pm
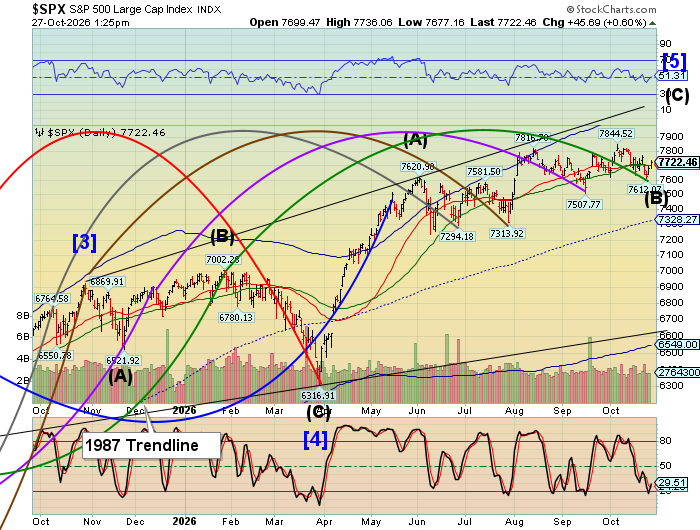
SPX has risen above the 52-day Moving Average at 7703.00 this morning. It is on a buy signal. The Cycles Model suggests the rally may last through mid-December with a target near 8100.00.
8:15 am
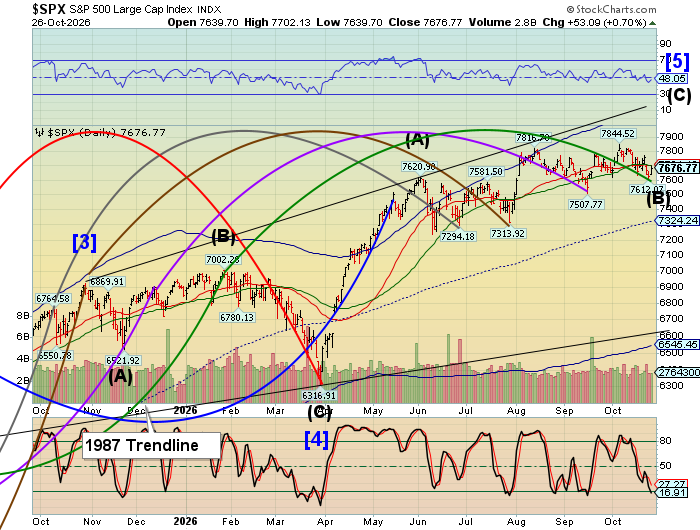
Good Morning!
SPX futures rose to the 52-day Moving Average at 7702.13 this morning. A rise above it offers a potential buy signal. Trending Strength may return by the weekend. The Cycles Model infers a rally may proceed to challenge its current all-time-high at 7844.52. Should it succeed , it may proceed to the Cycle Top near 8100.00. The new Master Cycle may last to mid-December,
ZeroHedge reports, “US futures are higher as hopes for a diplomatic end to the Iran war got a fresh boost after Monday’s Mecca Pact talks in Tehran, with Supreme Leader Mojtaba Khamenei calling for pursuing the conditions set out by Iranian officials to end the war…”
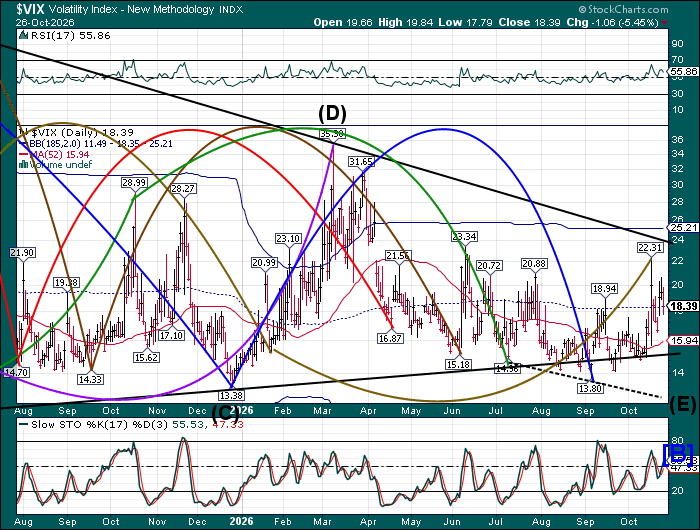
The premarket VIX declined to 17.67, beneath mid-Cycle support at 18.35. This move offers a sell signal. The current Master Cycle may continue its decline to late November, re-activating the Triangle “tail”. Investors are walking away from their hedges, but not fully embracing the rally, yet. A lot may hinge on the election outcome.
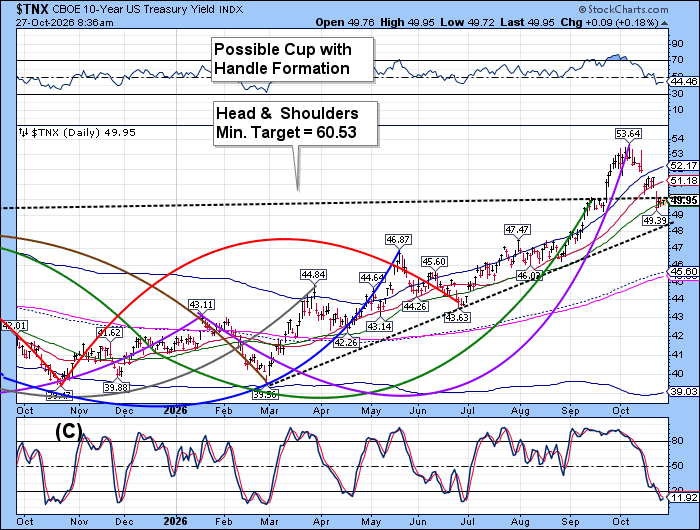
The US 10-year Bond Yield may be testing the underside of the Head & Shoulders formation at 50.00. It may challenge the neckline, but the Fractal Model suggests more downside. In addition, TNX may remain beneath the neckline for another two weeks, or until it reaches the 8-month rising trendline currently near 48.50.
ZeroHedge observes, “A week that sees a barrage of macro news, earnings, political developments, capital markets events including the massive Anthropic IPO offering doc and a record equity offering by Meta, also has a flood of coupon issuance to contend with starting with today’s $69BN in 2Y paper which sold to tepid demand ahead of this week’s FOMC decision.
Let’s see how the auction did, starting with the high yield 4.708% which was modestly below last month’s 4.787% which was the highest since June 2024. This tailed the When Issued 4.705% by 0.3 bps, the biggest tail since March.”
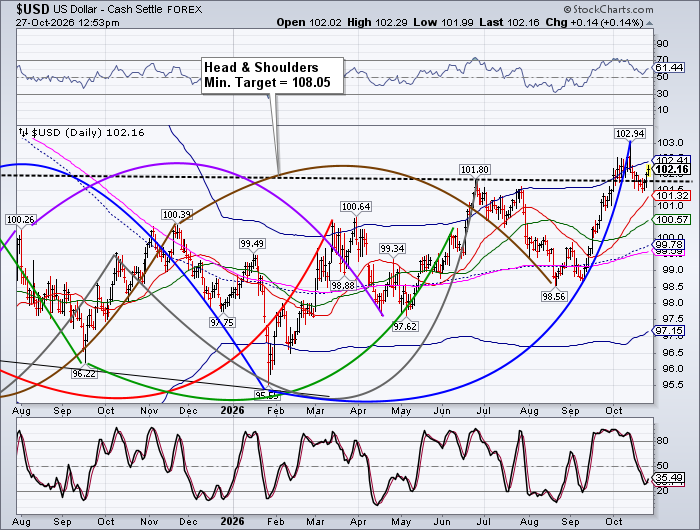
The US Dollar rallid beneath its Cycle Top, which may provide resistance. Should the resistance hold, USD may decline further beneath the neckline of the head & Shoulders formation. However, Trending Strength may return this weekend that may pierce the Cycle Top, leaving the rally intact to the end of November.
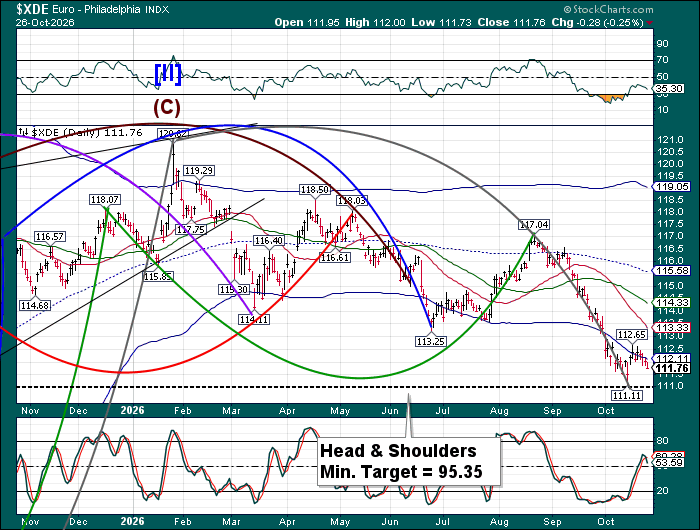
The Euro continues its decline beneath the Cycle Bottom resistance on a sell signal. A potential panic decline may be imminent. There is a new 15-month Head & Shoulders formation that matches a potentially more severe decline than previously calculated. The current Master Cycle may last until the end ofNovember that fits the severity. The European dominoes are teetering.
Zerohedge remarks, “French consumer confidence cratered to its lowest level in 13 years as a bond market selloff that sent yields soaring, weeks of social unrest sparked by far-left groups, and political instability all collided at once, casting a dark economic cloud over the European country.”
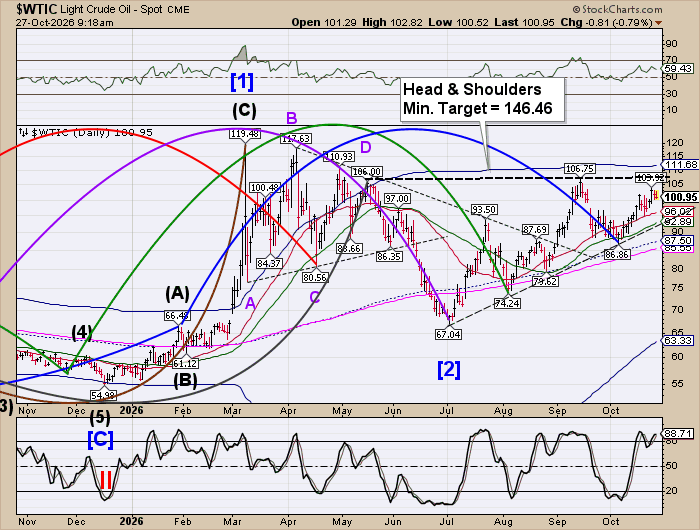
Crude oil may be consolidating before another porbe toward the neckline of its Head & Shoulders formation. It may go modestly lower. Trending Strength may arise later this week, offering the potential ability to overcome the neckline and the Cycle Top resistance at 111.68.
ZeroHedge comments, “US natural gas futures have fallen to levels last seen in April as unusually warm weather across the Lower 48 suppresses heating demand, potentially reflecting El Niño’s weather-related influence. Europe faces a much different outlook: a cold snap forecast for next week has helped push benchmark TTF NatGas prices toward 100 euros per megawatt-hour, highlighting the widening split between the two energy markets.”
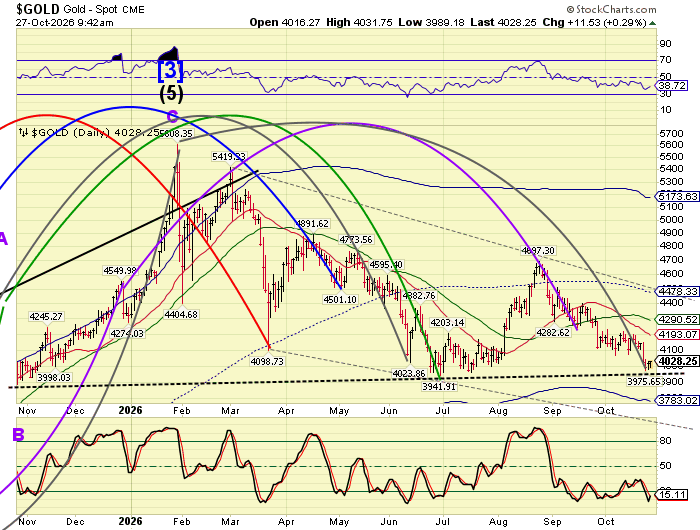
Gold is consolidating near the trendline and its Master Cycle low. There may be a diminishing potential of a final probe to or beneath the trendline at 3942.00. The Master Cycle low either has been made at 3975.65, or may be overdue imminently. Once the rally begins, it may extend to mid-December.
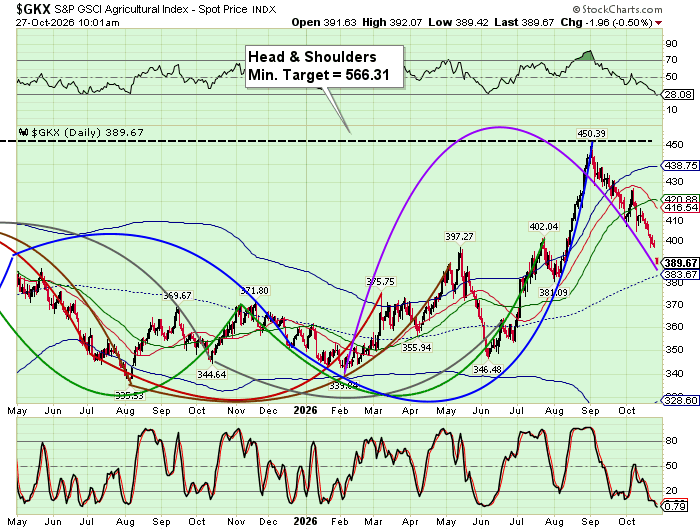
The Agriculture Index is hovering above yesterday’s low at 388.66. However, the Fractal Model allows a final probe as faar as the mid-Cycle support at 383.67. The Master Cycle may be a week longer than average in time, but remains short in price. Both conditions must be met.
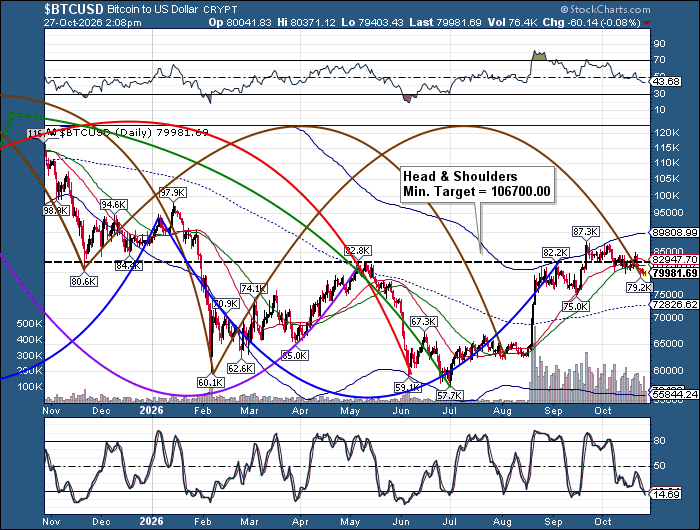
Bitcoin is hovering above its Master Cycle low at 79212.00. The new Master Cycle may be gathering strength as buyers begin to ooutstrip sellers. A surge of strength may be imminent, which may propel it above the 52-day Mocing average ar 81721.00. That action may offer a buy signal which obtains confirmaton above the trendline at 82200.00.
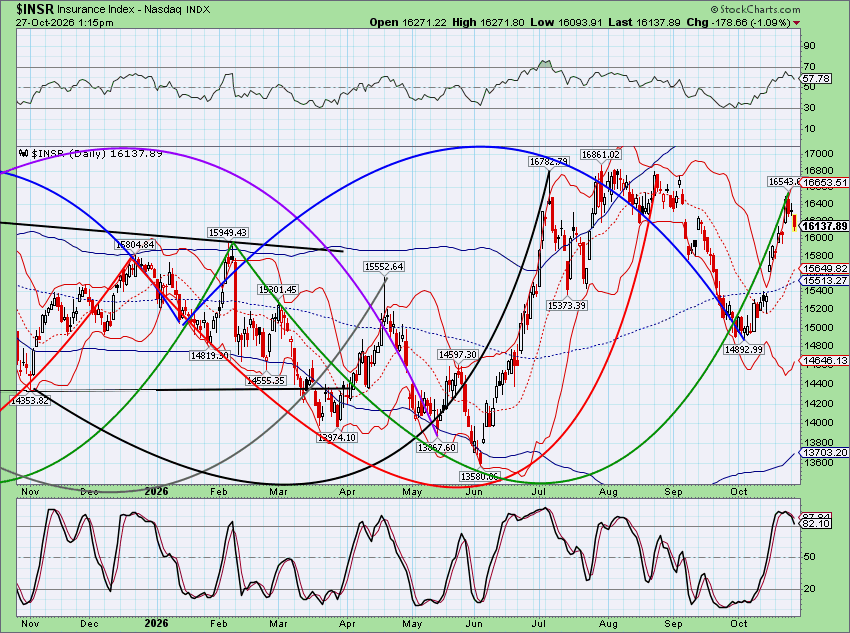
The Insurance Index has peaked last Friday, Completing its most recent Master Cycle. A quick look at the chart reveals this year’s high wwas made in July. However, the all-time high was made in november 2024. It has gone sideways for the past two years since then. The new Master Cycle may persist to the end of the year, leaving plenty of downside room to damage this index. The initial downdraft may reach the Cycle Bottom at 13703.13.