
The Lord’s Prayer
Our Father, who art in heaven, hallowed be thy name. Thy Kingdom come, Thy Will be done, on earth as it is in heaven. Give us this day our daily bread and forgive us our trespasses, as we forgive those who trespass against us. And lead us not into temptation, but deliver us from evil. Amen
3:25 pm
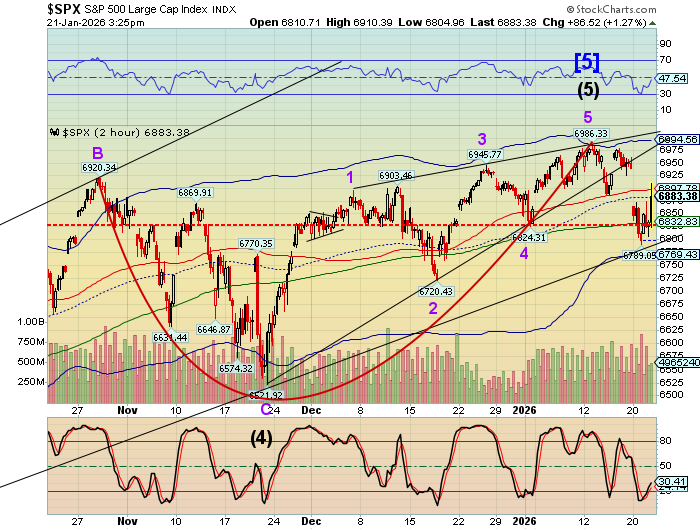
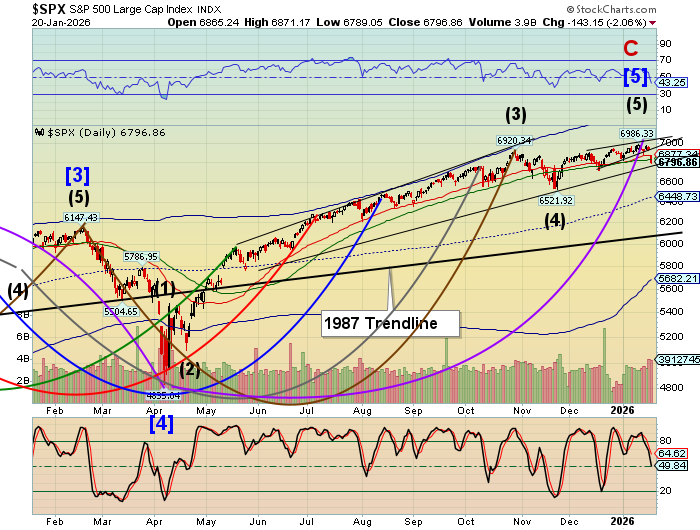
SPX has begun its decline and is beneath Intermediate support at 6881.00 as I write. This reinstates the sell signal for those who went long or cash. By Friday, the SPX may be beneath the 8-month trendline currently at 6785.00-6790.00.
8:10 am
Good Morning!
SPX futures bounced overnight, but gave it all back this morning. It is currently searching for a new low,, having declined to 6881.70 thus far. The 8-month trendline lies at 6775.00, where the next possible bounce may occur. Should SPX decline substantially through that level, the next possible support may lie at 6700.00. A recent survey found investors not only the most bullish since July 2021, but the least hedged. The Cycles Model suggests another wave of panic selling may arrive by Friday followed may another two weeks of decline. This is not a good combination.
Today’s options chain shows Max Pain at 6845.00. Long gamma resides above 6860.00 while sort gamma becomes strong beneath 6825.00. SPX is deep in short gamma presently. Dealers are likely under instructions to claw back to 6845.00 by the end of the day.
ZeroHedge reports, “Futures have reversed modest overnight gains and are trading near session lows while small caps continue to outperform (for a record 12th day in a row) even as Japanese and global bond yields stabilize and the market awaits today’s major catalysts including Trump’s speech in Davos…”
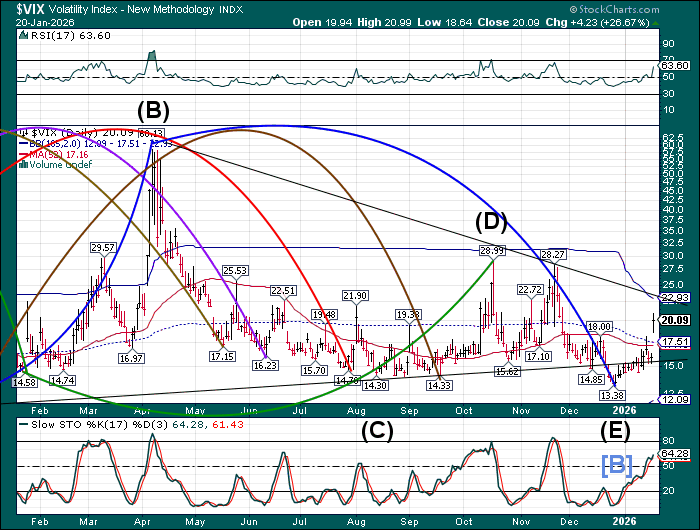
The premarket VIX has declined this morning to 19.11, signaling a possible bounce in the SPX later today. A correction may bring the VIX back down to the 52-day Moving average at 17.16 in the next day or so. The VIX has not yet shown extreme panic. However, the Cycles Model shows the VIX going higher to the end of the month, with a possible extension in to early February. Triangle formations, when complete, often retrace to their upper limit at 60.13.

The US 10-year bond yield is consolidating after yesterday’s gap higher. It has been on a buy signal since last Friday and may be ready to go much higher after a brief pullback. The trend strengthens again on Friday and through the weekend, with another surge at the end of the month. The minimal high may be the Cycle Top resistance at 46.25. However, Treingles are often retraced to their top, which is 49.97.

USD may have completed a short pullback yesterday and the probability of a resumption of the rally may be increasing. The mid-Cycle resistance is at 98.65 while the 52-day Moving Average is at 98.92. Aove either level may reinstate the buy signal. The Cycles Model infers that the uptrend may continue to mid-April. It may be fueled by dollar short covering, especially when the USD rises above the November high.

Bitcoin rose to 90987.00 this morning, above the 52-day Moving Average at 90270.00. However, it has come back down to re-cross the 52-day as the decline may resume today. Fractal analysis suggests a possible decline to 70600.00 while the Head & Shoulders formation infers a minimum decline to 71500.00. These possible targets may be seen in the next two weeks.

Silver futures have declined to a morning low at 92.14. The January 15 high at 93.57 remains the top of that Cycle. Silver futures traded for as much at 95.77 on that date as dealers charged more than $2.00 premium over the spot price. Today the futures showed a high at 95.43, which may break the January 15 high. Investors “feel” as if silver is heading higher, but it may not be so. The Cycles Model suggests that silver may start a decline to early April as investors take profits and those who are margined may have to cover.
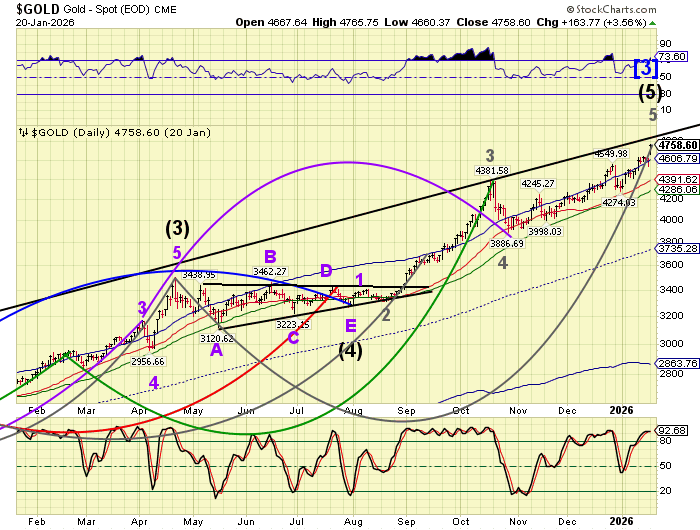
Gold futures rose overnight to a high at 4890.00, hitting trendline resistance. It may have maxed out its current Master Cycle at 280 days. Should that be so, a decline may develop that could last to early April.

Crude oil bounced from its 52-day Moving Average at 58.63, rising this morning to 60.87 and completing a retracement. Today we may see the decline resume with strength in its downtrend coming back this weekend. This time the Head & Shoulders neckline may not lend its support as the Cycles Model calls for a decline to early March.