
The Lord’s Prayer
Our Father, who art in heaven, hallowed be thy name. Thy Kingdom come, Thy Will be done, on earth as it is in heaven. Give us this day our daily bread and forgive us our trespasses, as we forgive those who trespass against us. And lead us not into temptation, but deliver us from evil. Amen
2:45 pm

SPX is beneath the 52-day Moving Average at 6831.41. A confirmed sell.
12:50 pm
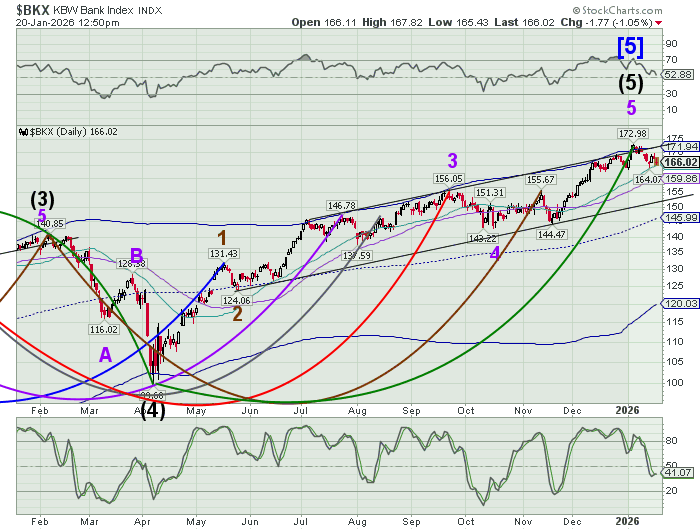
BKX is testing its Intermediate support at 165.05 and may break through shortly. It is currently on an aggressive sell signal, which usually means “Lower your exposure.” A decline beneath 165.00 gives a confirmed sell signal. The next two weeks may give a foretaste of what may follow in the next month.
7:45 am

Good Morning!
SPX futures declined to 6813.20 over the MLK weekend, beneath the 52-day Moving Average at 6829.03, bouncing off the 8-month trendline near 6800.00. The bounce may rise to, or above, 6900.00, but the sell signal may have been confirmed. These high amplitude swings are what is needed to break the uptrend. Once beneath 6800.00, few will believe that the uptrend is intact. The Cycles Model implies a decline that may last into early February, followed by a 2-3 week bounce. Friday may see a resurgence of a panic Cycle, as few are expecting a breakdown in stocks within a week of an all-time high.
Today’s options chain shows Max Pain at 6950.00, while the SPX futures are currently near 6845.00. It is likely that the dealers may be approaching the REPO window for enough liquidity to retrieve those losses by the end of the day.
ZeroHedge reports, “US equity futures are sharply lower, on pace for their biggest drop of the year, with Beta underperforming. And while geopolitics are the catalyst – as attention remains glued to see what Trump will say next on his Truth Social feed ahead of this week’s Davos meetings…”
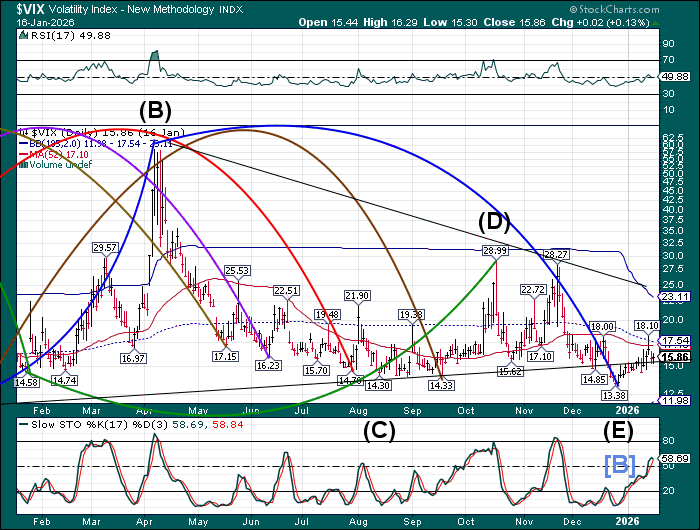
The premarket VIX has vaulted to 20.69 over the MLK weekend. It may retreat back to the 52-day Moving Average at 17.10 later today. The Cycles Model anticipates a “spike” high near the end of January followed by a brief correction. Traders are starting to brace for downside volatility this morning. The minimum target may be the April 7 high at 60.13.
Tomorrow’s monthly options chain shows Max Pain at 19.00. Short gamma resided between 15.50 and 19.00. Long gamma rests above 20.00 and extends to 100.00 with large institutional positions in the higher echelons.

The US 10-year bond yield futures rose to 43.15 this morning, as inferred by last week’s buy signal. Volatility may be increasing this week with a possible panic surge by the weekend. The formation we see in the charts is called a “slingshot.” It comes at the end of a 2-year Triangle formation whose top is at 49.97. While the 1-year chart shows the Cycle Top near 45.25, the ultimate target may be 50.00.

USD futures suddenly declined in excess of its 61.8% Fibonacci retracement level, then bounced to Intermediate resistance at 98.60. The retracement may be over, allowing the USD to break out above resistance at 98.60 to 98.94 (the 52-day Moving Average). Should it do so, the USD may resume its rally to mid-March.
.
The Japanese Yen had bounced from its Cycle Bottom at 62.82 on January 13. The bounce does not have the qualities of a reversal, giving permission to decline further. The Cycles Model suggests a lower bottom near the end of the month. Traders were sellers of Japanese bonds after a tepid 20-year auction earlier today. The spillover from rising Japanese rates are starting to be felt worldwide.

Bitcoin’s decline may have been temporarily stopped by the 52-day Moving Average at 90311.00. A bounce may ensue, taking BTC near 95000.00 in the next couple of days. However, the decline isn’t finished, as it may aim for the Hewad & Shoulders target in the first week of February.

The Silver Index rose to 95.77 this morning, completing its final probe toward 100.00. The Master Cycle is stretched to its limit, so we may expect to see a reversal imminently. The Cycles Model suggests a possible surge to 100.00 in the next couple of days, followed by a possible 2-month decline. The Cycles Model indicates a minimum decline to 60.00 with a possible decline to 30.00.