
2:31 pm

SPX has been repelled by a lower resistance at 5066.61 and is now poised for the next decline. The 1987 trend;ine beneath 4950 may be the next support. A larger bounce may develop there.
ZeroHedge reports, “Update (1330ET): In his most direct comments about The Fed’s expected path for rates, Chair Powell just admitted that “recent data show lack of further progress on inflation” and the market did not like it much…”
7:30 am
Good Morning!
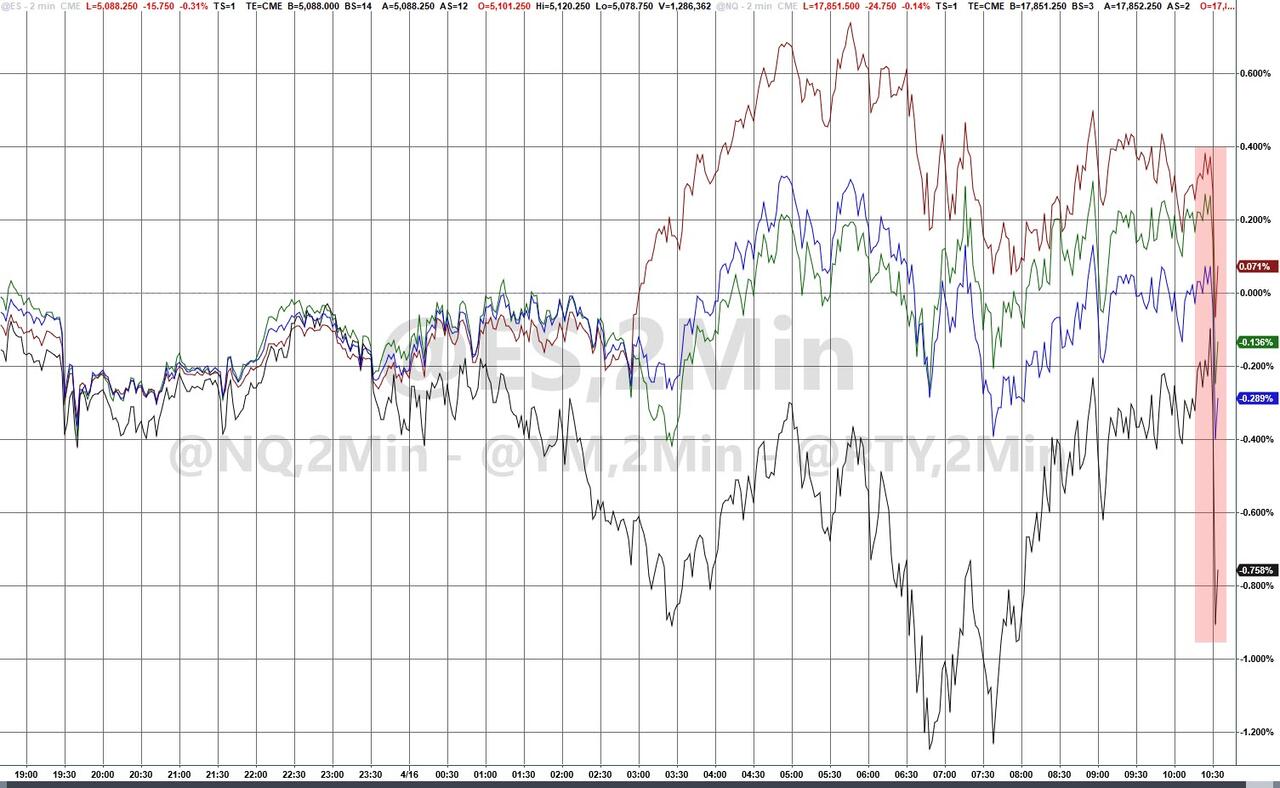
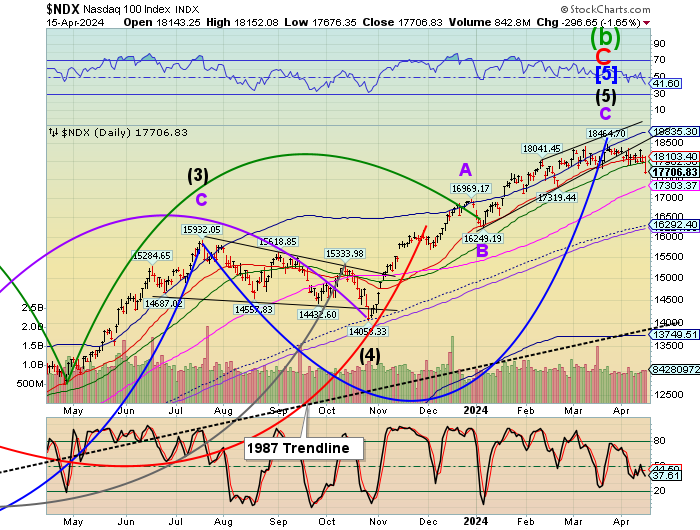
NDX futures dipped to a morning low at 17629.40 before bouncing. NDX has crossed beneath the 50-day Moving Average at 17962.50, accelerating the decline. However, it may bounce to a 2-hour resistance at 17810.00, possibly higher, before resuming its decline.
Today’s options chain shows Maximum investor Pain at 17870.00. Long gamma makes a weak showing at 18000.00. Short gamma begins at 17810.00. Dealers may attempt to elevate NDX above the owrst of the short gamma.
ZeroHedge remarks, “Six stats to get you going this morning
1. The Dow closed lower for its 6th straight red day. The index is now down over 2,000 points from its recent all time high.
2. The S&P 500 closed below its 50-day moving average Monday for the first time since last November, ending the 10th longest streak since 1950.
3. The S&P 500 is only down 3.7% from its peak closing price at the end of March. The median intra-year drawdown since 1928 is -13%.
4. Monday was the first time since November 2nd that the S&P 500, Nasdaq, S&P 400 (mid-caps), and Russell 2000 (small-caps) all closed below their 50-day moving averages.
5. The volatility index VIX is now up over 50% in just 3 weeks.
6. The Real 10-Year Yield (adjusted for expected inflation) rose to 2.20%, the highest since last November. We entered the year with the real 10-year yield of 1.72%.
As scary as last Halloween
The number of stocks making 52-week lows Monday outnumbered stocks making 52-week highs by the largest margin since Halloween.”

SPX futures dipped to 5040.20 before bouncing. It crossed the 50-day Moving Average at 5105.12 yesterday and may attempt a retest of the 50-day today. Overhead resistance may be at 5100.00. The Cycles Model indicates today may be a day of strength. This suggests that strength may return on the downside later in the day.
Today’s options chain shows Maximum Investor Pain at 5100.00. Long gamma may begin at 5105.00 while short gamma starts at 5100.00.
ZeroHedge reports, “S&P futures traded modestly in the green, erasing earlier losses and signaling a recovery after the S&P 500 fell more than 1% in the past two sessions, following stronger than expected earnings from index heavyweight UnitedHealth Group which soared 6% after reporting first-quarter profit that beat Wall Street’s expectations and affirmed its outlook for the year, despite the costs associated with a cyberattack on one of its subsidiaries that has roiled the health-care industry; other reporters such as Bank of America and Morgan Stanley also gained. of 8:45am, S&P futures gained 0.3%, after trading down 0.2% earlier this morning; Nasdaq futures also reversed an earlier loss and traded about 0.2% higher. Meanwhile, loans continued their ascent, with 10Y yields rising as highas 4.65% before modestly reversing, while 2-year Treasuries approached 5%. The dollar advanced for a fifth day, its longest run since January.’

VIX futures fell to a morning low at 17.68. It may drop further, to its 61.8% retracement value at 16.66 while SPX bounces. The rally may strengthen after the monthly op-ex, due tomorrow.
Tomorrow’s monthly options expiration shows Maximum Investor Pain at 15.50. Short gamma resides between 13.00-15.00. Long gamma may begin at 16.00 and remains strong to 60.00.
ZeroHedge observes, “SPX vs VIX
The reaction in VIX has been extreme. Last time we had a similar pick up in VIX was in Sep/Oct. The initial move higher in VIX was accompanied with a 5.5% sell off in SPX. The VIX eventually surged even higher during the autumn, and the total SPX sell off reached around 8%.”


USD futures may have made a Master Cycle high yesterday on day 272 of its Cycle. USD may face a week or so of retracement, then resume its rally to the end of May. An alternate view indicates only a smal pullback with renewed upward strength later this week.

TNX futures are easing back from a morning high of 46.66 (46.55 cash). TNX is in the final week of its Master Cycle. Its target remains at the Cycle Top at 48.33. The Cycles tell us we are nearing an Intermediate reversal in TNX, which may involve lower rates over a three-month duration approaching 2.4%.