
1:23 pm

SPX is testing the trendline leading to a breakdown. The likely path to a reversal may yet be another final probe to 4150.00 before doing so.
8:00 am

NDX futures remain flat with the April 4 high remaining the top of the Cycle thus far. Today is day 244 of the Master Cycle and, while it is within the window for a reversal, there may be yet another probe higher to complete the Wave structure.
ZeroHedge observes, “A month ago, when the banking stress first surfaced, our primary takeaway for US equity markets was that it would likely lead to a credit crunch (here and here). Given our already well below-consensus outlook for corporate earnings, it simply gave us more confidence in that view. Fast forward to today and the data suggest a credit crunch has started. More specifically, they show the biggest two-week decline in lending by banks on record, as they simultaneously sell mortgages and Treasuries at a record pace to offset deposit flight. In fact, since the Fed began raising rates a year ago, almost $1 trillion in deposits have left the banking system. Throw in the already tight lending standards and it’s no surprise credit growth is shrinking. If that isn’t enough, last week the latest small business survey showed that credit availability had its biggest monthly drop in 20 years, while interest costs are at a 15-year high.”

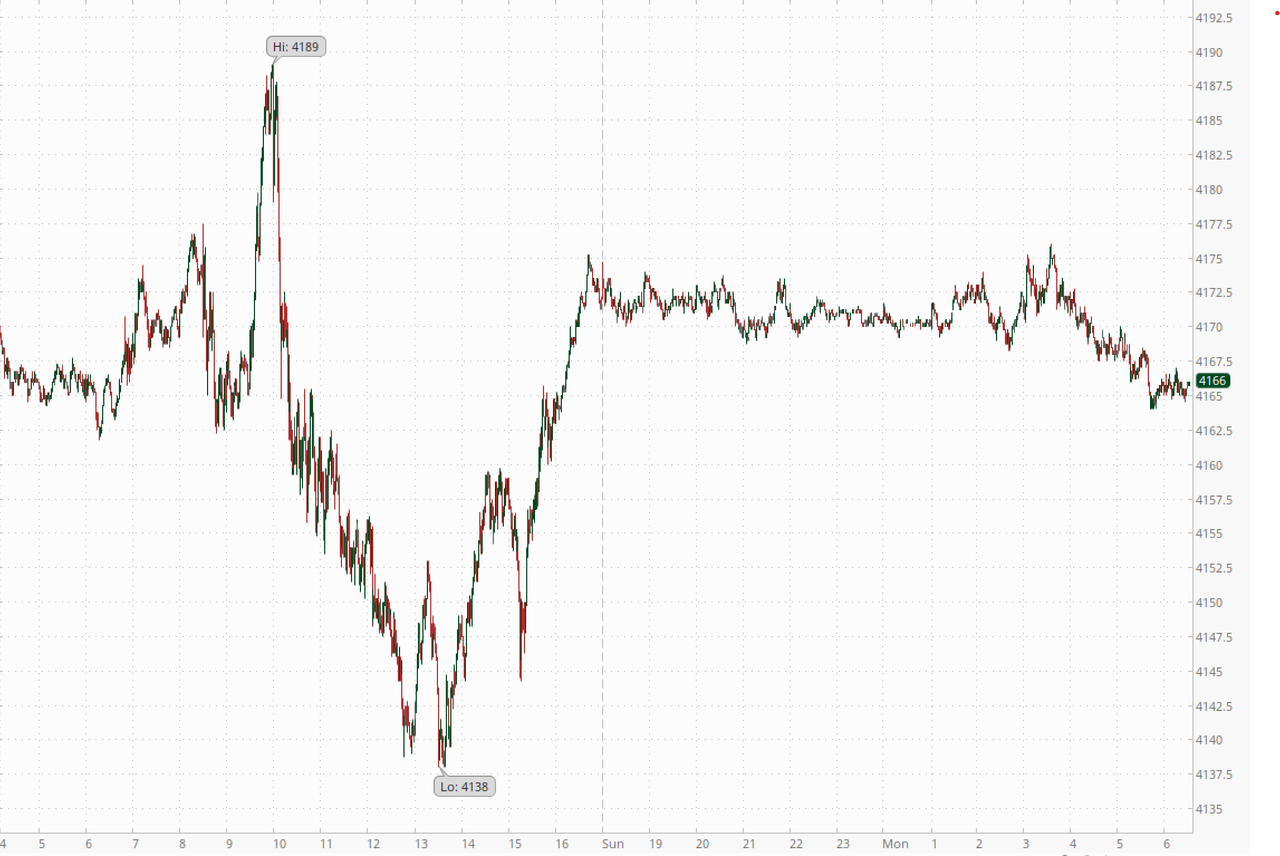
SPX futures have risen higher after bouncing off a minor trendline at 4113.00 on Friday. The Wave structure may be complete, suggesting a retest of the trendline later today. I cannot rule out another attempt to probe above 4150.00. However, time and targets have potentially been met.
Today’;s op-ex shows Maximum Pain for options investors at 4135.00. Long gamma starts at 4150.00, while short gamma begins at 4100.00.
ZeroHedge reports, “US stock futures are off to a muted start to the week as investor focus turns to first-quarter earnings for clues on the health of corporate America amid the Fed’s own admission it is hoping to trigger a recession in the coming months. Futures on the Nasdaq 100 and the S&P 500 were both up a modest 0.1% following Friday’s drop despite better-than-expected quarterly reports from the big banks as markets were unnerved by Fed Governor Christopher Waller’s hawkish comments favoring further policy tightening. His views caused investors to ramp up bets on another rate rise in June, following one in May, and also to scale back expectations for rate cuts later in the year. In Europe too, the Stoxx 600 Index erased an earlier gain.”

VIX futures are decidedly higher this morning, after Friday’s unmistakable Master Cycle low. The pendulum has swung far beyond expectations and expanded the Triangle formation in a rare 7th reversal. While most investors plot out the path of an investment with a ruler, the VIX much further back than one may anticipate. The Cycles Model suggests the uptrend may last through the month of May.

TNX has risen abov ethe 200-day Moving Average at 35.14 and is challenging mid-Cycle resistance at 35.59 this morning. Despite the potential buy signal this elicits, the Cycles Model suggests a potential reversal may be imminent, as today is day 259 of the Master Cycle. As it stands, TNX may be due for another test of the trendline.
ZeroHedge warns, “Back in January, when the US was just days away from hitting (again) the statutory debt limit, and when we looked at the latest forecast for when the US Treasury would hit the so-called X-date, i.e., the point in time beyond which all Emergency Measures have been used up and when a technical default for the US looked all too possible, we said that according to Goldman calculations the US may have “until August, and possibly as long as October to raise the debt limit.”

Three months later, things have changed for the worse as a result of a notable spike in the US deficit (the result of less tax revenue and far more governmental outlays), and as the next chart below shows, the Treasury General Account, or the cash balance parked by the Treasury at the Fed, has dwindled rapidly and was in the double digits as of Friday, the lowest since the end of 2022 (when the Treasury was set to rapidly replenish its cash holding), an amount that unless a debt ceiling solution is found fast could lead to market chaos.”

USD futures have risen to 101.55 this morning on day 250 of the Master Cycle. The Wave structure is not yet complete, so the Cycles Model suggests another week of probable decline. However, this may not be the beginning of a new USD bear market (see below).
ZeroHedge remarks, “Back in October 2022, just as the dollar was hitting what according to some measures of FX strength was an all time high, BofA’s Michael Hartnett laid out his two top trade for 2023 which was summarized by the following symbolic pair: “buy EM humiliation, sell US hubris”, or said otherwise, buy EMs, short the USD.”