12:51 pm

Today the Ag Index finally may have made its Master Cycle low on day 263. I had warned last week that the low might be in by the end of the week, but the extension needed to be made. For those who would prefer being long and to diversify away from shorts, this is a good choice. The next Master Cycle high may occur in mid-August, but it may not be the final high for the year. The last Master Cycle high of this series may be near Thanksgiving Day.
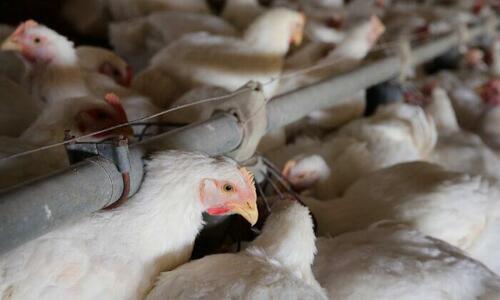
ZeroHedge remarks, “Concerns over potential shortages of eggs nationwide are growing due to inflation and supply chain issues made worse by avian flu.
“Like many sectors of the economy, egg farming is impacted by inflation and experiencing some limited supply chain challenges due to a variety of factors,” the American Egg Board (AEB) said in a May 24 statement in response to an Epoch Times inquiry.
The AEB was created by an act of Congress in 1976 at the request of egg farmers as a way to pool resources for national-level marketing.
Regarding avian flu, the AEB said, “It is important to note that less than 5 percent of commercial layer flocks have been impacted by avian influenza and those farms affected are working with state and federal agency partners to safely resume operations.
“Our farmers continue to work diligently to ensure that Americans nationwide have consistent access to their favorite protein: the incredible egg.”
12:38 pm

While the Cycles Model suggests a high on Thursday, it may invert to a low instead, should the downtrend re-establish itself. Wave C of (2) may be complete between 4175.00 and 4195.00. In addition, Wave C will have completed 43 hours of rally by 2:00 pm. This may be a good time to re-establish or add to your short positions with minimal risk. Sell beneath 4100.00.
7:55 am
Good Morning!
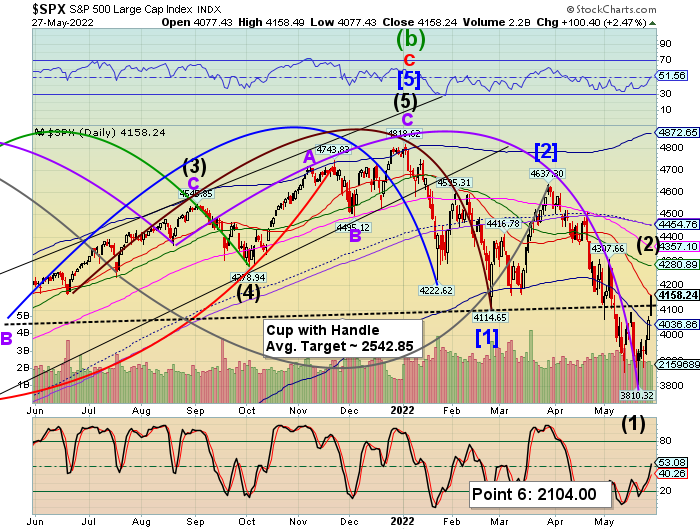
SPX futures reversed to the Lip of the Cup with Handle formation at 4124.30 before bouncing. There may be another attempt to go higher on Thursday, a day of trending strength. Friday may be the high for this Cycle, but the probability of a new retracement high exists. Should Friday mark the high, it will have completed this Cycle of decline-and-bounce in 59 days. Thus, I have restated the degrees of decline in the chart. Since [1]-[2] took 86 days, it is now labeled as a Primary Degree Cycle. (1)-(2) takes an average of 60 days, therefore it is an Intermediate Degree Cycle. The next potential decline is a Minor Degree decline that may take 30-34 days. The Decline in 2020 was an Intermediate Wave (C) of Primary Wave [4]. The Entirety of Wave [4] was 6 months. The next degree higher is the Cycle Waves. Cycle Wave I may take 10.45 months, ending in mid-October. These are the building blocks (Cycles) making up the current decline.
In today’s expiring options, the Max Pain zone is at 4070.00. Don’t be surprised if SPX declines beneath 4100.00, since the options market is still influencing the closing levels. Puts are favored immediately beneath that level, but short gamma kicks in at 4000.00 in a big way. Above that level is a mixed bag, with a sizeable number of puts at 4200.00. There may be an effort to rally the SPX to 4200.00 to neutralize the cache of puts. The next possible Master Cycle low may occur during the week after the June monthly options expiration.
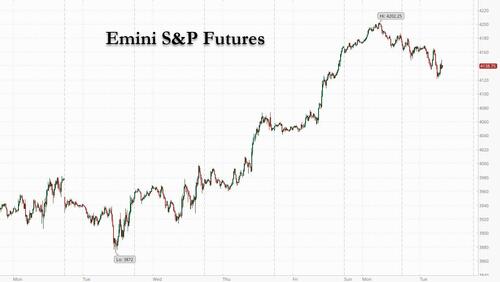
ZeroHedge reports, “After posting solid gains on Monday when cash markets were closed in the US for Memorial Day, boosted by optimism that China’s covid lockdowns are effectively over, and briefly topping 4,200 – after sliding into a bear market below 3,855 just over a week earlier – on Tuesday US equity futures fell as oil’s surge following a partial ban on crude imports from Russia added to concerns over the pace of monetary tightening, exacerbated by the latest data out of Europe which found that inflation had hit a record 8.1% in May. As of 7:15am ET, S&P futures were down 0.4% while Nasdaq futures rose 0.1% erasing earlier losses. European bourses appeared likely to snap four days of gains, easing back from a one-month high while Treasury yields climbed sharply across the curve, joining Monday’s selloff in German bunds and European bonds. The dollar advanced and bitcoin continued its solid rebound, trading just south of $32,000. Traders will be on the lookout for any surprise announcement out of the White House after 1:15pm when Joe Biden holds an Oval Office meeting with Fed Chair Jerome Powell and Janet Yellen.”

NDX futures declined to a low of 12602.00 this morning and appears to be lingering near that low. It has not risen to the Lip of the Cup with Handle formation. But, as mentioned earlier, there is a possibility of another probe higher on Thursday. The Cycle Bottom support at 12319.48 appears to be the level at which the new decline may be confirmed.
Options expiration is a mixed bag in the NDX. QQQ (309.10) favors calls above 305.00 and puts beneath that level. Gamma is difficult to ascertain, but may have potency beneath 300.00.
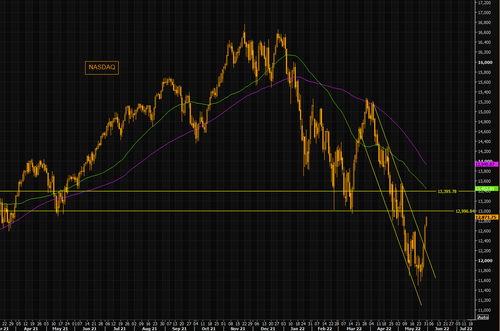
ZeroHedge comments, “NASDAQ – 900 points above Tepper “lows”
Last week NASDAQ broke above the trend channel that has been in place since early April. The squeeze has been powerful, destroying a lot of “smart” p/l. 13k is the first bigger resistance to watch. Next one above that level is the 13400 where the 50 day comes in. So far Tepper’s 12k has proved to be the significant support.

VIX futures reached Memorial Weekend high at 28.21 before easing back. Today is day 253 in the Master Cycle, which means we are close to a turn higher. However, Thursday comes as a day of weakness in the VIX Master Cycle, while it is a day of strength for equities. It is likely that the Master Cycle may end at or near mid-Cycle support at 23.08 on Thursday.

TNX rallied today (day 258) after potentially making its Master Cycle low last Wednesday (day 252). It tested Intermediate-term resistance at 28.75 and is easing back down. It is still possible that TNX may make a new low, so the confirmation of the reversal lies above Intermediate-term resistance. Everyone is watching the Fed, as if they control the markets. The Cycles Model suggests otherwise. The Cycles Model suggests the Primary Wave [5] high in early July, after which rates may go down. Thus, the Fed is more likely to follow the 10-year Treasury Cycle. However, it may take until October for the Market to start recovering.
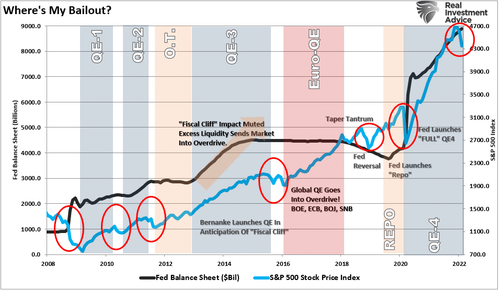
ZeroHedge remarks, “Will the Fed pause its rate hikes as markets correct? That is the question that everyone is trying to answer. Of course, after more than a decade of monetary interventions, investors have developed a “Pavlovian” response to market declines and the “Fed Put.”
Classical conditioning (also known as Pavlovian or respondent conditioning) refers to a learning procedure in which a potent stimulus (e.g. food) is paired with a previously neutral stimulus (e.g. a bell). What Pavlov discovered is that when the neutral stimulus was introduced, the dogs would begin to salivate in anticipation of the potent stimulus, even though it was not currently present. This learning process results from the psychological “pairing” of the stimuli.
Importantly, for conditioning to work, the “neutral stimulus,” when introduced, must be followed by the “potent stimulus,” for the “pairing” to be completed. For investors, as each round of “Quantitative Easing” was introduced, the “neutral stimulus,” the stock market rose, the “potent stimulus.”
Each time a more substantial market correction occurred, Central Banks acted to provide the “neutral stimulus.”
So, with the market having one of the roughest starts ever to a new year, investors are asking the question:
“What does this mean for the economy and how bad does it need to be for the Fed to pause?”

USD futures are on a bounce to 102.19 over the weekend. There are about two more weeks left in this Master Cycle, so the bounce may be limited by Intermediate-term resistance at 102.40 before going lower.

Very interesting points you have remarked, regards for putting up. “You can tell the ideas of a nation by it’s advertisements.” by Douglas South Wind.