March 5, 2026

The Lord’s Prayer

Our Father, who art in heaven, hallowed be thy name.  Thy Kingdom come, Thy Will be done, on earth as it is in heaven.  Give us this day our daily bread and forgive us our trespasses, as we forgive those who trespass against us.  And lead us not into temptation, but deliver us from evil.  Amen

11:21 am

BKX continues its decline beneath the trendline near 160.00.  Mid-Cycle support at 152.92 may provide a bounce, but the most significant target may be the Cycle Bottom at 130.57.  BKX has another potential month of decline per the cycles Model.  Wile the decline may progress further downward, potential for a panic may not come until the middle of March.  All eyes are on the Middle East while the financial sector continues to deteriorate.


9:20 am

Good Morning!

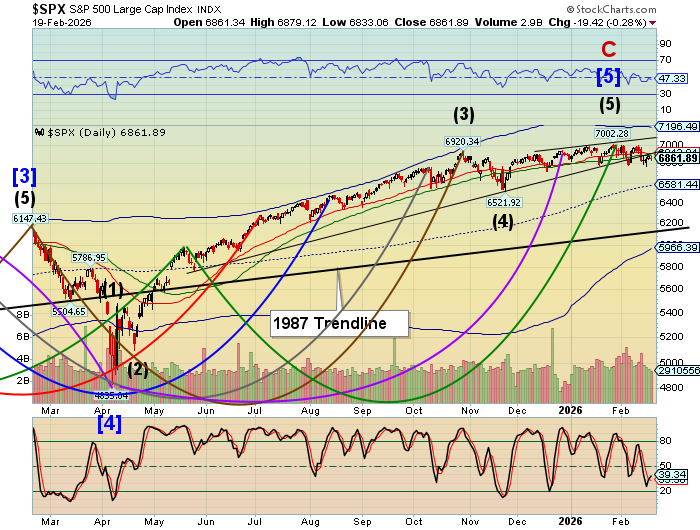
SPX futures made an overnight attempt at the 52-day Moving Average at 6899.00, but fell short at 6894.00.  It has since begun its decline back to the revised Head & Shoulders neckline at 6710.00, as reported yesterday afternoon.  This is a high confidence formation, as the DJIA and NDX are showing similar formations.  Many traders and analysts consider the bearish camp “overdone” as the sideways motion thus far has been discouraging the bulls and the bears.  However, the SPX remains on a technical sell signal that may be confirmed beneath 6800.00.

Today’s options chain shows Max Pain at 6875.00  Long gamma resides above 6900.00 while short gamma dwells beneath 6840.00.

ZeroHedge reports, “US futures are mixed, first dropping overnight to session lows after Iran vowed to escalate its retaliation against US strikes and avenge the US sinking of an Iranian warship as the conflict entered its sixth day, before spiking to session highs after Bloomberg reported that Iran had previously signaled a willingness to eliminate its uranium stockpiles in return for “something good” during talks with the US before the strikes began…”


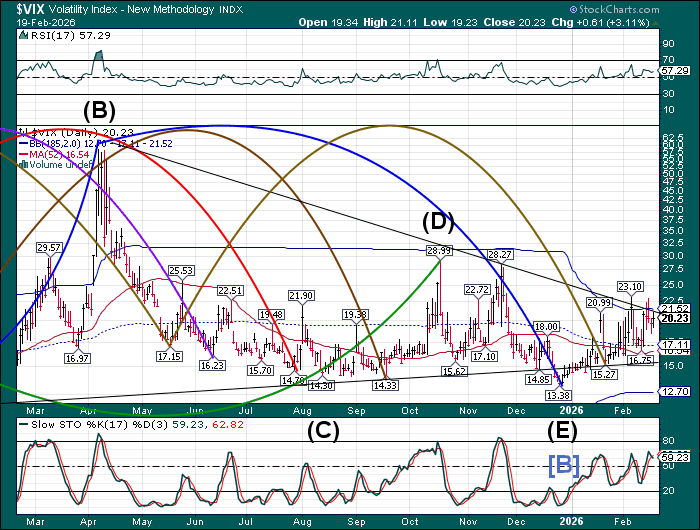
The premarket VIX has bounced back above the Cycle Top at 21.15, but remains range-bound this morning.  The Cycles Model calls for an increase in Volatility with a potential panic rally early next week.  This seems to be opposite the common advice that VIX may be crushed again.  Note the appearance of a Head & Shoulders formation.

The March 11 options chain shows Max Pain at 19.0.  Diminishing short gamma positions lie beneath 18.00 while the heaviest long gamma positions range from 20.00 to 30.00.

Investing.com observes, “Stocks finished higher on Wednesday. On the surface, this looked like a typical “vol down, stocks up” type of move. The VIX 1-day closed on Tuesday above 20 and traded down to around 12, while the VIX Index traded to roughly 20.50. Meanwhile, the VIX 1-day finished on Wednesday at around 17, so it is possible to see another opening move that helps push the market higher.”


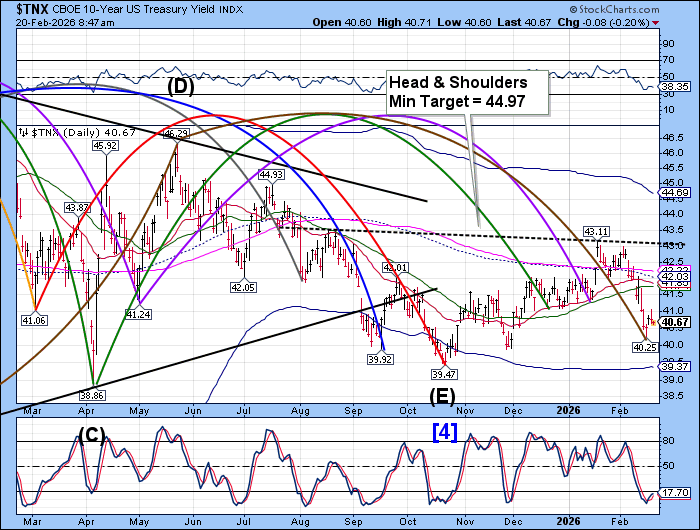
The US 10-year bond yield has risen to 41.49 this morning, testing the 52-Day Moving Average at 41.54. Bond volatility has just awakened, although commentators expect yields to go down beneath 4%.  On the other hand, the Cycles Model calls for a day of strength.  Whether it propels TNX above resistance is yet to be seen.   However, there may be another blast of strength over the weekend, giving enough ammunition to possibly rise above the 200-day Moving Average at 42.05.  The new Master Cycle may be long and powerful, lasting to the end of May.  No one seems to be expecting this.


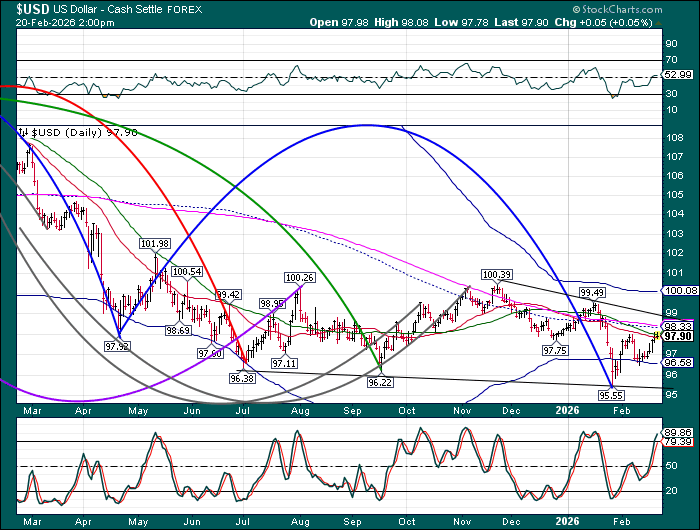
USD has found support at the trendline and may get a shot of strength to rise to its Cycle Top at 100.07.  The current master Cycle may have up to two more weeks to go.  A breakout above 100.00 may cause pain among the dollar shorts, adding fuel to the rally.

Investing.com observes, “The safe-haven appeal of the U.S. dollar has been burnished by a spike in oil prices caused by the escalating conflict in Iran, rather than a loss of faith in the American government, according to analysts at BofA Securities.”


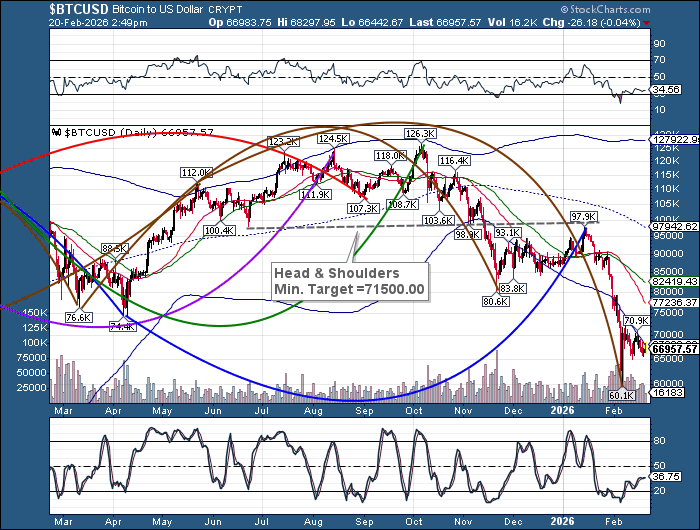
Bitcoin is consolidating today after yesterday’s surge to 74083.00.  It may have corrected enough to mount another probe toward the 52-day Moving Average at 76643.00 before anther pullback.  Bitcoin may be on a long Master Cycle that may last to the end of April, with potential targets at the mid-Cycle resistance at 94849.00 or round number resistance at 100000.00.  Most comments on Bitcoin are still bearish

Investing.com comments, “Bitcoin (BitfinexUSD) steadied around $72,000 on Thursday, trading above that level for the first time in roughly a month after a broad rally lifted cryptocurrency markets and related equities a day earlier.”


Silver continues its decline today, with a low at 80.66.  The Cycles Model calls for  an increase in velocity of the decline , especially over the weekend.  A  likely bounce may be at mid-Cycle support at 55.46.  However, the Cycles Model suggests the decline may continue to early April, with a possible target as low as 35.00.


Crude oil made a new high today at 79.04 as it adds definition to its Master Cycle high in a high risk geopolitical environment.  While the fractal now appears complete, it may have some fine tuning over the weekend.  In addition, there may be a new potential Head & Shoulders formation being developed, but not yet complete.  The  existing one may still be playing out in the next few days.  There is a lot of resistance at 80.00.


Posted in Published | Comments Off on March 5, 2026

March 4, 2026

The Lord’s Prayer

Our Father, who art in heaven, hallowed be thy name.  Thy Kingdom come, Thy Will be done, on earth as it is in heaven.  Give us this day our daily bread and forgive us our trespasses, as we forgive those who trespass against us.  And lead us not into temptation, but deliver us from evil.  Amen

2:47 pm

A simple visualization of the SPX indicates that the Head & Shoulders needed re-calibration.  It so happens that the DJIA and NDX also have Head & Shoulders formations in similar locations.  So there is now an agreement across the board, which makes this report easier to relay.  Prepare for a possible decline with increasing strength over the next week.

8:00 am

Good Morning!

SPX futures are consolidating near the upper half of yesterday’s trading range with the possibility of another probe higher.  This is an epic battle to regain control as the SPX slips beneath its support at the neckline of the Head & Shoulders formation.  Poor liquidity is being exacerbated by increasingly bearish price movement.  Individual investors are stepping away from the fray while hedge funds are increasingly bearish.  Buybacks are slowing down, leaving no backstop against a further decline.

Today’s options chain shows Max Pain at 6825.00 with long gamma above 6850.00 and short gamma beneath 6800.00.

ZeroHedge reports, “It was shaping up as a catastrophic, margin-call driven Wednesday session after Japan’s Nikkei tumbled about 4% and Korea’s Kospi suffered its biggest drop ever, plunging by a record 12%. But after initially plunging overnight, S&P futures rose as much as 0.4% after the New York Times reported that operatives from Iran’s Ministry of Intelligence used backchannels to contact the Central Intelligence Agency a day after US-Israeli attacks began.”


The premarket VIX pulled back to a low of 22.18 this morning as tension eased in the Middle East.  With corporate credit risk and Treasury yields rising, the path for the VIX may be higher for some time.  The Cycles Model suggests volatility continuing to rise into the weekend.  A possible target overthe next month may be the April 7 high at 60.00.

The March 11 options chain shows Max Pain at 19.00 with dwindling short gamma beneath it.  Long gamma seriously begins at 20.00 with calls owners grouped between 20.00 and 25.00.  There are outlying groups of calls up to 55.00.


TNX is consolidating within yesterday’s massive move.  Although appearing calm, it may be ready to explode even higher today.  The 52-day Moving Average at 41.53 may be a temporary stopper.  Should it go higher, the 200-day resistance at 42.07 may prevail.


USD is consolidating near its Diagonal trendline after a massive two day rally breaking through all resistance.  The Cycles Model suggests the rally isn’t over yet.  The next resistance is the Cycle Top at 100.07, near the November high at 100.39.  Wall Street is quiet about this move thus far.  However, breaking above 100.00 may bring massive USD short covering.  The possibility of a panic rally next week may grab a headline or two.


The Japanese Yen careened into its Master Cycle low yesterday, putting the Yen carry trade participants at ease.  However, The Cycle has reversed overnight and with it the carry trade may be about to become less profitable.  The “carry” involves borrowing funds from the Bank of Japan at its key rate currently at .75%, recently raised from .50% in December.  The rate hike brought a delayed reaction in the Yen.  What may not be recognized is that these hikes are about to bring a greater surge in the Yen.  A breakout above the january high may bring an unwind of the carry trade.


Bitcoin has broken above its month-long consolidation, rising above Intermediate support/resistance at 69547.77.  This action has given a buy signal.  There may be a consolidation or a pullback for a few days.  However, Bitcoin has a date to meet the 52-day Moving Average in another week.  A longer pullback may follow.  The current Master Cycle may last to the end of April, with a possible target near the mid-Cycle resistance at 95047.00.


Silver has fallen beneath its 52-day Moving Average at 83.47, confirming a sell signal.  The correction may continue toward the mid-cycle support at 56.21, with a possible add-on decline toward 300.00.


Posted in Published | Comments Off on March 4, 2026

March 3, 2026

The Lord’s Prayer

Our Father, who art in heaven, hallowed be thy name.  Thy Kingdom come, Thy Will be done, on earth as it is in heaven.  Give us this day our daily bread and forgive us our trespasses, as we forgive those who trespass against us.  And lead us not into temptation, but deliver us from evil.  Amen

11:05 am

BKX has declined beneath its Diagonal trendline and may be setting up for a bounce.  A possible target for this bounce may be the 50-day Moving Average at 167.37.  Dip buyers may be ignoring the broken trendline because BKX still appears to be in an uptrend.


10:20 am

SPX has vanquished the Head & Shoulders neckline at 6770.00 but may be ready to bounce on a possible support at 6720.00, making a back-test of the neckline.  Dip-buyers may have disappeared as they are being taken behind the woodshed.  Instead, shorts may be taking short-term profits, creating the bounce.  This decline may be only the first installment, with more to come.


8:00 am

Good Morning!

SPX futures took a nosedive to 6737.80 in the overnight session before bouncing back above the neckline at 6770.00.   This is the second day that the SPX futures have fractured the Head & Shoulders neckline.  But will the attempts to open above it succeed?  As investors buy more downside protection the struggle to maintain equilibrium intensifies.  In addition, the 10-year Treasury yields have climbed  well above their Cycle Bottom adding volatility to both bonds and stocks.  The overnight futures are thinly traded, making them susceptible to manipulation.  Can calm be maintained after the open?  The Cycles Model suggests the decline may resume beneath the Head & Shoulders neckline with potential widening swings developing later in the week.

Today’s options chain shows Max Pain at 6875.00.  Long gamma begins above 6900.00 while short gamma strengthens beneath 6850.00.

ZeroHedge reports, “US equity futures are down sharply, along with all global markets, as the Iran war expands and escalates (attack on US embassy in Saudi Arabia; uncertainty over duration of Strait of Hormuz closure; targeting non-military infra / businesses) rattling markets and sending oil and the dollar surging.”


The premarket VIX rose to 27.30 this morning  before settling back near 35.00.  Many traders view 25.00 as the “breakpoint” between a bull market and bear market.  While investors have purchased the largest amount of put protection in recent history, we may see even more hedging above this point.  The Cycles Model suggests increasing strength in the rally by the weekend.   Buybacks begin to taper off this week, offering less resistance to the VIX rally.

The March 11 options chain shows Max pain at 19.00.   Short gamma continues to dwindle while long gamma begins at 20.00.  Conviction in long gamma tapers off above 30.00.  Much of the new activity is centered around the March 18 expiration.


The US 10-year Treasury bond yield surged again this morning, reviving bond volatility.  The rally may intensify into an outright panic as the new trend strengthens.  TNX has the potential to rise above its cluster of resistance between 41.57 and 42.00 by this weekend.  Bond longs may be squeezed in that scenario.


The USD index rose to 99.38 this morning, breaking above the Ending Diagonal trendline near 99.00.  USD may rise to the Cycle Top at 100.07 before it pulls back to mid-Cycle support at 98.31.  The trend is higher and may intensify over the next couple of weeks.  Dollar shorts are at risk.


The Japanese Yen has extended its correction to match the February 6 low.  While appearing to be bearish, this action may have prepared the way for a strong resurgence.  There is an ongoing debate on the board of the Bank of japan whether to raise rated again from .75% to 1.00% in April.  The Cycles Model indicates that the trend in the Yen may have already changed…to the higher.  The new Master Cycle may bring a rally  to mid-April.  The Yen carry trade may be in the bullseye of the coming storm.


Bitcoin is consolidating between the Cycle Bottom and the Intermediate resistance at 69870.00.  While on an aggressive buy signal, a move above the 52-day at 77334.00 may upgrade the signal to a confirmed buy.  Bitcoin may  have established an uptrend that could extend to the end of April.


Gold was slammed down to 5006.00 this morning, creating a sell signal beneath the trendline and Cycle Top at 5194.42.  The Cycles Model suggests that volatility may rise even more over the next several weeks with the mid-cycle support at 4200.00 as a potential target.

Zerohedge remarks, “Gold is printing a sizable down candle following yesterday’s shooting star formation. We may be looking at a second lower high developing, raising the risk of a potential double top.”


Posted in Published | Comments Off on March 3, 2026

March 2. 2026

The Lord’s Prayer

Our Father, who art in heaven, hallowed be thy name.  Thy Kingdom come, Thy Will be done, on earth as it is in heaven.  Give us this day our daily bread and forgive us our trespasses, as we forgive those who trespass against us.  And lead us not into temptation, but deliver us from evil.  Amen

10:16 am

BKX bounced from its lower trendline at 156.00and may retrace its decline back to the 52-day Moving Average at 167.73, a 50% retracement.  The consolidation may take up to 2 weeks.  However, when the retracement is over, the Cycles Model suggests the decline may be strengthened.  “First, the stairway.  Then the elevator.”


7:45 am

Good Morning!

SPX futures declined to 6760.00, beneath the Head & Shoulders neckline near 6770.00 on the news of the military campaign against Iran.  The futures bounced to 6822.00, but have subsided near 6800.00.  The break of neckline support may allow the decline to continue to the proposed target near 6200.00.  However, prior to that, the bounce may resolve higher, possibly to retest the 52-day Moving Average at 6897.00.   The predominant emotion seems to be concern and not fear.  The Cycles Model suggests that panic may set in toward the end of the week and extend to mid-month.

Today’s options chain shows Max Pain at 6890.00.  Long gamma begins at 6900.00 while short gamma lies beneath 6800.00.

ZeroHedge reports, “US equity futures and global stocks tumbled, the dollar and gold rallied and oil soared as military strikes intensified across the Middle East, sending oil to its biggest surge in four years and stoking concern that faster inflation could weigh on the global economy.”


Premarket VIX rose to 25.24 over the weekend, breaking above its February 5 high at 23.10.  Panic rules the VIX this morning and may be reinforced as the week progresses.  The Longer view suggests the VIX may rise to the April 7 high near 60.00.  The new Master Cycle may last to mid-April.

The March 3 options chain shows short gamma between 14.50 and 18.00 dwindling.  Long gamma ovetakes short gamma at 19.00 and shows increased activity to 50.00.

ZeroHedge remarks, “Over the past 48 hours, geopolitical tension between the United States, Israel and Iran has escalated into direct military action. Air and missile strikes have been reported. Retaliatory measures have followed. Political leaders are issuing statements, and international observers are attempting to assess the scale and trajectory of events.”


The US 10-year Bond yield rose to 40.19 this morning, leaving a Master Cycle low on Friday.  The new Master Cycle may show growing strength over the next few weeks.  A buy signal on yields may be found above the trendline at 40.30.  The Cycles Model infers a possible 3-month rally out of this low, as it may be the retracement of a 3-year correction.  The peak in October 2023 was 49.97.


USD futures rose above their 52-day Moving Average at 97.92 and surpassed the mid-Cycle and 200-day resistance at98.31 this morning.  The Ending Diagonal trendline awaits the USD at 98.75.  It is on a buy signal that may take the USD higher for the next two weeks.  Trending strength may become more active during that time, challenging the Cycle Top at 100.06.


Bitcoin dipped to 63030.00 on Saturday as news of the military action in Iran came out.  However, it recovered and remains above the Cycle Bottom at 63198.00 as I write.  This indicates that the trend is higher in bitcoin.  The Cycles Model suggests a possible 2-month rally.  The next resistance to the rally may be the 52-day Moving Average at 77730.00 with a further possibility at the mid-Cycle resistance at 95446.00.


The rally in gold surged to 5433.75 over the weekend but pulled back near 5300.00.  The Cycles Model suggests that this probe may be a mere correction with more possible downside to come.  A decline beneath the trendline near 5250.00 or the Cycle Top at 5170.95 may confirm that viewpoint.


Silver declined from its cycle Top resistance at 93.94 on Friday to a morning low at 88.70.  A decline beneath Intermediate support at 88.53 may offer an aggressive sell signal with a further drop beneath the 52-day Moving Average at 82.59 may confirm the sell.  The Cycles Model maintains that silver may still have some corrective action to do.


Crude oil (WTI) rose to 74.99 over the weekend, in reaction to the military operations in Iran and the bombing of oil refinery facilities in the Middle East.   This morning it is trading near 71.00.  Crude oil has been due for a reversal and may have made its Master Cycle Top over the weekend.  Should that be the case, crude may decline through mid-April in the new Master Cycle.

ZeroHedge observes, “A drone strike forced Saudi Aramco to suspend operations at its Ras Tanura complex while damage assessments are underway on Monday, reviving a 2024 warning we issued that any successful Iranian or Iran-backed militia strike on critical Saudi refining infrastructure could trigger a global oil shock and, in a more severe scenario, set the stage for a broader financial crisis (reminder credit markets are already cracking).”


Posted in Published | Comments Off on March 2. 2026

February 27, 2026

The Lord’s Prayer

Our Father, who art in heaven, hallowed be thy name.  Thy Kingdom come, Thy Will be done, on earth as it is in heaven.  Give us this day our daily bread and forgive us our trespasses, as we forgive those who trespass against us.  And lead us not into temptation, but deliver us from evil.  Amen

9:00 am

Good Morning!  I am doing an abbreviated session this morning.

SPX futures have declined to 6841.00 thus far.  The next support may be at 6800.00 for a bounce.  However, the ideal would be to reach the neckline at 6770.00 before bouncing.  The Cycles Model shows a possible Master Cycle low by mid-March.  The Head & Shoulders formation may dictate a possible target once the neckline is broken.

ZeroHedge reports, “The rollercoaster continues: US equity futures are in the red again, trading near session lows, and set to extend Thursday’s losses with as stocks underperform after yesterday’s spectacular plunge in the momentum trade as NVDA’s post record-breaking earnings/guidance plunge spooked markets that nothing is resolved about where AI goes next.”


VIX rose to 21.74 this morning, challenging the Cycle Top resistance at 21.61, then pulled back to the trendline at 20.50.  A breakthrough may solidify its gains and allow a higher rally.  The Cycles Model allows increased volatility until early April, while it shows a declining SPX to mid-March.


TNX continues its decline toward the terminus of Wave (E) and the Master Cycle low.  The Cycles Model shows that TNX may be entering its reversal window in the next week.  A possible target may be the Cycle Bottom at 39.32.

11:19 am

BKX is testing its Diagonal trendline at 157.00.  The Cycles Model allows another 6 weeks of potential decline.  Supports may be found near the Cyclle Bottom at 128.97, then at the April 7 low at 99.66.


Posted in Published | Comments Off on February 27, 2026

February 26, 2026

The Lord’s Prayer

Our Father, who art in heaven, hallowed be thy name.  Thy Kingdom come, Thy Will be done, on earth as it is in heaven.  Give us this day our daily bread and forgive us our trespasses, as we forgive those who trespass against us.  And lead us not into temptation, but deliver us from evil.  Amen

10:48 am

SPX has declined beneath the 52-day Moving Average at 6898.00 and is retesting it at this time.  This is a sell signal.  Traders are wondering why NVDA is down.  The market is down on bad news and good news.

8:00 am


Good Morning!

SPX futures consolidated between 6958.00 – 6930.00 in the overnight market, remaining above Intermediate support at 6914.00.  The trendline is near 6950.00.  The dealers may attempt to overcome the trendline and may do so temporarily today.    Fractal analysis suggests the SPX may have the capacity to rise briefly before a reversal.  To many, it may seem as if the SPX is making an ATH, but it is the result of a rogue Wave (B) that may already be complete.   Wave (B)’s are counter-trend moves that are fast and have the appearance of longevity. but are not long term.  The Cycles Model suggests that may be about 3 weeks of decline following the reversal.

Today’s options chain shows Max pain at 6925.00.  Long Gamma may begin at 6950.00 while short gamma may start at 6900.00.

ZeroHedge reports, “US equity futures managed to erase overnight losses and were trading flat after Nvidia and Salesforce failed to assuage fears about an overheated AI economy while traders awaited color from today’s round of US / Iran talks.”


The premarket VIX has declined to 17.54 this morning, making a new master Cycle low.  Should the SPX rise above 6950.00 this morning, the VIX may test the mid-Cycle support at 17.12.  However, the fractal appears complete.  The new Master cycle may rise as far as mid-April, allowing time for momentum to build.  The minimum target may be the April 7 high near 60.00.

The March 3 options chain shows short gamma between 14.50 and 18.00.  Long gamma is heavily populated between 19.00 and 25.00 with institutional presence every 5 points up to 50.00.


TNX appears to be consolidating after rising from Monday’s master Cycle low.  The new Master Cycle suggests a new trend developing that may last to mid-April.  Today we may see the auction of $200 billion in short-term bills and $44 billion in 7-year notes.  The Cycles Model suggests trendline strength may make a comeback this weekend.

ZeroHedge observes, “After yesterday’s 2 Year auction, moments ago the Treasury sold its second coupon for the week when it auctioned off $70BN in 5 Year paper in a rather lackluster auction. ”


USD futures were repelled at resistance at Intermediate resistance at 97.71 this morning.  It may be making a (minor) Trading Cycle low in the next two days.  The Cycle bottom at 96.56 may be the target.  Once accomplished, the USD may rally to mid-April.


Bitcoin has emerged above its Cycle Bottom support at 65069.00 yesterday and may test that level for support.  Today we may see a burst of strength that could propel bitcoin higher.  The next resistance is Intermediate, at 73064.00.  A stronger resistance may be the 52-day Moving Average at 79705.00.  Should it exceed these levels, Bitcoin may continue rising through the end of April.


Silver futures have decline beneath Intermediate support at 87.74.  Should the decline continue, the next level of support is the 52-day Moving Average at 81.50.  Silver may have another month to complete its correction.  The Cycles Model offers the mid-Cycle support as the next lower level at 54.05.  Further guidance may be revealed as the correction progresses.


Gold futures are being repelled by the Upper trendline at 5250.00.  Should it decline beneath its Cycle Top at 5126.00 it may offer a sell signal.  The target of its decline may be the mid-cycle support at 3969.33.


Crude oil may be in a downside correction for the next week or so.  Its downside target may be the 52-day Moving Average at 60.73.  Once accomplished, WTIC may resume its rally to mid-April with strong momentum.  A breakout above the current level may engage the Head & Shoulders formation with a possible target near 80.00.


Posted in Published | Comments Off on February 26, 2026

February 25, 2026

The Lord’s Prayer

Our Father, who art in heaven, hallowed be thy name.  Thy Kingdom come, Thy Will be done, on earth as it is in heaven.  Give us this day our daily bread and forgive us our trespasses, as we forgive those who trespass against us.  And lead us not into temptation, but deliver us from evil.  Amen

8:30 am

Good Morning!

SPX futures rose to 6917.0 this morning, testing Intermediate resistance at 6914.00 and possibly the trendline near 6925.00.  This will be the third attempt at the trendline, as you will notice from yesterday’s 2-hour chart.   As mentioned yesterday, a reversal may be imminent.  Thus far, the price action has been no more than a correction for the past 28 days.  It is important to know that the current Master Cycle may be less than halfway finished.  NVDA earnings come at the close, which may either launch a new test of the bull market, or slam the door on the bulls.

Today’s options chain shows Max Pain at 6880.00.  Long gamma inhabits the territory above 6900.00 while short gamma lies beneath 6840.00.

ZeroHedge reports, “US equity futures are higher into NVDA earnings release after the close, and the risk-on tone in the US yesterday has spread globally with tech giant’s earnings a catalyst for maintaining the rally aided by Tech.”


The premarket VIX declined this  morning to 18.89 thus far.  It may decline further, near 18.50 in a flat correction, or possibly as low as the 52-day Moving Average currently at 17.12.  Today looks to be a possible Master cycle low, which may be impeding the decline in the SPX.  The release from that low may be extraordinarily strong  beginning next week.

VIX options expire today.  It appears that dealers may attempt a stab at short gamma beneath 19.00, since they may be the majority holder of puts.  The March 3 options chain shows Max Pain at 19.00.  Short gamma lies at 17.00-18.00.  Long gamma begins a call wall at 20.00 and bulges in the options chain at every 5 points to 50.00.


TNX is advancing today as it emerges from its Master Cycle low.  While most analysts are giving the “all clear” message on treasuries, the Cycles Model points out a possible two month rally straight ahead.  Should that occur, a likely target may be the Cycle Top currently at 44.59.


USD continues to consolidate beneath the 52-day Moving Average at 97.95.  The Cycles Model calls for a possible Trading Cycle low in the next two days.  The possible target may be Monday’s low at 97.35, although it may go lower temporarily.  The current thinking on the  street is that inflation may be contained, but the backdrop of a war emerging is making the market uncomfortable.  The Cycles Model suggests that USD may become more active in March with a breakout possible in early March.

ZeroHedge remarks, “The dollar’s slide last year looks less like a sudden break and more like the culmination of pressures that have been gathering for a while.”


The Japanese Yen extended its Master Cycle low another day.  However, today is also marked by the Cycles Model as “very strong.”  If so, the low may  not last.  The new Master Cycle may continue the uptrend until mid-April.   The target may be the Cycle Top at 70.45.


Posted in Published | Comments Off on February 25, 2026

February 24, 2026

The Lord’s Prayer

Our Father, who art in heaven, hallowed be thy name.  Thy Kingdom come, Thy Will be done, on earth as it is in heaven.  Give us this day our daily bread and forgive us our trespasses, as we forgive those who trespass against us.  And lead us not into temptation, but deliver us from evil.  Amen

10:51 am

SPX opened lower, but bounced at the 2-hour Cycle Bottom at 6810.00.  It then made a 61.8% Fibonacci retracement at 6880.00 on  light volume.  The retracement may have been the work of dealers who have a lot at stake should the SPX decline lower.  The Cycles Model indicates an  imminent collapse to the neckline.


8:00 am

Good Morning!

SPX futures rose to 6858.00 this morning as dealers sold shorts to fund yesterday’s options payout.  It is noteworthy that the dealers may be taking the same position as the short sellers.  Normally they take the opposites side of the options speculators, but there is no demand for calls.  As the SPX enters short gamma, dealers have no choice but to short the SPX as well, compounding the effect.  Max Pain, where dealers pay the least on maturing options, is now above 6900.00.   The Cycles Model infers that today may be an especially hard down day as both the speculators and dealers may be short the options market.   A decline beneath the Head & Shoulders neckline at 6775.00 may result in a bounce near 6700.00 to retest the neckline.  There is a minor support near 6812.00.

Today’s options chain shows Max Pain near 6865.00.  Long gamma dominates above 6900.00 while short gamma is strong beneath 6830.00.

ZeroHedge reports, “A short rebound in stocks fizzled after Monday’s drop, as worries about the disruptive impact of artificial intelligence continued to unsettle markets which digested yesterday’s AI scare, and await today’s Claude / Anthropic presentation, while preparing for tonight’s State of the Union address (“SOTU”).”


The premarket VIX tested the Cycle Top resistance at 21.65 this morning.  The Cycles Model suggests that the VIX may go into hyperdrive for the balance of this week.  The consensus is that VIX may rise to 35.00.  However, there is an equal possibility that the VIX may rise to the  April 2025 high near 60.00.

Tomorrow’s options chain shows Max Pain at 19.00  Short gamma between 15.00 and 17.00 is weakening.  On the other hand, there are significant call walls at 20.00, 25.00, 30.00 and 40.00 signifying institutional involvement.


TNX rose from its Master Cycle low this morning to resume its uptrend.  A busy week of Treasury auctions begins today.  The Cycles Model suggests rising rates reaching critical mass by the weekend.  The Head & Shoulders formation indicates a possible target near 45.00 in the next two months.


The USD index is testing the 52-day Moving Average at 97.96 this morning.  A breakout reinforces the buy signal made in early February.  Overhead resistance is heavy, so it may take another week to break out above it.  The Cycles Model shows March to be a very active month for the USD.


Japanese Yen futures declined to 64.00 this morning, extending their Master Cycle low.    The decline appears complete, allowing the Yen to resume its new uptrend.  The Cycles Model shows an increase in activity in March, with a possible ongoing rally through mid-April.  Given that time period, it is possible for the Yen to reach its Cycle Top at 70.20 in April.


Bitcoin has reached an intermediate target near 63000.00, as indicated.  However, the fractal dimension may not be complete.  The next test is the Master Cycle low made on February 6 at 69069.72.  Should it go lower, it’s next support level may be near 50000.00.  An ultimate target may be between 35000.00 and 40000.00.  A b ounce above the February 6 low may bring some relief to Bitcoin investors.


Posted in Published | Comments Off on February 24, 2026

February 23, 2026

The Lord’s Prayer

Our Father, who art in heaven, hallowed be thy name.  Thy Kingdom come, Thy Will be done, on earth as it is in heaven.  Give us this day our daily bread and forgive us our trespasses, as we forgive those who trespass against us.  And lead us not into temptation, but deliver us from evil.  Amen

11:30 am

BKX is taking a deep dive from its 52-day Moving Average at 169.00.  The Cycles Model suggests a high velocity decline that may break through the trendline at 156.00.  The Cycles Model suggests the decline may continue to the week of April 10.  The potential target may be the April low at 99.66.


11:00 am

SPX is going into short gamma beneath 6850.00.  Should this continue, the dealers who sold SPX puts may have to short the SPX as well in order to fund the matured options at the end of the day.  Should this continue, downside momentum may accelerate.


7:45 am

Good Morning!

SPX futures declined to 6855.00 over the weekend, then bounced to 6899.00 this morning before resuming its decline.   There were five attempts by options investors on Friday to rise above 6900.00 with the final attempt at the close.  This may have been due to monthly options expiring and a very large block of calls at 6900.00.  The sell-off in the futures market on Sunday may have been due to dealers matching their underlying assets against the maturing calls.  While the SPX has gone nowhere in the past three months, with the high to low range being only 3.3%, less than half of the normal trading range for the SPX.  This has given comfort to traders/speculators who have been trading that range, not realizing that the SPX has slipped beneath two major supports, the Ending Diagonal, currently at 6910.00 and the 52-day Moving Average at 6895.00.  In addition, virtually no one realizes that a neckline of a Head & Shoulders formation (shown on the two-hour chart) exists at 6775.00, with its bearish implications.  There may be an air pocket beneath the neckline down to 6500.00.

Today’s options chain shows Max Pain at 6900.00.  Long gamma strengthens above 6950.00, while short gamma rules beneath 6850.00.

ZeroHedge reports, “Stock futures slumped after Trump’s weekend tariff tantrum added uncertainty to American trade policy and was another blow to bullish outlooks for 2026. The Supreme Court’s tariff ruling means a big source of fiscal revenue from 2025 may have to be refunded (although if it is refunded to US consumers, who bore the brunt of tariffs as most liberals analysts concluded, it would represent a huge pre-midterm stimulus).”


The premarket VIX has risen to 20.64 this morning.  While SPX remains flat, the VIX continues to rise, suggesting not all is well under the hood.  The rise above the trendline tells us that investors are beginning to hedge the SPX.  Dealers often take the opposite side of the options they sell.  However, when a breakout occurs, they must also short the SPX to monetize the options.  In the case of the VIX, a breakout may force dealers to join the speculators who are buying the VIX/selling the SPX.

Wednesday’s options chain shows short gamma has fallen off a cliff with a small remainder still at 15.00 to 18.00.  Long gamma begins strongly at 19.00 and stretches to 40.00.


TNX is correcting its initial move off its Master cycle low on February 17.  It may probe nominally lower in the next couple of days.  However, Thursday may show as a panic-up day as the yields resume their pace higher.


USD was pushed back from the 52-day Moving Average at 97.97.  It is likely that the USD may resume its decline to the trendline or beneath it in the next three weeks.


The Japanese Yen has bounced from the 52-day Moving Average at 64.15 this morning, extending its Master Cycle.  The Model suggests a possible panic-up day mid-week that may propel the Yen above its previous highs.  It suggests a very strong trend upward to mid-April.  The Cycle Top is a plausible target, as the yen is heavily shorted.  Unwinding those shorts (carry trade) my provide ample fuel for such a rally.


Bitcoin has exceeded its initial target of 65000.00.  It may now proceed to the next level, which lies near 63000.00.  Here is the risk…should BTC continue its decline beneath the February 6 low at 60069.00, it may assume  a deeper decline, perhaps to 48000.00.  You see, the 50% retracement of the Bitcoin rally from its January 2015 low to its October 2025 high  is at 63222.00.  The 61.8% Fibonacci retracement appears at 48339.00.  The Cycles Model infers a possible continued decline to April 15, giving Bitcoin plenty of time to incur substantially higher losses.


Silver futures rose to 87.83, then pulled back today.  It may challenge the Cycle Top at 91.25 before reversing back down.  Silver may be in a complex correction that could last to early April.  The downside target may be as low as 30.00.  What is incomprehensible to most investors is the magnitude of the moves.  Seen in a larger context, they may appear normal.  Latecomers to the silver trade may become discouraged as losses pile up.


Posted in Published | Comments Off on February 23, 2026

February 20, 2026

The Lord’s Prayer

Our Father, who art in heaven, hallowed be thy name.  Thy Kingdom come, Thy Will be done, on earth as it is in heaven.  Give us this day our daily bread and forgive us our trespasses, as we forgive those who trespass against us.  And lead us not into temptation, but deliver us from evil.  Amen

8:00 am

Good Morning!

SPX futures consolidated between 6845.00 an 6889.00 in the overnight session, leaning toward the lower half of the range this morning.  Attempts to close above the 52-day Moving Average at 6893.62 have failed thus far.  While the past three months have been relatively flat, there are two considerations worth examining:  The first is that, while the DJIA made its all-time high on February 11, the NDX and SPX failed to do so.

The SPX  ATH was made on January 28 while the NDX ATH was made on October 29.  This dispersion begs the question, what’s going on?  The NYSE Hi-Lo Index shows 337 new 52-week highs on February 11 vs  288 new 52-week highs on January 28.  This denotes a change in leadership, with the Mag 7  companies leading the decline.  Second, the rotation into smaller companies could not make up the losses in volume from the 7 giants, despite constant attempts to buy the dips.  Finally, the SPX has decisively stayed beneath the 52-day Moving Average for the past two weeks.   The Cycles Model anticipates a possible panic decline early next week that may bring the SPX beneath the neckline of the Head & Shoulders formation at 6775.00.

Today’s options chain shows Max Pain at 6865.00.  Long gamma takes a decisive lead above 6900.00.  Short gamma rules beneath 6825.00.

ZeroHedge reports, “US equity futures are lower, sliding from session highs around the European open to session low just before 8am E as traders assessed the potential market impact of war with Iran, and awaited a firehose of US economic data including GDP and core PCE.”


The premarket VIX rose to 20.93 this morning, just beneath the trendline near 20.00 and the Cycle Top at 21.52.  A breakout may be anticipated.  Despite the “sideways” motions of the SPX in the past two months, VIX has been steadily rising.


TNX futures dipped to 40.57, while the cash market opened slightly higher.  Thi sis an approximate 50% retracement of the initial rise out of the Master Cycle low on February 17.  The correctio may not last mush longer as the uptrend may resume shortly.  Trending strength shows up by mid-week with a possible breakout above the resistance cluster from 41.74 to 42.22.


USD may be consolidating between intermediate support and the 52-day resistance.  It may be trapped within the resistance cluster for a few days before breaking higher.  An alternate view may be a retest of the Cycle Bottom support at 90.58 before a breakout.  USD shorts may be nervously watching the 200-day Moving Average at 98.41 and the trendline near 99.00 as a trigger point for covering.


The Japanese Yen may have made its master Cycle low this morning in a complex double reversal pattern.  It remains on a buy signal above the 52-day Moving Average at 64.12.  The Yen carry trade employs the practice of borrowing in Yen.  The process may be viewed as shorting it.  The value obtained from the Yen carry trade is that interest rates are extremely low (.75%).  But that is about to change, as the Bank of Japan is considering raising the key rate to 1.00%.  The Cycles Model suggests that the Yen may appreciate to the Cycle Top near 70.00 or higher in the next six months, adding back over 9% to the payback value of a loan in Yen.


Bitcoin has resumed its decline after testing its Cycle bottom numerous times.


Posted in Published | Comments Off on February 20, 2026