April 9, 2026

The Lord’s Prayer

Our Father, who art in heaven, hallowed be thy name.  Thy Kingdom come, Thy Will be done, on earth as it is in heaven.  Give us this day our daily bread and forgive us our trespasses, as we forgive those who trespass against us.  And lead us not into temptation, but deliver us from evil.  Amen

1:05 pm

SPX stalled at 6831.00 at this time.  The Triangle formation suggests the probe to the high today may be the last.  The 52-day Moving Average at 6765.00 offers a probable sell signal beneath it.  Take your pick at the additional lower levels.

I will be attending a family event over an extended weekend, returning with commentary on Monday.


8:00 am

Good Morning!

SPX futures declined to 6752.60 in the overnight session, then bounced back.  The consolidations may not last much longer.  The ceasefire euphoria is fading, leaving investors with a wait-and-see attitude.  It may spend a final probe higher that may begin the reversal.  Levels to watch for are  6740.00, beneath which an aggressive sell signal may be offered and 6710.00 beneath which the sell signal may be confirmed.

Today’s options chain shows Max Pain at a highly contested 6700.00.  Long gamma is entrenched above 6740.00 while short gamma becomes activated beneath 6675.00.

ZeroHedge reports, “Stocks resumed their drop and oil erased about a third of its Wednesday drop as traders watched the fragile US-Iran ceasefire shatter by the hour, with both sides accusing the other of breaches while the Strait of Hormuz is still effectively closed and Israel intensified strikes on Lebanon.”


Premarket volatility remains beneath the 52-day Moving Average at 22.01 this morning.  A break above the 52-day may reiterate the buy signal for those taken out by yesterday’s plunge.

The April 15 options chain shows Short gamma dominating the range from 14.50 to 22.50.  Long gamma begins above 23.00 and remains strong to 100.00.


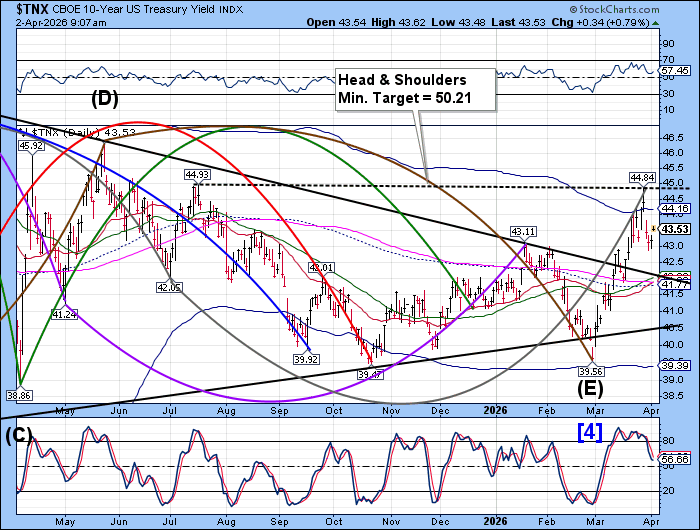
TNX may have made its retracement low yesterday and may be due for a rally through the weekend.  The next phase may be more powerful than the first.  Should the Head & Shoulders neckline be broken, TNX may be due for a new all-time high not seen for 20 years.

ZeroHedge observes, “After yesterday’s impressive 3Y auction, moments ago the Treasury sold $39 billion in benchmark, 10Y paper, in what was a mediocre auction.

The auction, a 9-Year 10-Month reopening of cusip CPX8, stopped at a high yield of 4.282%, up from 4.217% last month and the highest since last August. It also tailed the When Issued 4.280% by 0.2bps, the third consecutive tail in a row.”

2:45 pm

ZeroHedge reports, “fter a solid 3Y auction and a tepid 10Y auction earlier this week, moments ago the Treasury concluded the final coupon auction of the week, when it sold $22 billion in a 30 year reopening in what was another average auction.

The sale stopped at a high yield of 4.876%, virtually unchanged from 4.871% a month ago and the highest since last July. It also tailed the When Issued 4.871% by 0.5bps, the first tail since November.”


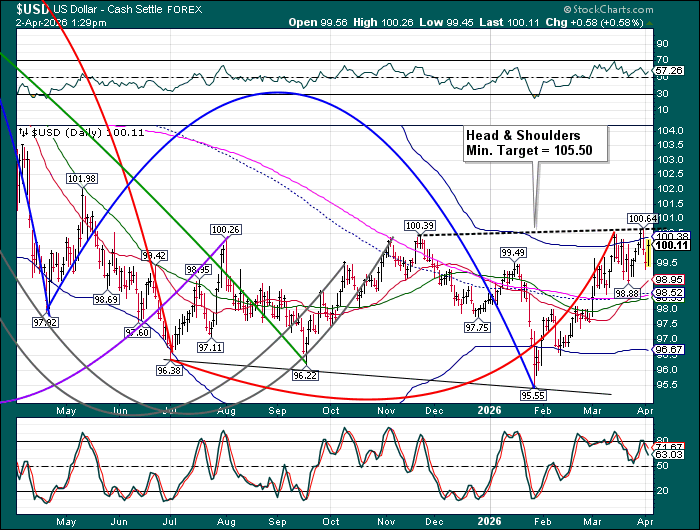
USD may be on its way to completing its Master Cycle low in the next few days.  Should that occur, the subsequent rally may take out the neckline of the Head & Shoulders formation.  The new Cycle has the USD trending higher until early June.


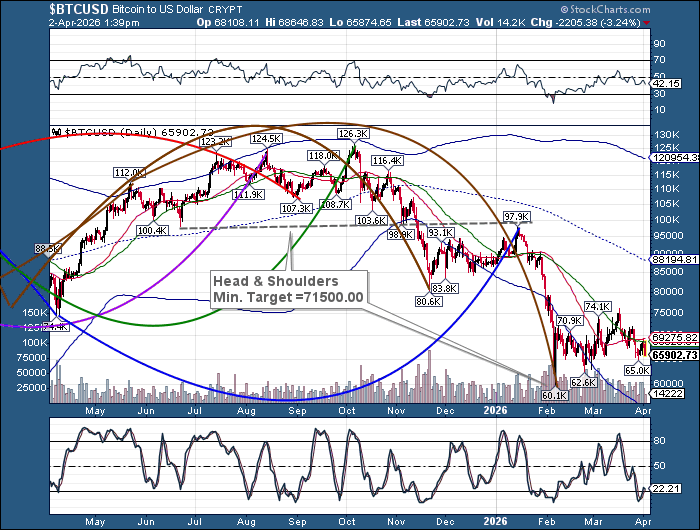
Bitcoin may have completed its retracement at 72857.00 yesterday.  Should that be so, a decline may be in the offing that may last to the end of the month.  A decline beneath the supports at 68783.00 to 69429.00 may offer a sell signal.  Once established, the dwecline may have trending strength.


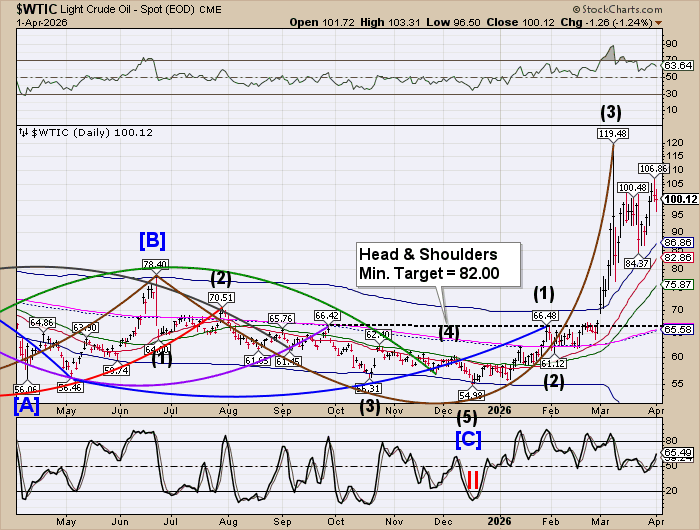
Crude oil bounced from the Cycle top support at 91.12 yesterday and has risen to 101.60 this morning.  The crowd just doesn’t know which way to turn.  The Cycles Model suggests another week of decline may ensue with a potential target in the range of 75.00 to 80.00.  An outlier may be a low near the Head & Shoulders neckline.


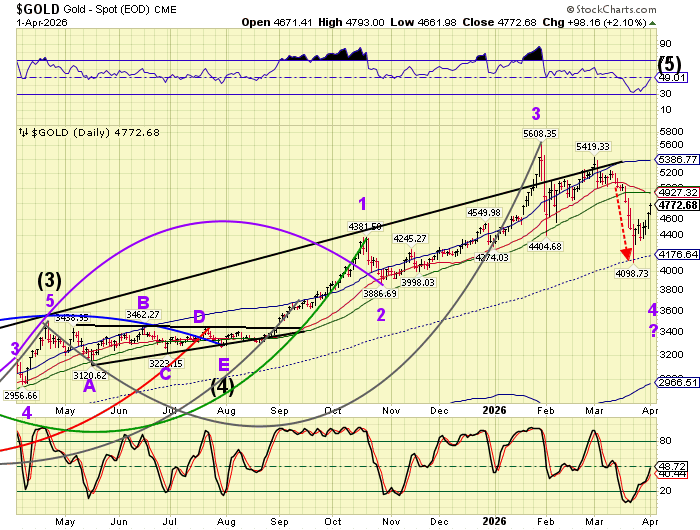
Gold may have completed its Master Cycle yesterday at 4857.82.  Today it is consolidating near the high, but may resume its decline shortly.  The decline may progress into the end of April with increasing trending strength.  Inflation may be increasing, but gold may not be the ideal hedge.

ZeroHedge asks, “Gold enters a new phase

Gold has bounced hard off key long-term support, but the move is starting to look stretched. Volatility remains elevated, positioning is shifting, and the way gold is behaving raises a bigger question: is this still a hedge, or just another risk asset?”


Posted in Published | Comments Off on April 9, 2026

April 8, 2026

The Lord’s Prayer

Our Father, who art in heaven, hallowed be thy name.  Thy Kingdom come, Thy Will be done, on earth as it is in heaven.  Give us this day our daily bread and forgive us our trespasses, as we forgive those who trespass against us.  And lead us not into temptation, but deliver us from evil.  Amen

2:58 pm

SPX is now nearly 6 days out of the Cycle Bottom.  The rebound went to the 52-day Moving Average at 6775.00, but it may not hold.  It must now find its level, and the new support may be at 6710.00.  It may continue in a sideways consolidation above that support or resume its decline.  There is little energy to move higher, since the retracement revisited where the short sellers began and found no desire to go long.  The  ceasefire may be too fragile to count on for a recovery and earnings are about to break loose.  Caution is advised.


8:15 am

SPX futures rocketed higher to 6806.90 thus far, just as the bounce from the bottom was losing steam.  Hedge funds were adding shorts just in time for a massive squeeze while retail investors aggressively bought puts.   Of course, the catalyst was the fragile ceasefire in the Middle East.  The Cycles Model suggests the bounce may have another week before complications arise.  A “regular” Cyclical bounce might have risen to the mid-Cycle resistance at 6689.33 or the neckline at 6710.00.  But the focus of the bounce may have been the 52-day Moving Average at  6777.12, where Wall Street could declare victory over the bears.

Today’s options chain shows Max Pain at 6575.00, as the market ripped higher into long gamma.  Call Walls are in place every 50 points from 6650.00 to 6850.00, suggesting institutional expectations of the SPX reaching higher levels.

ZeroHedge reports, “US futures, global stocks and bonds are sharply higher while oil prices plunge the most in years as a wave of optimism swept through global markets after the US and Iran agreed to a two-week ceasefire in exchange for Tehran reopening the Strait of Hormuz…”


The premarket VIX plunged  to 20.11 this morning, matching the March 23 low at 20.28.  The Cycles Model infers a possible further decline to the mid-Cycle support at 18.22 by the weekend or early next week.

The April 8 options chain shows Max Pain at 24.50.  Short gamma is concentrated between 17.00 and 24.00 while long gamma arises above 25.00 and is well populated to 100.00.


The US 10-year Bond Yield plummeted to 42.26 this morning, suggesting the cash market may follow lower, as well.  The Cycles Model suggests a possible countercyclical low in the range of 41.76 to 42.12 by the end of the week.    A surge in strength may appear over the weekend accompanying a reversal higher.  The appearance of low volatility in bonds may just be a mirage.

ZeroHedge remarks, “After several weeks of decidedly ugly auction which saw a notable drop in foreign demand amid what we reported a week ago was rampant selling of US debt by foreign central banks, moments ago the Treasury sold 3Y notes in what may have been the best auction since the start of the war.”


USD declined to 98.52 this morning, between the 52-day Moving Average at 98.48 and the mid-Cycle support at 98.56.  The Cycles Model suggests the decline may be nearly over.  The USD may have another week of testing the low.


Posted in Published | Comments Off on April 8, 2026

April 7, 2026

The Lord’s Prayer

Our Father, who art in heaven, hallowed be thy name.  Thy Kingdom come, Thy Will be done, on earth as it is in heaven.  Give us this day our daily bread and forgive us our trespasses, as we forgive those who trespass against us.  And lead us not into temptation, but deliver us from evil.  Amen

8:15 am

Good Morning!

SPX futures declined to 6565.90 this morning, possibly beginning the next phase of the decline.  Overhead resistance at 6710.00 has not been breached.  Nor has mid-Cycle resistance at 6687.39.  Instead, a minor resistance at 6628.00 may have turned the SPX back down.  The primary reason is that the rally consisted of short covering, not buying-to-own.  In fact, the buyers quit buying stocks near 6600.00 and switched to treasuries, leaving no fuel for a further rally.  The minimum decline is targeted at the Cycle Bottom at 6276.33.  An additional attractor is the 1987 trendline at 6200.00.  However, the current Master Cycle is scheduled to extend to the end of April.  There may be something more than just meeting the minimum decline.

Today’s options chain shows Max Pain at a highly contested 6600.00.  Long gamma may begin above 6630.00 and is populated to 6700.00.  Short gamma begins beneath 6550.00.  The big question is the zero-days-to–maturity options traders.

ZeroHedge reports, “US futures reversed earlier gains and oil advanced following reports that Iran’s Kharg island was targeted earlier on Tuesday, while the market was largely paralyzed ahead of Trump’s 8pm ET deadline for Iran to agree to a ceasefire or face escalation.”


The premarket VIX rose to 26.27, held aloft above the 52-day Moving Average, rising above the Cycle Top resistance and reconfirming the buy signal.  The next resistance lies at 35.30, the Head & Shoulders neckline.  The VIX is due for multiple surges of trending strength over the next two weeks.

Tomorrow’s options chain shows short gamma residing between 20.00 and 23.00.  Long gamma begins above 24.00 and stretches to 55.00.


The US 10-year Bond Yield continues to consolidate above 43.00, but may be primed to go lower as  investors switch to bonds instead of equities this week.  However, it may not last as bond volatility may begin to rise toward the end of the week.


USD is also consolidating in tandem with bonds.  The Cycles Model shows no particular strength over the next two weeks and may end next week at the correction low near the mid-Cycle support at 98.56.


Bitcoin has re-crossed beneath the 52-day Moving Average at 68638.00 this morning, reiterating its sell signal.  The sideways consolidation lasting the past two months may come to an end as the decline may gain acceleration later this week beneath support at 65000.00.


Gold may be consolidating beneath Thursday’s potential Master Cycle high at 4800.00.  The old Master Cycle appears to have run its course and a brief, new Master Cycle may be about to take its place.  With Brent and WTI both elevated, the decline may begin as early as today with a series of panic sell-offs as oil-poor countries sell gold to raise cash for oil.


Posted in Published | Comments Off on April 7, 2026

April 6, 2026

Our Father, who art in heaven, hallowed be thy name.  Thy Kingdom come, Thy Will be done, on earth as it is in heaven.  Give us this day our daily bread and forgive us our trespasses, as we forgive those who trespass against us.  And lead us not into temptation, but deliver us from evil.  Amen

9:50 am

The Banking Index may be putting the finishing touches on its retracement and an end to the current Master Cycle.  There may be a final probe to the 52-day Moving Average at 160.79 before a reversal.  However, the reversal may be confirmed beneath the mid-Cycle support at 154.65.


8:00 am

Good Morning!

SPX futures consolidated within Thursday’s trading range as the correction continues.  The Cycles Model offers short-term resistance at 6638.00-6650.00, while the mid-Cycle  line at 6685.60 may offer the ultimate resistance to the bounce.  The correction may not be likely to cross the neckline of the Head & Shoulders formation at 6710.00.  The prior Master Cycle took 61 days from top (7002.28) to bottom (6316.91).  The current Master Cycle decline may last to the end of April.

Today’s options chain suggests max Pain may be at 6515.00.  Long gamma rests above 6525.00 while short gamma becomes strong beneath 6500.00.

ZeroHedge reports, “US stock futures rose, but were off session highs (and lows) and crude oil dipped as the bipolar market focused its attention on a report of a push to secure a potential ceasefire in the war in Iran, following a reversal in those exact same hopes late last week.”


Premarket VIX rose to 25.14 this morning as it consolidated beneath the Cycle Top at 25.46.  Rising above the Cycle Top reconfirms the buy signal.  A breakout above the neckline at 35.30 puts the Head & Shoulders formation into motion.

The April 8 options chain shows Max Pain at 22.00.  Short gamma resides between 20.00-23.00.  ong gamma becomes strong above 25.00 and extends to 40.00.


The US 10-year bond yield may be in a consolidation that may extend down to the trendline at 42.00 this week, giving risk assets a temporary green light.   Once accomplished, it may renew its rally with considerable vigor.  Trending strength may return by the weekend to create a breakout above the neckline.


The USD met resistance near the Cycle Top this morning and may decline to support over the next week or so.  While Intermediate support lies at 99.13, the 52-day Moving Average at 98.54 may be a more likely target for this pullback.  Once accomplished, the USD may be ready to break out above the Head & shoulders neckline at 100.64.


Bitcoin rose above Intermediate resistance at 69384.58 this morning, but may have completed a retracement at that resistance.  If so, bitcoin may resume its decline by crossing beneath the 52-day Moving Average at 68675.00.


Crude oil rose to 115.37 over the weekend, but may have begun to pull back.  Should that be so, oil may decline over the next week or so.  A  possible support for the correction may be the 52-day Moving Average at 76.87.


Gold continues to consolidate beneath last week’s high at 4800.00.  A push to the 52-day Moving Average at 4920.00-4950.00 may end the current Master Cycle in the next few days.


Posted in Published | Comments Off on April 6, 2026

April 2, 2026

The Lord’s Prayer

Our Father, who art in heaven, hallowed be thy name.  Thy Kingdom come, Thy Will be done, on earth as it is in heaven.  Give us this day our daily bread and forgive us our trespasses, as we forgive those who trespass against us.  And lead us not into temptation, but deliver us from evil.  Amen”

10:42 am

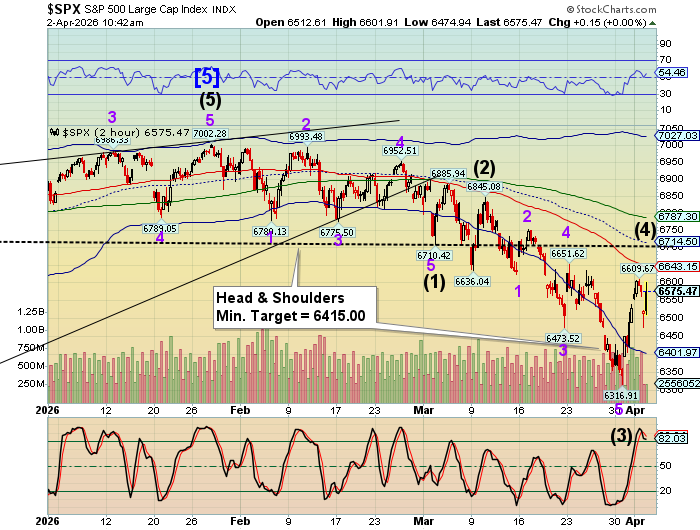
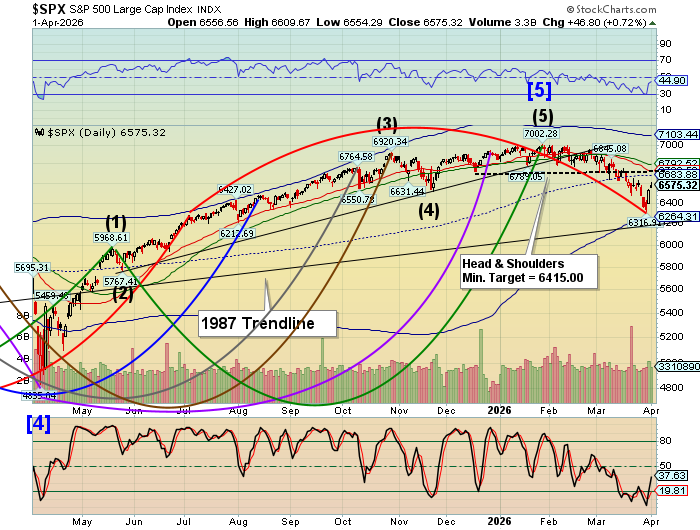
SPX may attempt a higher retacement…to Intermediate resistance at 6643.16.


10:19 am

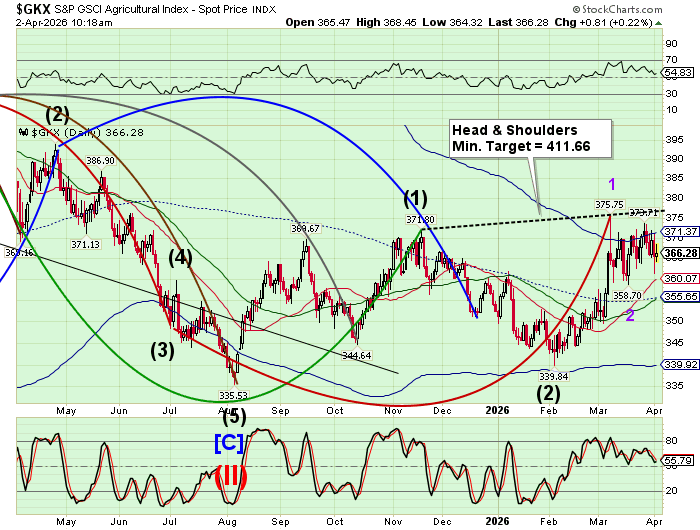
The Ag index may have bounced from Intermediate support at 360.07 yesterday.  If so, it may be completing its consolidation and preparing for a breakout above its Head & Shoulders neckline at 377.00.  The Cycles Model supports this view as it proposes a burst of trending energy this weekend.  The war in the Middle East is having a knock-on effect on our farmers that has been unnoticed until recently.

TheEpochTimes comments, “Sometimes it is just a mood. Sometimes it’s the store or the product. Regardless, I can hardly go to the grocery store these days without a sense of shock at how much I’m spending even while buying as little as possible.

Money-saving tactics—choosing cheaper venues, substituting products, just eating less—don’t seem to work anymore.”


8:15 am

SPX futures declined to a morning low at 6469.40 thus far.  The next phase of the decline may have begun, as all the stock indices have stopped cold at key resistance.  As mentioned before, the potential target may be the Cycle Bottom at 6264.31 or the 1987 trendline near 6200.00.  That is based on my primary fractal design.  The alternate design may offer a much lower target, possibly the April 2025 low.  The reason for this observation is that the new Master Cycle (decline) may extend to the end of April.

401(k) plans are under stress.  ZeroHedge remarks, “Another light on America’s economic dashboard is blinking red, as money-pinched workers are cutting their 401k contribution rates. The news follows our earlier report on hardship withdrawals from the cornerstone retirement savings accounts hitting a record high. Critically, these numbers don’t reflect what workers are doing right now — amid war-driven gas price-hikes and worries about the economy.”

Today’s options chain shows Max Pain a t6580.00.  Long gamma may begin above 6590.00 while short gamma strengthens beneath 6540.00.

ZeroHedge reports, “Global risk assets, including US equity futures and global markets, as well as Treasuries and precious metals, tumbled as oil soared with Brent hitting $110 this morning after Trump’s late Wednesday speech refused to pivot and dashed hopes that the Hormuz Strait would reopen soon and the war in the Middle East is nearing a swift resolution.”


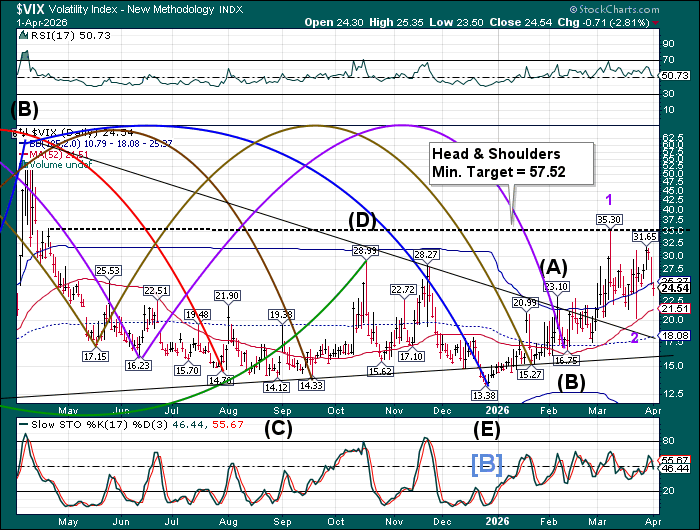
The premarket VIX rose to 27.859 this morning, above the Cycle To support/resistance at 25.37.  The VIX remains on a long-term buy signal despite the wide swings.  The current Master Cycle runs until mid-April.

The April 8 VIX options chain shows short gamma running between 20.00 and 23.00.  Long gamma begins at 24.00 and shows  institutional participation starting at 25.00 and running every 5 points to 55.00.


TNX continued its bounce from support at 43.00.  Resistance lies at the Cycle Top at 44.16 which may bring TNX back down over the next several days, as the Cycles Model allows some consolidation during that time.  However, the trend is higher and may be strengthened by a breakout above the neckline of the proposed Head & Shoulders formation.


USD is bouncing back toward the Cycle Top resistance at 100.38.  Should it break through the Cycle Top and the neckline at 100.60, it may complete its fractal near 102.00 by mid-April.  That action may offer a stronger Head & Shoulders platform from which the USD may rally.


Bitcoin resumed its decline after testing the 52-day Moving Average at 68619.00 yesterday.  Support may be found near 62000.00 which may offer another bounce over the weekend.  However, the secular trend is down, as any bounce may be met with more selling.


Crude oil ramped to 113.93 in the overnight market, adding pressure to major economies that are dependent on oil.  The irony is that crude may decline from here, causing more confusion about the trend.

ZeroHedge summarizes,

  • Oil prices surge after no mention of ceasefire while vowing to keep hitting Iran ‘extremely hard’ in Wed. night Trump speech. Surge in tit-for-tat overnight strikes.
  • US intelligence assessments say Iran is not ready to negotiate given it believes it has the strategic upper-hand, and doesn’t believe Trump is ‘serious’ about talks: NYT


Gold rose to 4825.00 overnight, then may have run out of energy as it approached the 52-day Moving Average at 4927.32.  It then declined to 4581.12 this morning.  Central banks may be forced to sell gold to buy oil.  Should that be so, gold may quickly decline beneath 4000.00.


Posted in Published | Comments Off on April 2, 2026

March 31, 2026

The Lord’s Prayer

Our Father, who art in heaven, hallowed be thy name.  Thy Kingdom come, Thy Will be done, on earth as it is in heaven.  Give us this day our daily bread and forgive us our trespasses, as we forgive those who trespass against us.  And lead us not into temptation, but deliver us from evil.  Amen”

1:43 pm

SPX had an explosion of short covering today with no catalyst, other than the shorts were due to be covered.  Intermediate Wave (3) was a monster 529 point decline in just 20 days.  It was also the end of an overdue Master Cycle.  The rebound may not last.  An estimated target may be in the range of 6550.00, where short covering may run out of steam.


8:00 am

Good Morning!

SPX futures rose to 6425.60 this morning, beneath short-term resistance at 6438.00.  The Model remains bearish.  Hedge funds and commercials are bearish.  The expected bounce did not materialize.  The Cycle Bottom at 6251.18 may now be an attractor along with the 1987 trendline near 6200.00.  While the market may be near exhaustion, there is no clear catalyst to instigate a short squeeze.   Instead, further capitulation may be at hand.

Today’s options chain shows Max Pain at 6405.00.  Long gamma may start above 6425.00 while short gamma rules beneath 6400.00.

ZeroHedge reports, “Futures are higher on a WSJ report that Trump is considering exiting the middle east conflict even if the Strait of Hormuz is not reopened; but the market is deciding whether this is a genuine intent to leave or another feint given the previous US attacks during negotiations and that Trump has yet to adjust his Apr 6 deadline.”


The premarket VIX declined to 28.28, remaining above the Cycle Top at 25.15.  The Cycles Model offers a burst of trending strength today which may elevate the VIX above the neckline of the Head & Shoulders formation.  If so, the VIX may pause before going higher.  Should that be the case, the VIX may assume leadership role in a further bear market.

Tomorrow’s options chain shows short gamma beneath 24.00 and long gamma above 25.00.


The US 10-year Bond Yield is hesitating at 43.00.  A bounce is possible, but the Cycle Top at 44.18 is offering resistance.  The Cycles Model suggests that TNX may be in a corrective mode for another week or so, as the market absorbs the reality of higher yields.


The USD rally is being blocked by the neckline of the Head & shoulders formation at 100.60.  It may consolidate for another week as TNX is also in short0term retreat.  Intermediate support at 98.79 may offer a floor from which a stronger reversal may be instigated.


Bitcoin made a second attempt at overcoming the 52-day moving Average at 68713.00, but retreated.  The next move may be to test the low at 65000.00.  Should it go lower, a panic decline may emerge by the weekend.


Crude oil climbed even higher, to 106.82 overnight, then eased down to 100.88 this morning.  The market remains uneasy above $100.00 oil.  Unfortunately a break beneath 100.00 may not last, as tensions may heat up in the second half of April.

ZeroHedge remarks, “The overnight Wall Street Journal report that President Trump told aides he is willing to wind down the U.S. military campaign against Iran even if the Strait of Hormuz remains disrupted (and appeared to confirm this narrative in a social media post this morning) comes just as the national average gasoline price hit the politically sensitive $4-a-gallon threshold, underscoring the delicate balancing act the administration is facing in managing battlefield objectives and domestic fuel costs.”


Gold rose to 4649.28 in the overnight session, but pulled back to 4600.00 this morning.  Oil priced above 100.00 is causing liquidity issues for many countries.  The major sellers of gold are central banks needing to purchase oil at elevated prices.  There may be another downdraft in gold that may go beneath 4000.00 before the price of gold recovers.


Silver rose to 73.73 this morning and may be heading lower.  The cycles Model infers the correction may not have finished yet, which may nip the budding bounce.  The downside target may be in the range of 45.00 to 55.00.  That may be a good range to start accumulating silver again.


Posted in Published | Comments Off on March 31, 2026

March 30, 2026

The Lord’s Prayer

Our Father, who art in heaven, hallowed be thy name.  Thy Kingdom come, Thy Will be done, on earth as it is in heaven.  Give us this day our daily bread and forgive us our trespasses, as we forgive those who trespass against us.  And lead us not into temptation, but deliver us from evil.  Amen”

8:00 am

Good Morning!

SPX futures declined over the weekend to 6319.10, then bounced to 6434.40 this morning.  Overhead resistance begins at 6475.00 as shorts are covered and the dealers try to regain control.  However, the next few days are both high strength and high volatility days.  The options market is becoming contentious.

Today’s options chain shows Max Pain at 6470.00.  Long gamma may begin above 6475.00 while short gamma rules beneath 6450.00.

ZeroHedge reports, “Futures are higher despite continued Iran war escalation which pushed Brent higher by around 2%…”


The premarket VIX is consolidating in the upper range of Friday’s rally.  Trending strength is due for a comeback with the neckline of the Head & Shoulders formation in view.

The April 1 options chain shows short gamma moving up to 20.00-27.00.  Long gamma begins at 28.00 and runs heavy to 40.00-50.00.


The US 10-year Bond Yield has pulled back from the neckline of the new Head & Shoulders formation, completing a Master Cycle.  The correction may take up to 2 weeks, with the upper trendline of the multi-year Triangle formation as a probable target.


The USD is testing its Cycle Top at 100.32 this morning as it approaches the neckline of a potential Head & Shoulders formation.  Today happens to be a day of strength, which may power the USD through the neckline.   The Cycles Model suggests the rally may last another three weeks, causing the dollar shorts significant pain as the dollar breaks above the neckline.


Bitcoin found support at 65000.00 after its rout on Friday and may be testing  its 52-day Moving Average at 68786.00 today.  The retracement may take less than a week, as bitcoin may be due for a further decline by the weekend.  The decline may resume to the end of April before support may be found.


Crude oil rose to a weekend high at 103.37 before pulling away.  This week may be due for either a sideways consolidation or a decline toward the 52-day Moving Average at 73.55.  Volatility may pick up during the week of April 6.


Posted in Published | Comments Off on March 30, 2026

March 27, 2026

The Lord’s Prayer

Our Father, who art in heaven, hallowed be thy name.  Thy Kingdom come, Thy Will be done, on earth as it is in heaven.  Give us this day our daily bread and forgive us our trespasses, as we forgive those who trespass against us.  And lead us not into temptation, but deliver us from evil.  Amen”

11:15 am

The minimum target for the SPX Head & Shoulders formation has been met, but there may be more downside to go.  A bounce is not out of the question, but this weekend is fraught with peril in the Middle East and private credit.

3:45 pm

We may see a bounce near 6350.00, but the decline may not be over today.

7:40 am

Good Morning!

SPX futures consolidated near 6500.00 in the overnight market, then began to decline to 6444.00, short of the Head & Shoulders minimum target.  Beneath it lies the Cycle Bottom at 6246.17.  The gradual erosion is starting to accelerate.   It appears likely that the decline may terminate close to the 1987 trendline, near 6200.00.  From that point, we may see a consolidation lasting several weeks, as shorts are being covered.  The bear market is not over, but may have a short rest.

Today’s options chain shows Max Pain at 6550.00.   Long gamma begins above 6575.00 while short gamma becomes strong beneath 6525.00.  there are substantial put walls at 6400.00 and 6300.00.

ZeroHedge reports, “Futures are sharply lower, erasing modest overnight gains and trading near session lows as Brent crude futures are back above $110 a barrel after erasing an earlier fall and knocking broader risk sentiment off course in the process.”


The premarket VIX rose to 29.84 this morning as patience wears thin on the war in the Middle East drags on.    Losses are starting to alarm investors looking for a way to alleviate the pain.  However, Wall Street advisors are cautioning against hedging, as the envision a bottom nearby.

The April 1 options chain shoes Max Pain near 25.00.  Short gamma is building beneath 24.00 while long gamma becomes very strong above 28.00.


The US 10-year Bond Yield gapped up to 44.66 this morning, above the “Cycle Top  resistance at 44.20.  45.00 is in sight today, but a pullback may be in order.  With that there is a potential of adjusting the neckline of the head & Shoulders higher.  We may allow the subsequent correction to allow guidance, as there may be 1-2 weeks of back-filling.


USD is moving cautiously higher, as it prepares a potential breakout over the weekend.  It may reach 101.50-102.00 by early next week before a consolidation lasting about two weeks.


Bitcoin fell substantially this morning and may end lower by the end of the day.  Today the Cycles model shows a double dose of (down)trending strength.  The February low may afford some support for a bounce.  Soaring oil costs must be met to keep economies afloat, causing liquidation of bitcoin.


Silver declined to 67.50 this morning, in a possible resumption of the decline.  There may be 1-2 more weeks in the decline with 45.00-50.00 as a possible support.


Gold is consolidating in place this morning, with up to 2 weeks of decline left.  A possible target may be 3800.00.


Posted in Published | Comments Off on March 27, 2026

March 26, 2026

The Lord’s Prayer

Our Father, who art in heaven, hallowed be thy name.  Thy Kingdom come, Thy Will be done, on earth as it is in heaven.  Give us this day our daily bread and forgive us our trespasses, as we forgive those who trespass against us.  And lead us not into temptation, but deliver us from evil.  Amen”

9:15 am

Good Morning!

SPX futures declined to 6600.00 before bouncing at round number support as optimism about progress in the Middle East fades.  It has been 100 days since the tech peak, 57 days since the broader SPX peaked.  The turmoil under the surface has been awful, yet the SPX has only declined (at yesterday’s close)  less than 6%.  Volatility has been suppressed, keeping the fear factor relatively low.  Single stock liquidity has all but disappeared, inducing hedge funds to use broader-based ETFs to make their moves.  Investors may be having doubts about being long into the weekend.    Are things about to change?

Today’s options chain shows Max Pain at 6610.00.  Long gamma dominates above 6625.00 while short gamma gains a clear advantage beneath 6580.00.

ZeroHedge reports, “It’s Day 27 of the war: stocks and bonds fell globally as ceasefire optimism fades given mixed messages on progress toward ending the war in Iran and growing uncertainty over Iran’s willingness to engage in talks about a ceasefire in the Middle East sent oil prices higher.”


The premarket VIX  rose to 27.84 this morning as VIX resumes its rally with the neckline of the head & Shoulders formation in view.  The Cycles Model shows the VIX rising in strength over the next two weeks.

The April 1 options chain shows Max Pain at 21.00.  Short gamma has a wall of puts at 20.00 while the call walls are at 25.00, 28.00 and 40.00.


The US 10-year Bond Yield bounced from the neckline to 43.94 this morning as it consolidates the gains leading to last week’s breakout.  It is likely to test the neckline today before resuming its rally.  The Cycles Model suggests a burst of volatility tomorrow that either drives the TBX beneath the neckline or above the Cycle Top.  The sword of Damocles hangs above this sector.

ZeroHedge reports, “Another day, another very ugly auction.

After yesterday’s appallingly bad 2Y auction, moments ago the Treasury sold $70BN in 5Y paper in what was another terrible auction.

Just after 1pm, the auction stopped at a high yield of 3.966%, up from 3.608% in February and the highest since May 2025. It also tailed the When Issued 3.966% by 1.4bps, the biggest tail since Oct 2024.”

2:00 pm

ZeroHedge reports, “After two “terrible” coupon auctions earlier this week, moments ago the Treasury concluded the week’s final auction when it sold $44 billion in 7 Year paper. It may not have been quite as terrible as the previous two, but it wasn’t much stronger either.”


The US Dollar may be resuming its upward trend this morning as trending strength may take over this weekend and early next week.  The Cycles Model allows another three weeks of rally before a pullback.  Dollar shorts may be taken behind the woodshed.


Bitcoin is testing the 52-day Moving Average at 69097.00 this morning.  A  breakdown from there may catch the hopeful bulls off guard.  The Cycles Model calls for a potential panic decline as Bitcoin slips away from support.  In addition, the Cycles Model suggests the month of April may not be kind to Bitcoin.


Crude oil rose to 94.83 this morning as its consolidates beneath the retracement high.  The Cycles Model suggests the decline may continue to mid-April, but it could be short-circuited in another week.  The 52-day Moving Average at 72.07 may offer a support for the decline.


Silver rose to 72.38 this morning before easing back down to 67.10.    There may be a week or more of decline until it hits bottom.  A likely spot may be near 45.00.


Gold is consolidating with a likely turn to a further decline.  Should the decline continue, it may reach 3600.00-3800.00.

ZeroHedge explains, “There has been much speculation about the mystery seller(s) that sent gold sliding into a bear market from its January high: was it a sovereign seeking to plug holes in their budget from the recent surge in oil, a “market maker” trying to spark stop loss liquidations, or just retail investors taking profit after one of the best years in history for the precious metal?”


Posted in Published | Comments Off on March 26, 2026

March 25, 2026

The Lord’s Prayer

Our Father, who art in heaven, hallowed be thy name.  Thy Kingdom come, Thy Will be done, on earth as it is in heaven.  Give us this day our daily bread and forgive us our trespasses, as we forgive those who trespass against us.  And lead us not into temptation, but deliver us from evil.  Amen

10:15 am

The Agricultural Index is winding up for a massive breakout this weekend as inputs (fuel, fertilizer) costs soar.  Should the Age Index rise above the neckline of the Head & Shoulders formation, the H&S target may be in reach in the next 4 weeks.

ZeroHedge remarks, “The conversation grows louder by the day as disruption at the Hormuz chokepoint hits the global nitrogen fertilizer market and, in turn, is set to impact upcoming corn and grain harvests in some key growing regions.”


7:45 am

Good Morning!

SPX futures  rose to 6633.90 this morning, partially completing its retracement of last weeks decline.  While yesterday stocks experienced a record degrossing with shorts outnumbering longs 2.5 to 1, the decline may not be over.  Sentiment is the lowest since last April, but these measures have a recency bias, assuming that “normalcy” may quickly return.  The experienced investors are still on the sidelines.  The Cycles model infers a continued decline for possibly another week before a sizable bounce.

Today’s options chain shows Max Pain at 6590.00.  Long gamma may begin above 6600.00 while short gamma dominates beneath 6575.00.  The surge in this morning’s futures may have been an attempt by the dealers to achieve Max Pain (smallest options payout).

ZeroHedge remarks, “US futures are sharply higher and oil tumbles as the US reportedly offered a15-point plan to help bring the conflict to a close triggering a global rally…”


The premarket VIX eased down to 24.85 as dealers attempt to move the SPX to Max Pain.  However, it remains above the Cycle Top support at 24.13, giving a green light to moving much higher.  Trending strength is coming back, according to the Cycles Model.  a breakout above the neckline of the Head & Shoulders formation may be imminent.

The April 1 options chain shows Max Pain at 21.00.  Short gamma shows a put wall at 20.00.  Long gamma begins at 22.00 and has a growing presence to 60.00.


The US 10-year Bond Yield pulled back to 43.07, just above the neckline of the Head & Shoulders formation before bouncing, while the cash market shows a low at 43.30.  The test of the neckline may continue for several days, with a possible lower bottom of this correction.  The Cycles Model shows this rally to be strikingly resilient and long-lasting, possibly to early June, with the target of the head & Shoulders formation in mind.

2:45 pm

ZeroHedge reports, “Another day, another very ugly auction.

After yesterday’s appallingly bad 2Y auction, moments ago the Treasury sold $70BN in 5Y paper in what was another terrible auction.

Just after 1pm, the auction stopped at a high yield of 3.966%, up from 3.608% in February and the highest since May 2025. It also tailed the When Issued 3.966% by 1.4bps, the biggest tail since Oct 2024.”


The USD is consolidating above its correction low at 98.88.  The Cycles Model shows growing strength with a possible breakout above the neckline of the Head & Shoulders formation by early next week.


Bitcoin may have put on the final touches to its retracement today at 72021.00.  The 50% retracement level is at 71700.00, so the retracement is legitimate.  Values may be different in the futures.  The decline may resume, with acceleration by Friday.


Gold continued to rise to 4633.17 in a vicious squeeze before easing back down, erasing Monday’s bloodbath.  However, the decline may resume shortly.  The panic episode and bounce-back has been spent.  However, gold may decline to a new low in the next few weeks.


Crude oil consolidates within yesterday’s range, bt may resume its decline shortly.  Current estimates put the possible low near Intermediate support at 76.74.  However, there may be a strong attraction to the 52-day Moving Average at 71.36 for the cycle low over the next three weeks.


Silver may have completed its bounce at 74.80 this morning.  From here, the decline may resume, with strong attraction to 45.00-50.00.  However, under certain circumstances it may go lower.


Posted in Published | Comments Off on March 25, 2026