December 4, 2025

The Lord’s Prayer

Our Father, who art in heaven, hallowed be thy name.  Thy Kingdom come, Thy Will be done, on earth as it is in heaven.  Give us this day our daily bread and forgive us our trespasses, as we forgive those who trespass against us.  And lead us not into temptation, but deliver us from evil.  Amen.

3:04 pm

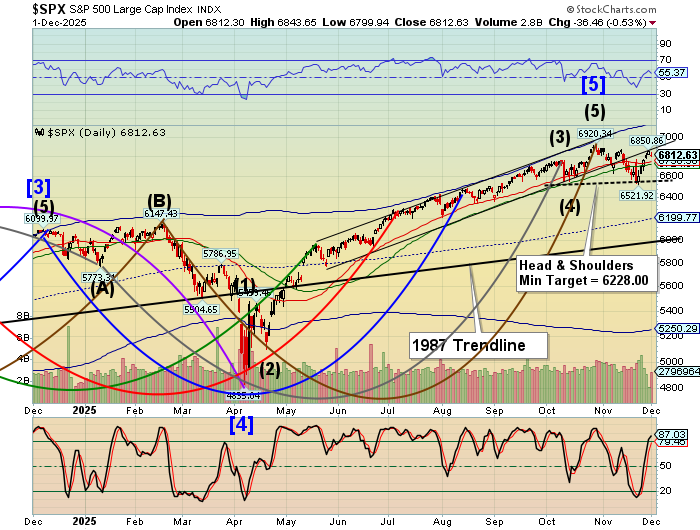
SPX is toying with the idea of a Key Reversal…a decline beneath 6810.00 would do the trick.  In addition, it would offer us an aggressive sell signal.  Further confirmation may come with a decline beneath the 52-day Moving Average at 6740.91.  The ultimate fake-out would be to close flat or slightly higher today, leaving the dirty work to be done in the overnight market.


8:00 am

Good Morning!

SPX futures consolidated beneath yesterday’s late afternoon high at 6862.42.  It did not reach the proposed target at 6875.00 – 6880.00.  This morning’s action may confirm the high or allow a brief probe higher.  The surface of the market remains calm.  However, there are swift undercurrents that may boil over at any time.  Yesterday may have offered the swing high for the current Master Cycle.  The Cycles Model suggests a possible three-week decline may be imminent.

Today’s options chain shows a much contested Max Pain level at 6850.00.  Long gamma may be found above 6900.00 while short gamma is strongest beneath 6800.00.

ZeroHedge reports, “US equity futures rise, trading less than a percent away from a new record high amid signs of a leadership rotation with Big Tech not leading the bounce this time.”


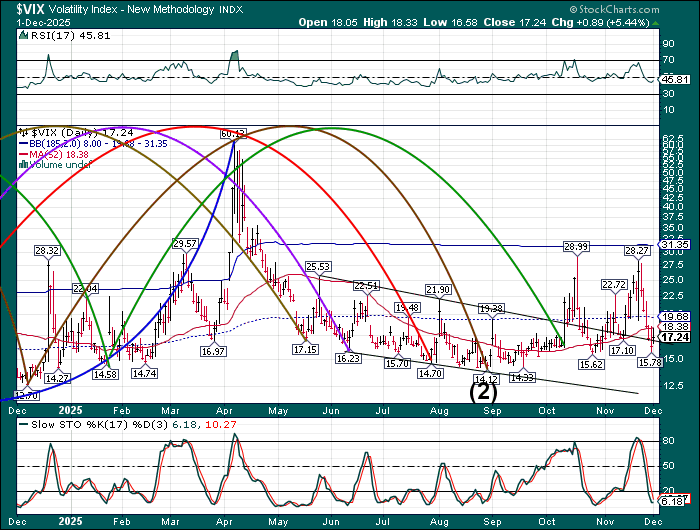
VIX futures are consolidating near yesterday’s low.  It appears sleepy, but may burst into action at any time.  The Cycles Model informs us of the possibility of a surge of strength that may be imminent.  The immediate target may be the April high.  However, a higher target may be implied.

The December 10 options chain shows Max Pain at 18.00.  Short gamma appears to be dwindling from   15.00-17.00.  Long gamma breaks out strongly at 20.00.


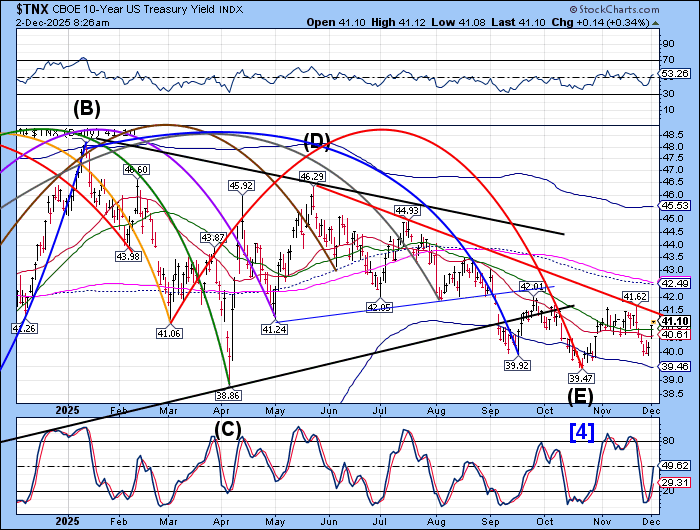
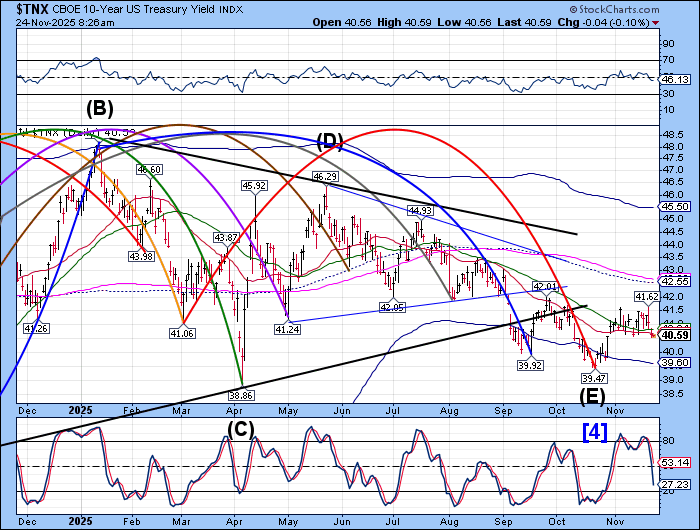
TNX broke above the 52-day Moving Average at 42.79 this morning, creating a buy signal (a sell signal for the UST).  While the breakout may remain unrecognized, the trendline lies near 41.30.  The Cycles Model offers today as a day of strength, which may propel it to, or above, the trendline,  That breakout may gain recognition that all is not well for bonds.


USD futures made a new Master Cycle low this morning.  A reversal above the 52-day Moving Average at 99.19 reinforces the existing buy signal.  The 200-day Moving Average is at 99.53, giving extra confirmation of the uptrend.  USD shorts are nervously sitting on a ticking time bomb that may erupt at any time.   The new Master Cycle may take USD higher through the end of the year.


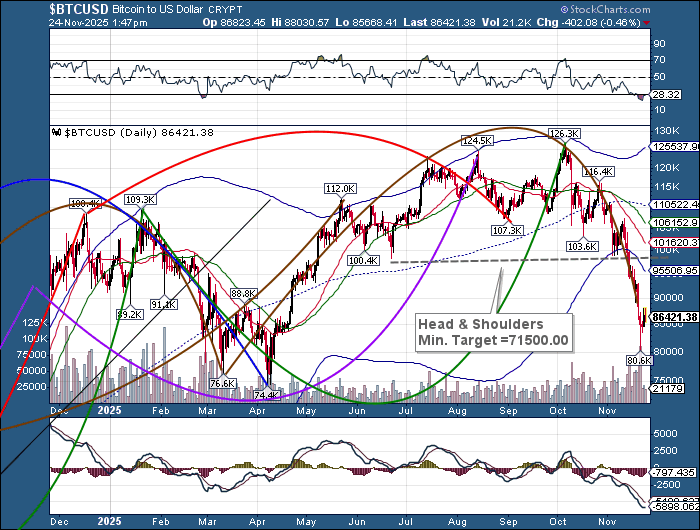
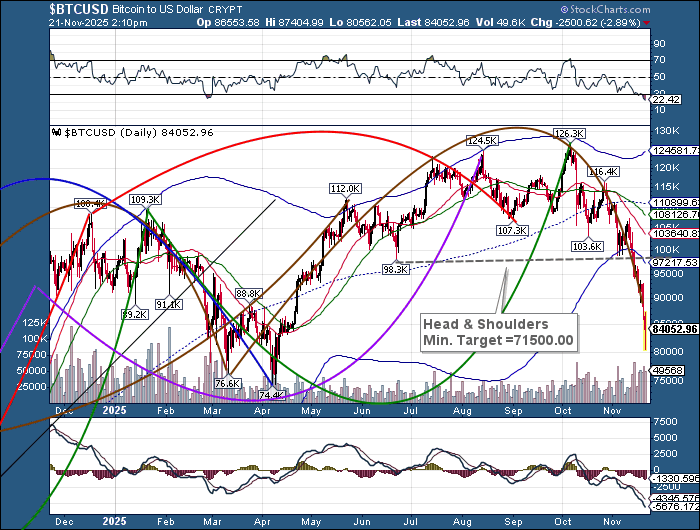
Bitcoin extended the Master Cycle to a new high at 94089.00 before pulling back.  It sits above the Cycle Bottom support at 92195.00.  A drop beneath that level reiterates the sell signal.  The new Master Cycle may be short but strong, as the Head & Shoulders formation has been triggered and must be completed.   Bitcoin is a good indicator of international currency flows.  A person my buy bitcoin in London and sell it in New York.  Bitcoin has been in decline since China outlawed its use.  Now Europe may be on the verge of implementing capital controls, which may put a nail in the coffin for bitcoin.


The Japanese Yen has risen to 64.70 this morning, exceeding its prior high.  It is on a buy signal since early this week.  Crossing above Intermediate resistance at 64.82 and the 52-day Moving average at 65.47 may strengthen the new trend as it may reach its Cycle Top at 70.95 by the end of the year.  Underlying this, the Japanese 10-year bond yield, which topped out near 1.10% in July 2024 is now approaching 2% in a parabolic move.  While the Bank of Japan claims QE, a break above 2% signals QT, which starts draining liquidity as it repatriates back to Japan.  The offshoot is that the Yen has reversed and starting to climb, causing pain in the Yen carry trade in the US.


Posted in Published | Comments Off on December 4, 2025

December 3, 2025

The Lord’s Prayer

Our Father, who art in heaven, hallowed be thy name.  Thy Kingdom come, Thy Will be done, on earth as it is in heaven.  Give us this day our daily bread and forgive us our trespasses, as we forgive those who trespass against us.  And lead us not into temptation, but deliver us from evil.  Amen.

3:40 pm

SPX may have completed its final probe higher prior to hitting the trendline, having consumed the time left in this fractal.  It may go modestly higher, but all the requirements for this formation have been met.  A sell signal may be found beneath 6810.00 with confirmation beneath the 52-day Moving Average at 6736.82.

ZeroHedge opines, “The conclusion to yesterday’s Global Daily was that we are still in a systemic metacrisis. True, many market metrics don’t show it – but how many deckchairs told the Titanic’s passengers they were heading for the iceberg? Markets have a vital role, as do chairs, but expecting them to reflect the potential enormity of what’s going on could end up with you being in very cold water.”


7:45 am

Good Morning!

SPX futures ran up to 6850.00 thus far this morning breaking out of a possible triangle formation.  The 2-hour “trading chart” is highlighted this morning to bring the triangle in sharper focus.  Should this be correct, the SPX may have the ability to rise to test the 7-month trendline at 6875.00 – 6880.00.  Triangles usually proceed a final move  in a series ending in a major reversal.

Today’s options chain shows Max Pain at 6830.00.  Long gamma prevails above 6880.00 while short gamma weighs heavily beneath 6800.00.

ZeroHedge reports, “US equity futures are higher again, led by small cap stocks. As of 8:20am ET, S&P futures are up 0.2% (they dropped following a very ugly ADP print at 8:15am), the same as Nasdaq 100 futs…”


VIX futures continue to consolidate between Friday’s low and the 52-day Moving Average at 18.40, showing very little stress.  A buy signal is found above the 52-day.  VIX has stopped its decline over the weekend when the Bank of Japan announced its consideration of higher rates after months of somnolence.  Rising rates in Japanese Government Bonds may have possible knock-on effects on multiple fronts, including the VIX.  Recall the BOJ’s announcement of higher rates in August 2024?  Something similar may be about to happen again, as the BOJ seeks to “normalize” its rates.

Today is options expiration in the VIX.   The December 10 options chain shows Max Pain at 18.00.  Short gamma is shrinking to 15.00 – 17.00.  Long gamma is rising above 19.00, but there is not a lot of long conviction yet.


The 10-Year Treasury yield has challenged Intermediate support at 40.60, but it may not last as it may be gathering strength to break out above the trendline near 41.40.  The Cycles Model shows an imminent return of trending strength that may force deleveraging of multiple markets.  Blame it on the Bank of Japan.  The gap between the JGB 10-year yield and the US 10-year yield is very wide and pressure to close the gap may bring trending strength back to TNX.


USD futures declined to 98.89, probing beneath the 52-day Moving Average at 99.07.  This may be a false signal to traders, since the current Master Cycle may have ended with this show of downside strength.  While dollar shorts may be relaxing at this probe lower, its may be gathering strength for a fiery rally, as the Cycles Model shows trending upside strength during the next three weeks.


Bitcoin just extended its Master Cycle high this morning and subsequently declined beneath its Cycle Bottom support/resistance at 92401.00. This action gives a sell signal as the decline is moving very fast.  The Cycles Model shows the decline resuming to the end of the year.


Gold futures are rising back above the Cycle Top resistance at 4231.00 this morning.  The Cycles Model shows a possible two more weeks left in the current Master Cycle, with the trendline near 4500.00.  A surge to the upper trendline is possible due to heightening international pressures.


The Japanese Yen has risen above its Cycle Bottom at 64.20, giving a buy signal.   The Cycles Model indicates a rally through the end of the year, allowing the Yen the ability to rise to its Cycle Top at 70.94.  This move may wipe out the Yen carry trade, as borrowers were anticipating ultra-low interest payments (.0025%) and a declining Yen.  Hedge funds using the Yen carry to ultra-leverage (50-1oox) their investment may already be feeling the pain.  Mutual funds and ETFs using leverage should be evaluated for their exposure to the Yen carry trade.


Posted in Published | Comments Off on December 3, 2025

December 2, 2025

The Lord’s Prayer

Our Father, who art in heaven, hallowed be thy name.  Thy Kingdom come, Thy Will be done, on earth as it is in heaven.  Give us this day our daily bread and forgive us our trespasses, as we forgive those who trespass against us.  And lead us not into temptation, but deliver us from evil.  Amen.

7:45 am

Good Morning!

SPX futures rose to a morning high at 6839.60 before easing down from its high.  A minor correction high may be complete in the next 1-2 hours.  The Cycles Model shows rising volatility for the balance of the week, suggesting the decline may resume imminently and continue over the next three weeks.  Intermediate support lies at 6750.00, beneath which a sell signal may be offered.  The 52-day Moving Average lies at 6725.00, which adds confirmation to the sell signal.  After a 1-month delay, the Fed’s balance sheet runoff (QT) ends today with a surge of Repo to the banks.  The question is, will the easing (QE) make up for the lost liquidity?

Today’s options chain shows Max Pain at 6820.00.  Long gamma may prevail above 6850.00 while short gamma resides beneath 6800.00.

ZeroHedge reports, “After Monday’s dismal start to December, US equity futures are higher (if only for the time being), although lacking conviction with few major catalysts on deck today.”


VIX futures dropped to a low at 16.66 this morning as it retests Friday’s low point beneath the trendline, having completed a 6-day decline.  The Cycles Model suggests increasing trending strength starting today and allows approximately 3 weeks of rally from here.

Tomorrow’s options chain shows short gamma residing from 15.00 to 18.00.  Long gamma begins at 19.00 and maintains strength to 25.00.


TNX is approaching its trendline near 41.50 after rising above its 52-day Moving Average at 40.81.  After having tested the 4.0% level three times in three months, it appears coiled to move much higher.   The Cycles Model allows three more weeks of rally, which may challenge the Cycle Top at 45.53.  TNX currently lags both Japan and Europe in rising rates.  Catch-up may be imminent.


USD futures bounced from the 52-day Moving Average at 99.01 yesterday and is testing the 200-day Moving Average at 99.61 this morning.  This action reiterates the buy signal for USD and the short squeeze ramps into high gear above it.  Dollar shorts have been feeling increasing pain since October.  The Cycles Model suggests a much greater intensity through the end of the year.


Bitcoin bounced from its low at 83828.00 yesterday.  The bounce may go as high as 89250.00, or near its 61.8% Fibonacci retracement at 89568.00 before before resuming its decline later this morning.  Bitcoin is trending inversely to the USD and may continue its decline to the end of December.


Gold futures rose to a high of 4269.00 before easing back to test the Cycle Top at 4223.00 this morning.  The rally may continue to rally with increasing strength over the next two weeks before ending its rally near 4500.00.


Silver futures rose to 59.072 this morning before easing back in a possible consolidation.  There are approximately two more weeks left in this rally with a possible target near 65.00.  Following that, there may be an approximate three week retracement as speculators take profits.  A retracement may decline as far as the mid-cycle support at 39.52.


The BKX persistent elevation may not last despite the resumption of repo by the Fed.  In spite of turning on the liquidity spigots, a rising 10-year Treasury note yield and Japanese Yen may adversely affect profits, as banks have been reliant on declining interest rates to stay ahead.  Rising rates may not only snuff out profitability but also reveal those institutions that have been on the brink.


Unlike the banks, insurance companies that sell life products and annuities have not recovered totally from the April 7 low.  That very fact allows the next three weeks’ decline to be a multiple of the April 7 decline.   I have not yet done a long-term Cyclical study on insurance companies, but may do so shortly.  The reason they are most at risk is because they are one of the prime users of the Yen carry trade to boost yields for themselves and their customers.  The next three weeks may be telling.


Posted in Published | Comments Off on December 2, 2025

December 1, 2025

The Lord’s Prayer

Our Father, who art in heaven, hallowed be thy name.  Thy Kingdom come, Thy Will be done, on earth as it is in heaven.  Give us this day our daily bread and forgive us our trespasses, as we forgive those who trespass against us.  And lead us not into temptation, but deliver us from evil.  Amen.

8:00 am

Good Morning!

SPX futures have pulled away from the eight-month trendline to a morning low at 6790.60 thus far.  The high-to-high mini-cycle was 21.5 market days, 34.4 calendar days.  The next mini-cycle may encompass another three weeks from high-to-low.  The decline may test the 1987 trendline near 6000.00 during this portion of the Cycle.  An aggressive sell signal may be taken beneath 6800.00.  Confirmation exists beneath Intermediate support at 6745.00.  Prior to the holiday there were concerns that the American consumer but early shopping data has allayed those fears.  Despite market fragility, analysts believe that the market may go higher.

Today’s options chain shows Max Pain at 6830.00.  Long gamma may strengthen above 6875.00 while short gamma dominates beneath 6810.00.  Massive short gamma positions have the ability to force the market lower, despite improving conditions, as speculators attempt to lock in 2025 gains.


VIX futures rose above their diagonal trendline near 17.00 to a morning high at 18.33.  Once above the 52-day Moving Average at 18.35, the VIX may rocket higher, as today is a particular day of strength.

The December options chain shows short gamma between 16.00-19.00.  Long gamma is growing between 20.00 to 25.00.


The 10-year bond yield has jumped above the Intermediate support/resistance at 40.51 this morning, creating a buy signal for TNX.  Until today, the market has been quite sanguine about yields, expecting continuously lower rates to maintain price stability.  The Cycles Model anticipates much higher rates over the next several weeks.  A possible target for yields may be the Cycle Top at 45.53.  However, should it break out above that level, it could go as high as 48.00-50.00 in short order.

ZeroHedge comments, “The Two percent inflation target—monetary policy’s sacred commandment for three decades—has become structurally impossible to achieve. Not because central bankers lack skill, but because every attempt to hit the target destroys the financial architecture that previous monetary expansion built. This is the endgame of central planning: a system that cannot tolerate its own success criteria without collapsing.”


Bitcoin was crushed overnight as liquidity has dried up dramatically due to expectations that the Bank of Japan may raise borrowing rates their highest rates in 17 years.  The BOJ has been the source of ultra-low borrowing rates, fueling the growth of monetary assets through the Yen carry Trade.  Bitcoin is a prime example of a liquidity proxy, since there are no assets backing its shares.  It rises and falls based on the availability of excess liquidity.    The Cycles Model infers that liquidity may dramatically decrease through the end of December, propelling Bitcoin to its Head & Shoulders target and possibly lower.

ZeroHedge remarks, “After an ugly November (the worst since 2018), December is continuing that trend with a big drop overnight that shook what had appeared to be a stabilizing market.

Hawkish BoJ

The overnight plunge appeared to be triggered by Japanese government bond (JGB) futures tumbling on expectations that the Bank of Japan would raise borrowing costs at its December meeting.

Japan’s 2-year government bond yield briefly touched 1.01 percent, the highest since 2008, as traders bet the Bank of Japan’s long era of near-zero rates is ending. ”


Japanese Yen futures have risen to a daily high at 64.65, above the Cycle Bottom at 64.36, creating a buy signal.  This is a warning to those participating in the Yen carry trade, as yields may go considerably higher over the next 2-3 weeks.  The reason its that loans taken out against the yen  (creating a put) must be paid back in appreciated yen, collapsing the value of the transaction.  In the past seven months, the yen has declined as much as 11%, creating a profit from the loan transaction itself.  The reversal may erase the transaction profits to the point of creating a massacre in the carry trade.  Hedge funds, banks, insurance companies and asset managers have been using the Yen carry trade as a means of juicing yields.


Gold futures broke above the Cycle Top at 4212.00 on Friday and may have broken above the November 13 high at 4245.27 over the weekend.  The Cycles Model allows approximately three more weeks of expansion to a possible target at 4500.00.  Inflows to gold ETFs and mutual funds has increased, while Bitcoin has had outflows.


Posted in Published | Comments Off on December 1, 2025

November 28, 2025

The Lord’s Prayer

Our Father, who art in heaven, hallowed be thy name.  Thy Kingdom come, Thy Will be done, on earth as it is in heaven.  Give us this day our daily bread and forgive us our trespasses, as we forgive those who trespass against us.  And lead us not into temptation, but deliver us from evil.  Amen.

8:45 am

Good Morning!

SPX futures rose to 6831.50 this morning after futures went dark at 9:45 pm due to a glitch at the CME.  Many believe is the continuation of the rally from the November 21 low.  Currently the SPX is closing at a monthly loss.  There is some pressure to push the SPX above the October 31 close at 6840.00 to end the month with a gain.  Earlier this week I had calculated the 7-month trendline to be near 6835.00.  Today is may be closer to 6850.00, so a nudge to 6840.00 may still be beneath the trendline.  Equities are still in a corrective formation and today marks the halfway point in a Trading Cycle, which allows a reversal.

Today’s options chain shows Max Pain at 6790.00.  Long gamma resides above 6800.00 while short gamma lies beneath 6780.00.

ZeroHedge reports, “Update (0830ET): CME Globex Futures & Options markets have officially reopened after their overnight ‘cooling issue’. For now, Nasdaq futs are rallying…”


VIX futures bounced off the trendline to 17.49 thus far.  Whether this is due to the “glitch” or simply time for a reversal is to be determined.  The Cycles Model allows three weeks to rally.   Today is a “Cyclical match” to the March 26 low, suggesting a rally of similar dimensions.

The December 3 options chain shows Short gamma between 15.00 and 19.00 while long gamma breaks out above 20.00.


The 10-year Treasury Note is bouncing from a morning low at 39.90 as it may resume its rally for approximately the next three weeks.


Posted in Published | Comments Off on November 28, 2025

November 26, 2025

The Lord’s Prayer

Our Father, who art in heaven, hallowed be thy name.  Thy Kingdom come, Thy Will be done, on earth as it is in heaven.  Give us this day our daily bread and forgive us our trespasses, as we forgive those who trespass against us.  And lead us not into temptation, but deliver us from evil.  Amen.

8:00 am

Good Morning!

SPX futures continued their rally overnight to 6796.60, but have eased back as the morning progresses.  Resistance lies near 6770.00, the right shoulder of the Head & Shoulders formation, which has held the cash market thus far.  In addition, the 61.8% Fibonacci level is at 6768.00, which may also resist a breakthrough.  While the SPX may go higher, liquidity is thin and additional resistances are at 6800.00 and 6835.00.  Jobless claims tumbled this morning, easing the need for the Fed to stimulate with another cut.  In the past week, hedge funds and commercials have been trapped into selling low and buying high as moves have been extremely volatile.

Today’s options chain shows Max Pain at 6735.00, which is also Intermediate support/resistance.   Long gamma is above 6750.00 while short gamma lies beneath 6725.00.


VIX futures fell to 18.05 this morning, challenging the 32-day Moving Average at 18.32.  VIX is primed for a lift-off as the uptrend recommences.  The Cycles Model suggests a minor (trading Cycle) low may be at hand.  Trending strength begins on Monday.  Enjoy the holiday!

The December 3 options chain shows short gamma between 15.00 and 19.00.  Long gamma may begin at 20.00.


TNX has made a bounce that may turn into a mid-Cycle reversal, sending yields higher.  Keep that in mind as the pending rate cut may be postponed.  A rally above the Intermediate support/resistance at 40.59 may signal a major change in attitude about yields.

ZeroHedge notes, “It was back in February, when we explained to Elon Musk why his strategy to shock the US government into spending “efficiency” through DOGE, while noble, is ultimately doomed to wit: “What Musk is doing in trying to streamline the govt is admirable but ultimately it will be Congress that decides the endgame. And there things are as status quo as always.””


Bitcoin may have completed its retracement on Monday with a high probability of a resumption of its decline.  Today is a high volatility day and the outcome may offer a possible reversal.


Posted in Published | Comments Off on November 26, 2025

November 25, 2025

The Lord’s Prayer

Our Father, who art in heaven, hallowed be thy name.  Thy Kingdom come, Thy Will be done, on earth as it is in heaven.  Give us this day our daily bread and forgive us our trespasses, as we forgive those who trespass against us.  And lead us not into temptation, but deliver us from evil.  Amen.

8:00 am

Good Morning!

SPX futures remained beneath the 52-day Moving Average at 6716.00 in the overnight market, but remained flat near 6700.00.  Should the rally continue, the 50% retracement value is 6721.00 while the 61.8 Fibonacci retracement is at 6768.00.  SPX stopped at a Cyclical pivot point (18.5 market days and 25.8 calendar days) and has the potential to decline from here.  A sell signal lies at 6650.00.  The Cycles Model suggests the market may remain relatively calm this week, with volatility spiking again in early December.  Should the SPX decline beneath its Neckline at 6521.92, the decline may gain momentum with the 1987 trendline getting serious attention.

Today’s options chain shows Max Pain at 6700.00.  Long gamma may begin at 6735.00 while short gamma rules beneath 6650.00.


VIX futures made a morning low at 19.95 and is hovering near the low.  The mid-Cycle support at 19.91 may act as a pivot point for the VIX.  The strongest portion of the rally may be imminent, with the April 7 high as a potential target.  Trending strength appears during the first week of December.

Tomorrow;s options chain shows VIX puts dominate from 15.00 to 19.00, whil calls gain strength above 20.00.


TNX continues its decline and may continue to do so for approximately three more weeks.  The Cycle bottom at 39.57 is in immediate view but TNX is capable of a throw-under.  The popular opinion is that the declining rates are due to potential Fed cuts on December 10.  They may have it backward.  Declining rates may be due to a weakening of flows into equities with a serious rotation into treasuries as equities sell off.   The Fed, which has always been behind the 8-ball, may be obliged to cut rates after-the-fact.


USD futures are testing the 200-day Moving Average at 99.73 in preparation of the final probe toward the Cycle Top at 103.00.  Dollar shorts are about to be battered as the move may only take a week or so.


Bitcoin may have made an early Master Cycle low on October 18.  Should that be the case and having made its initial bounce, it may make a pullback to the mid 80’s with a maximum to 82000.00.  The ultimate target in this retracement may be the neckline at 98932.00 by the Christmas holiday.


Posted in Published | Comments Off on November 25, 2025

November 24, 2025

The Lord’s Prayer

Our Father, who art in heaven, hallowed be thy name.  Thy Kingdom come, Thy Will be done, on earth as it is in heaven.  Give us this day our daily bread and forgive us our trespasses, as we forgive those who trespass against us.  And lead us not into temptation, but deliver us from evil.  Amen.

1:35 pm

SPX is being resisted by the 52-day Moving Average at 6716.00.  A 50% retracement of the 18.5-day fractal decline may occur at 6721.00.  Should the decline resume, this may mark the halfway point of the decline in time.  However, the decline may speed up exponentially, as it must decline 600 points to its Head & Shoulders target listed on the chart.  To help the decline, short gamma beneath 6660.00 may add to the impetus.

7:560 am

Good Morning!

SPX futures ran up to 6653.10 before easing back.  A 55% retracement was completed on Friday after Thursday’s gap higher, then reversal of 249 points to a new low.  Each bounce (reversal) has been successively smaller.  The first bounce retraced 82%.  The second bounce 66% and the third (Friday’s)bounce 55%.  The buy-the-dip urge has become successively weaker as liquidity has become thinner.  The Head & Shoulders neckline has been crossed, suggesting a panic may ensue at its second crossing.  Instead of buying the dip, the chase has turned to downside protection.   The Cycles Model suggests the aftermath of Friday’s mega-volatility is not over.  The next couple of days could be telling.

Today’s options chain shows Max Pain at 6660.00.  In other words, SPX is opening deeply in short gamma which may feed on itself as more investors seek downside protection.

ZeroHedge reports, “US equity futures are higher, but off their overnight highs, as the market looks to rebound from its worst week since early Oct; sentiment was lifted after shares of Alibaba jumped 4.7% in Hong Kong after a strong debut for its AI app; also boosting futs was a spike in December rate cut hopes and bullish comments from Morgan Stanley’s Michael Wilson.”


VIX futures declined to 22.43 this morning, a 65% retracement of Thursday’s rally.  A breakout may seek the April 7 high as a potential target.  The Cycles Model suggests that the Volatility that started last week may not be over.

The November 26 options chain shows that long gamma is firmly in place at 20.00 and above.  Short gamma beneath 20.00 is dwindling.


The 10-year US Treasury Note has slipped beneath the 52-day Moving Average at 40.84.  The Cycles Model suggests today may show a strong decline as trending strength prevails.  Normally the decline may stop at the Cycle Bottom at 39.60.  However, it anticipates the decline to take another 4 weeks…


USD futures are consolidating above the 200-day Moving Average at 99.82.  It may have another week or so to rally with strength, suggesting the Cycle Top at 103.06 may be its intended target.


Bitcoin may yet decline to its Head & Shoulders target as international liquidity collapses.  Europe and Japan are both in dire straits.  Governments are closing the doors to money attempting to flee to the US which may have knock-on effects domestically.


Posted in Published | Comments Off on November 24, 2025

November 21, 2025

The Lord’s Prayer

Our Father, who art in heaven, hallowed be thy name.  Thy Kingdom come, Thy Will be done, on earth as it is in heaven.  Give us this day our daily bread and forgive us our trespasses, as we forgive those who trespass against us.  And lead us not into temptation, but deliver us from evil.  Amen.

1:05 pm

This morning’s 10:40 commentary mentioned the neckline at6575.00 as a limit to the bounce in error.  I had overlooked the massive wall of puts at 6600.00.  The bounce crossed above the put wall in order to shake out the contracts or to allow the options sellers to short that level.  Most investors think of put options as “insurance” against a loss.  They are not.  Dealers must daily front-run the options chain to maintain their ability to pay off an in-the-money put at the end of the day.  In other words, the risk of a loss does not disappear.  It is merely transferred to the seller of the option.  The SPX may resume its decline as the options sellers have to “double down” with their own short sale.


10:40 am

SPX has ended its bounce sooner than expected and has declined beneath yesterday’s close.  The Head & Shoulders neckline resisted the bounce and, should the bounce repeat, may cap the effort again.  This is not a dip to be bought.  The Head & Shoulders target may be realized in a matter of days.


7:45 am

Good Morning!

SPX futures made a 5:00 am low at 6507.90, then began ramping higher to meet the AM $1.3 trillion options expiration in the SPX.  This may be the largest November options expiration, ever.  Various reasons were given for yesterday’s disaster.  However, one important reason was missing…short gamma.  Thursday’s gap open may have been a play by the dealers to rise out of short gamma beneath 6700.000.  Having hit the right shoulder resistance of the Head & Shoulders formation at 6770.35, selling began again in earnest, declining 232 points at the close.  Unless dealers can rise to Max Pain (least option payout) at 6650.00 at today’s open, dealer options pain (payout) may be enormous.  Dealers have had a cushy ride during the bull market, since 30-40% of all options expire worthless, while 50-60% are closed out prior to expiration, leaving a very small payout by the dealers.  This may be changing.  The Cycles Model calls for a possible bounce, followed by a resumption of the decline by mid-morning, with strength,  through the weekend.

Today’s options chain shows Max Pain (least payout) at 6650.00.  Long gamma  begins above 6700.00, while short gamma strengthens beneath 6640.00 with a put wall at 6600.00.

ZeroHedge advises, “10 Things You Shouldn’t Miss This AM…”  (A must read.)


VIX futures consolidated beneath yesterday’s high, preparing for the largest momentum spike since April.  A possible target for this move may be the April 7 high.

The November 26 options chain shows short gamma beneath 19.00 while long gamma is now firmly ensconced above 20.00 with significant long holdings as high as 50.00.


TNX is pulling back beneath the 53-day Moving Average at 40.83 this morning in a minor Trading Cycle low.  The pullback may be due to a rotation out of stocks into bonds as equities may be shaken again today.  It is not anticipated to last, as trending strength may surge by early next week, sending yields higher.


Bitcoin investors panicked again last night as speculators have lost their confidence that a bottom has been made, making a new low at 80562.00.  The Head & Shoulders target is in view as the Cycles Model suggests the Master Cycle may be complete by mid-week. Be aware that bitcoin may be an international proxy for liquidity, the effects of which may spill over into the US markets.


USD futures rose to 100.40 this morning as foreign investors come to the USD as a safe haven.  The Cycles Model calls for a surge in trending strength starting today and lasting to early December as the Yen and Euro weaken.    It is possible to see the USD rise to its Cycle Top resistance in the next two weeks.


Posted in Published | Comments Off on November 21, 2025

November 20, 2025

The Lord’s Prayer

Our Father, who art in heaven, hallowed be thy name.  Thy Kingdom come, Thy Will be done, on earth as it is in heaven.  Give us this day our daily bread and forgive us our trespasses, as we forgive those who trespass against us.  And lead us not into temptation, but deliver us from evil.  Amen.

1:45 PM

YOU CAN’T SAY I DIDN’T WARN YOU.  SPX is back at the neckline… and sinking.  SPX may be due for a possible bounce, but don’t count on it going places.  Regardless whether it closes above or beneath the neckline, the formation has been triggered.  I have been warning for over a week that tomorrow would be a disaster in the making.  The Cycles Model infers a double strength down day, suggesting we may see a limit down (7% decline) the first thing in the morning either tomorrow or Monday, or both.  The first thing to start blowing up is the leveraged long funds and ETFs, as the neckline measures a 5% decline from the top.  Should the SPX go beneath 6228.00, (a 10% decline from the top) margin calls may begin.  No one will have the ability to sell, so stop losses may be useless, or worse, since a stop loss has no limit on how low it can be exercised in a panic down day. I am speaking from over 40 years of experience.  The impossible becomes possible in a panic day.


10:03

Recent activity in the SPX has revealed an expanded Head & Shoulders formation, shown above.  It surpassed the Intermediate resistance at 6746.00, but the right shoulder was halted near the 61.8% retracement value at 6757.36 and the peak of the left shoulder at 6764.58.  This is a classic formation and fits very well with the Cycles outlook.  Crossing the Intermediate support at 6746.00 may offer an aggressive sell signal, while beneath the 52-day Moving Average at 6716.18 may confirm the sell signal.  Stay alert!

11:33 am

BKX is back beneath the 52-day Moving Average at 149.93 and on a confirmed sell signal.  The Minimum target appears to be the mid-Cycle support at 136.52, while the intermediate target may be the April 7 bottom at 99.68.  The Fed may be too little, too late to curb the negative impact of higher rates and thinning (ice) liquidity.

RealInvestmentAdvice posits, “In our last article, QE Is Coming, we focused on why the capital and financial markets have become so dependent on the Fed for liquidity.  The article explains that, in the aftermath of the crisis, a slew of regulations drastically changed the liquidity landscape. As a result, the Fed—not the private market—is now the primary provider of liquidity.’


7:45 am

Good Morning!

SPX futures rose to6736.90 on the news of the Nvidia earnings blowout.  It surpassed the 50% retracement level at 6723, then paused.  Intermediate resistance lies at 6744.00.  The Cycles Model allows another day or so of higher values after a small pullback. The 61.8% retracement lies at 6757.00, should it make it that far.  Friday, monthly options expiration, may be extremely volatile in equities.  Sentiment is higher overnight, but the (late) October payrolls and upcoming November payrolls look weak, while future performance may be constrained, unable to live up to today’s numbers.

Today’s options chain shows Max Pain at 6690.00.  Long gamma may begin above 6700.00 while short gamma resides beneath 6689.00.  Tomorrow’s am expiry shows Max Pain at 6700.00.


VIX futures pulled back to 20.33, still above mid-Cycle support at 19.72, where it may find support.  Further support may be found at the 52-day Moving Average at 17.77.  The Cycles Model shows an explosive move in the VIX starting on Friday and extending over the weekend.  Velocity may expand in December.

The November 26 options chain shows long gamma coming in strong at 20.00 and above, while the sentiment for short gamma weakens.


The US 10-year Note edged slightly above its sideways consolidation, then pulled back.  It may test the 52-day Moving Average at 40.83 for support, then forcefully launch higher over the weekend.  The uptrend may extend for another month.

ZeroHedge reports, “In this week’s lone coupon auction, which just happens to print an hour before the release of the October FOMC minutes, moments ago the US sold $16BN in 20Y bonds at a high yield of 4.706%, up 20bps from 4.507% last month and the highest since August. The auction also tailed the When Issued 4.704% by 0.2bps, the first tail since June.”


USD futures may be consolidating above its 200-day Moving Average at 99.88 after yesterday’s breakout.  Short sellers are caught with a deer-in-the-headlights look as the breakout signals a terrific short squeeze ahead.  The Cycles Model implies short covering may begin tomorrow with vigor, lasting into the first week of December.


Bitcoin is hovering above its November 18 low at 88529.00, contemplating another probe lower over the weekend.  The Cycles Model suggests that Bitcoin may extend its Master Cycle as far as mid-week, with up to two high velocity probes lower.  Bitcoin is a pure liquidity play, as it may be used to launder money and move assets across borders.  Governments are limiting/prohibiting the use of Bitcoin and other CBDCs as a means of keeping capital from fleeing.  The loss of capital inflows has only indirectly affected US liquidity thus far.


Posted in Published | Comments Off on November 20, 2025