
The Lord’s Prayer
Our Father, who art in heaven, hallowed be thy name. Thy Kingdom come, Thy Will be done, on earth as it is in heaven. Give us this day our daily bread and forgive us our trespasses, as we forgive those who trespass against us. And lead us not into temptation, but deliver us from evil. Amen.
1:35 pm

SPX is being resisted by the 52-day Moving Average at 6716.00. A 50% retracement of the 18.5-day fractal decline may occur at 6721.00. Should the decline resume, this may mark the halfway point of the decline in time. However, the decline may speed up exponentially, as it must decline 600 points to its Head & Shoulders target listed on the chart. To help the decline, short gamma beneath 6660.00 may add to the impetus.
7:560 am

Good Morning!
SPX futures ran up to 6653.10 before easing back. A 55% retracement was completed on Friday after Thursday’s gap higher, then reversal of 249 points to a new low. Each bounce (reversal) has been successively smaller. The first bounce retraced 82%. The second bounce 66% and the third (Friday’s)bounce 55%. The buy-the-dip urge has become successively weaker as liquidity has become thinner. The Head & Shoulders neckline has been crossed, suggesting a panic may ensue at its second crossing. Instead of buying the dip, the chase has turned to downside protection. The Cycles Model suggests the aftermath of Friday’s mega-volatility is not over. The next couple of days could be telling.
Today’s options chain shows Max Pain at 6660.00. In other words, SPX is opening deeply in short gamma which may feed on itself as more investors seek downside protection.
ZeroHedge reports, “US equity futures are higher, but off their overnight highs, as the market looks to rebound from its worst week since early Oct; sentiment was lifted after shares of Alibaba jumped 4.7% in Hong Kong after a strong debut for its AI app; also boosting futs was a spike in December rate cut hopes and bullish comments from Morgan Stanley’s Michael Wilson.”

VIX futures declined to 22.43 this morning, a 65% retracement of Thursday’s rally. A breakout may seek the April 7 high as a potential target. The Cycles Model suggests that the Volatility that started last week may not be over.
The November 26 options chain shows that long gamma is firmly in place at 20.00 and above. Short gamma beneath 20.00 is dwindling.
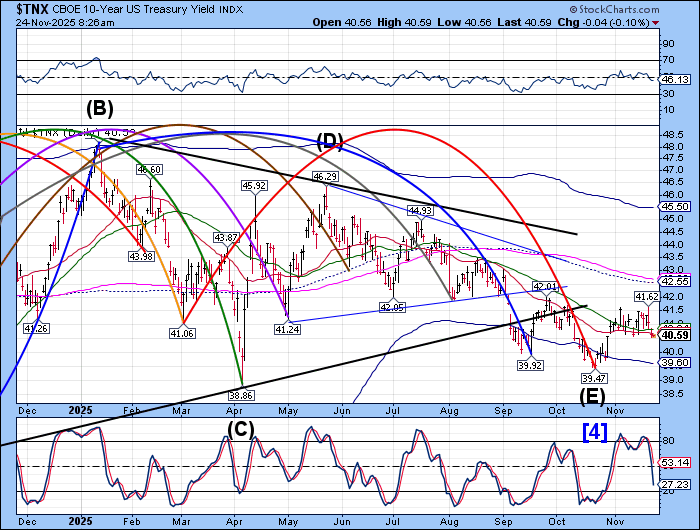
The 10-year US Treasury Note has slipped beneath the 52-day Moving Average at 40.84. The Cycles Model suggests today may show a strong decline as trending strength prevails. Normally the decline may stop at the Cycle Bottom at 39.60. However, it anticipates the decline to take another 4 weeks…

USD futures are consolidating above the 200-day Moving Average at 99.82. It may have another week or so to rally with strength, suggesting the Cycle Top at 103.06 may be its intended target.
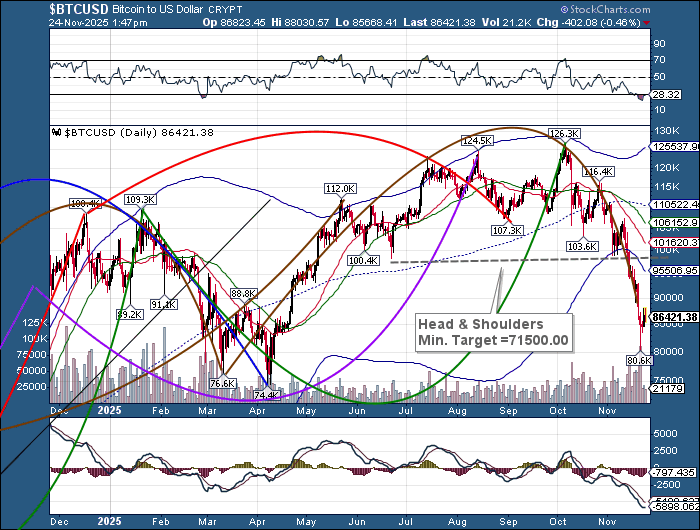
Bitcoin may yet decline to its Head & Shoulders target as international liquidity collapses. Europe and Japan are both in dire straits. Governments are closing the doors to money attempting to flee to the US which may have knock-on effects domestically.