
The Lord’s Prayer
Our Father, who art in heaven, hallowed be thy name. Thy Kingdom come, Thy Will be done, on earth as it is in heaven. Give us this day our daily bread and forgive us our trespasses, as we forgive those who trespass against us. And lead us not into temptation, but deliver us from evil. Amen
7:45 am
Good Morning!
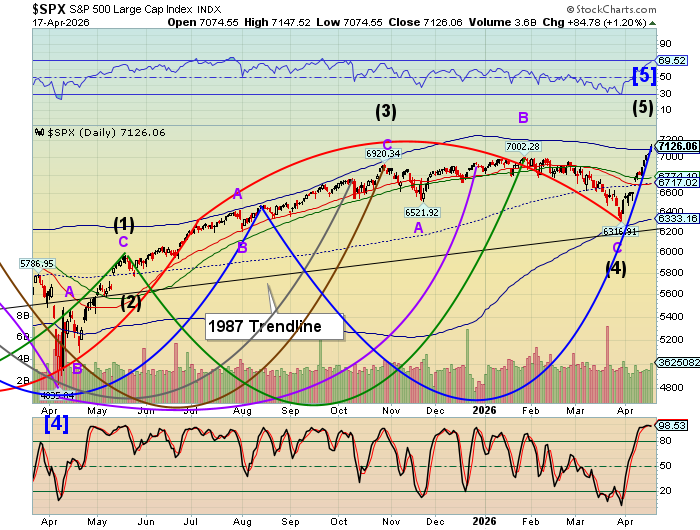
SPX futures declined to 7049.50, tripping through the Cycle Top support/resistance line at 7100.89. This offers an aggressive sell signal, which may be roughly translated, “Don’t be long. And consider shorts.” Talk of a “Pull Back” is starting to emerge. Others use the descriptive “Bull Trap.” The next support is the 52-day Moving Average at 6774.40, which may confirm the sell signal. Friday’s high was early, so we may stand aside for the next week to see what supports may be broken. Note, however, that the potential target for the SPX may have been met.
Today’s options chain shows Max Pain at 7120.00. Long gamma rules above 7130.00 while short gamma resides beneath 7125.00. There’s not a lot of wriggle room in this arrangement.
ZeroHedge reports, “Futures are lower, but well off session lows,after a weekend of chaos in the Strait of Hormuz cast doubt over US-Iran peace talks ahead of Tuesday’s ceasefire expiration. On Saturday, Iran said the Strait will be closed until the US blockade is lifted, with ships reporting attacks.”
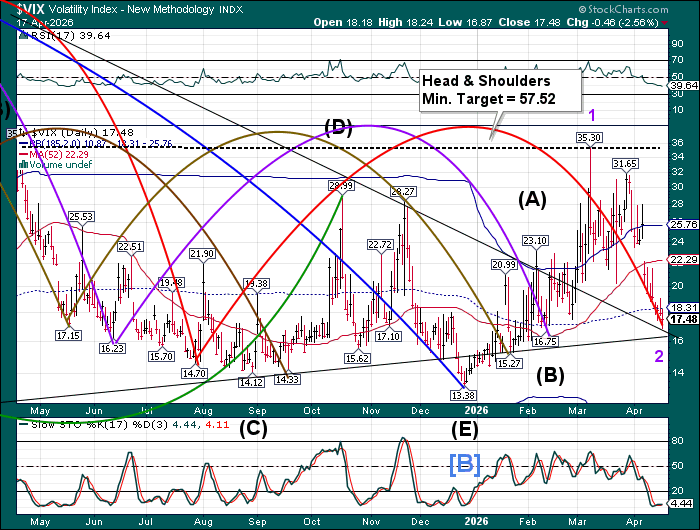
The Premarket VIX has risen to a weekend high at 19.99 after bouncing from the Triangle formation on Friday. It is now above the mid-Cycle support, giving it a buy signal. VIX may be experiencing a “release” from the downside pressure that Friday’s options expiration may have created, thereby ending the most recent Master Cycle.
The April 22 options Chain shows Max Pain at 18.00. Short gamma offers a put wall at 16.00 while long gamma may start at 20.00 with diminishing strength up to 40.00.
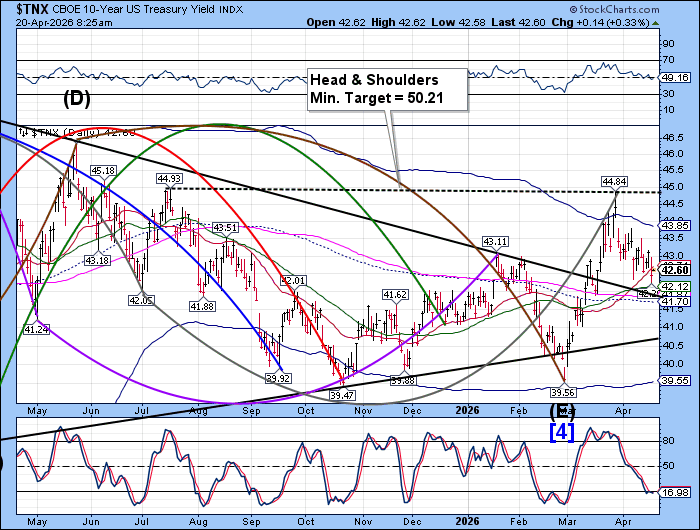
TNX may have bounced from its pullback low above the 52-week Moving Average at 42.12 on Friday. The secular buy signal may be reinstated above the Intermediate support/resistance at 42.71. The Cycles Model shows trending strength making a comeback this week.
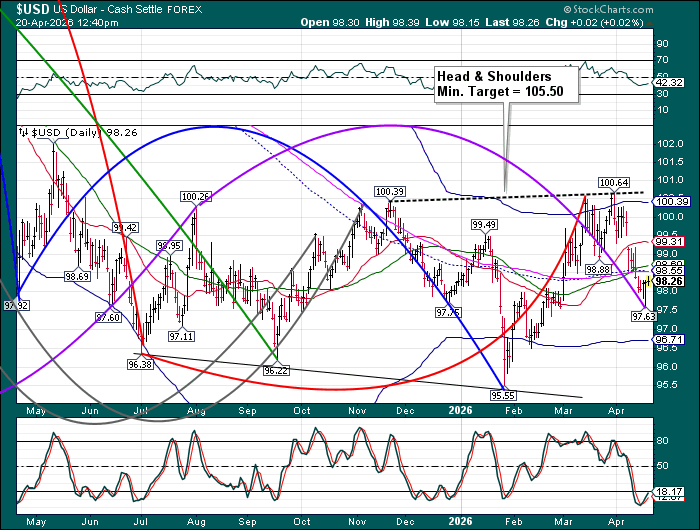
USD has bounced from a deep Master cycle low on Friday. A further rise above the 52-day Moving Average at 98.55 gives it a buy signal. Dollar bears should beware, the cycle Model offers two episodes of trending strength this week, which may propel the USD to, or above, the neckline of its Head & Shoulders formation.
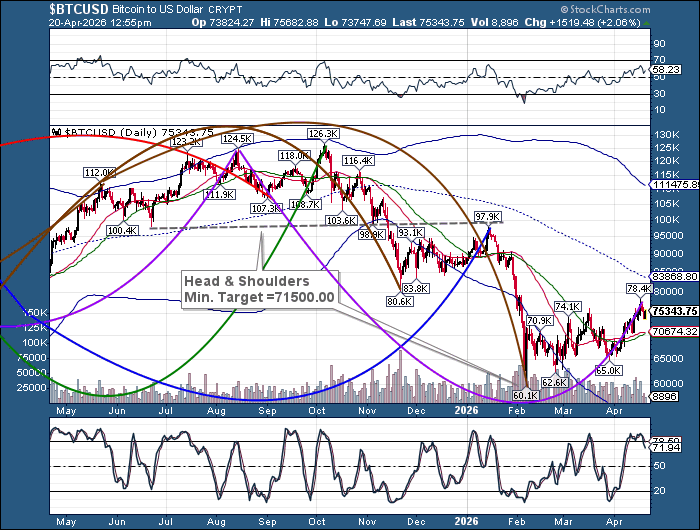
Bitcoin made a possible master cycle high on Friday at 78372.00. While early, the fractal image appears to be complete. Should bitcoin go higher, its potential target may be the mid-Cycle resistance line at 83868.80. On the downside, support lies at the 52-day Moving Average at 70374.00.
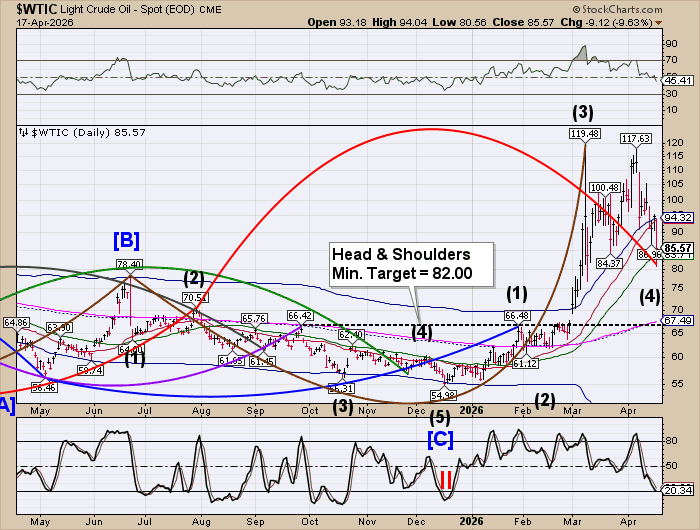
Crude oil made its Master Cycle low at 80.56 on Friday. It advanced to 89.55 over the weekend before a small pullback this morning. Crude is going into a high energy week, with multiple bursts of trending strength that may launch it above resistance at 94.32. The cycles Model gives oil a five week rally that may venture above the March high at 119.43. A potential Head & Shoulders formation lies above the March top. Crude may be back in the driver’s seat, making equities vulnerable.
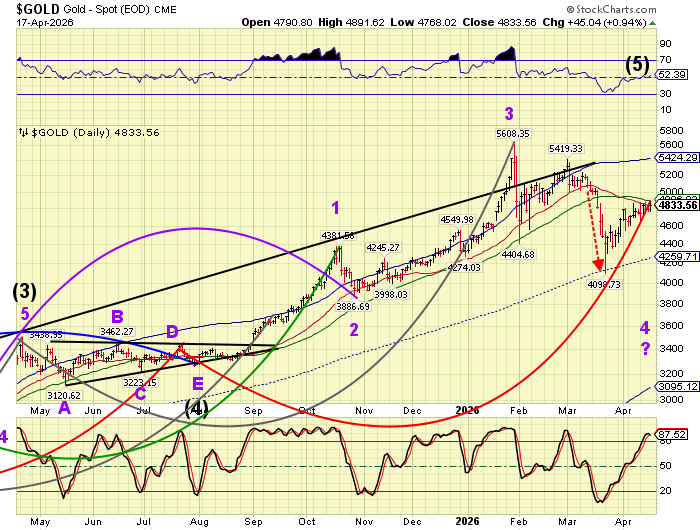
Gold plummeted to 4752.00 over the weekend before a small bounce. It had completed a Master cycle high on Friday at 4891.62 and is now on its way to test the recent low. Today shold show another surge of weakness, according to the cycles Model. Support lies at the mid-Cycle line at 4259.71 and again at the October low at 3886.69 for the decline.