
The Lord’s Prayer
Our Father, who art in heaven, hallowed be thy name. Thy Kingdom come, Thy Will be done, on earth as it is in heaven. Give us this day our daily bread and forgive us our trespasses, as we forgive those who trespass against us. And lead us not into temptation, but deliver us from evil. Amen
11;45 AM
Good Morning!
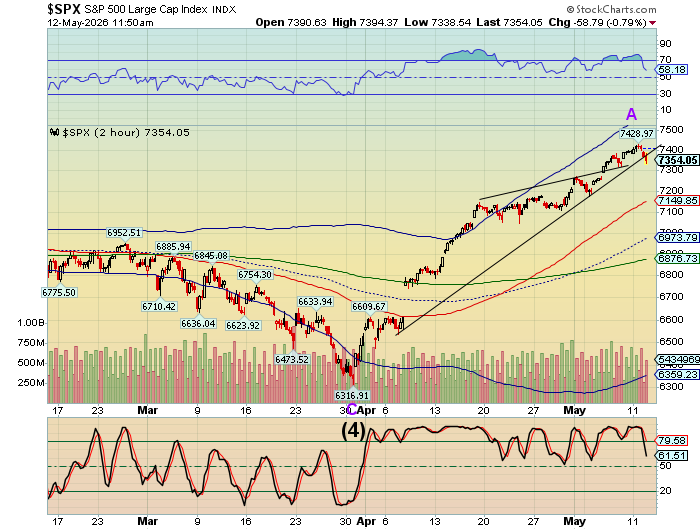
SPX opened beneath tis 6-week trendline, giving a sell signal. This decline may be rather fast, especially since its starts on a high intensity down day. Support may be found at the 52-day Moving Average currently found at 6879.10. This decline is labeled as Wave B, which can be unpredictable. Investors have been chasing the market with calls, $2.6 trillion purchased last week alone. This may not end well, since expired calls are worthless. Can you imagine trillions of dollars going up in a puff of smoke?
ZeroHedge reports, “US equity futures and bonds were lower as oil climbed, with a key inflation report showing the impacts of higher energy and supply disruptions stemming from the war in Iran. Stocks are poised to fall from all-time highs after the core CPI rose more than expected in April. As of 9:15am S&P futures ewere down 0.2% and Nasdaq futures dropped 0.7% as a slide in chipmakers and big tech names dragged down the market in early US hours.”
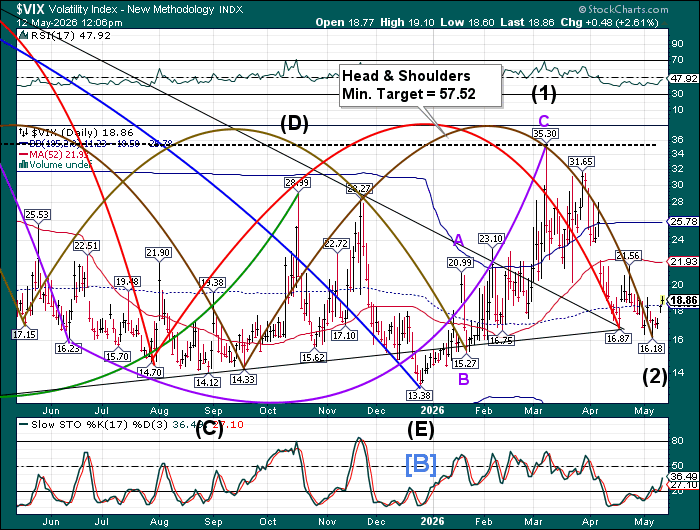
VIX rose above its mid-Cycle resistance at 18.59, allowing a buy signal. The May 6 Master Cycle low held. The next resistance is the 52-day Moving Average at 21.93. Beyond that lies the Head & Shoulders neckline at 35.30. This rally may be complex, as the month of june may turn positive in the SPX. Virtually no on has been buying protection, just when it’s needed. Downside hedges are still inexpensive.
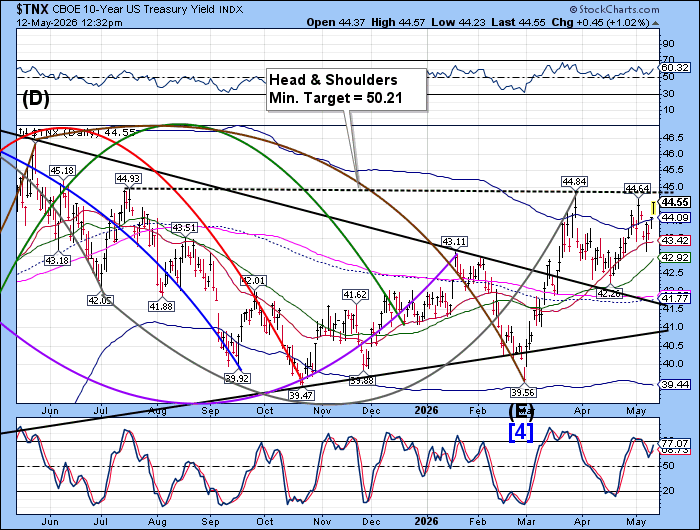
The US 10-yar Bond Yield is climbing aggressively. The Cycles Model indicates a potential breakout. If so, there may be a consolidation above the Neckline prior to impulsing toward its intended target. Long bonds are getting squeezed.
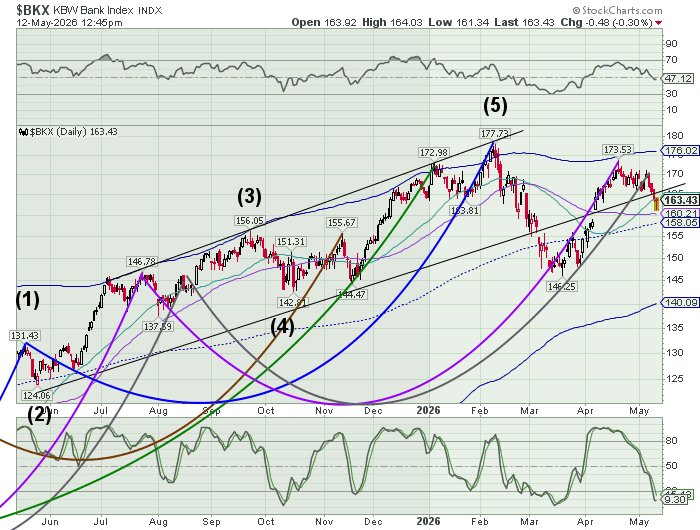
BKX bounced off the 52-day Moving Average at 160.21, but may be resisted at the Intermediate level at 164.10. Should resistance hold, the decline may continue beneath the 52-day. Barring a massive save, the decline may continue another three weeks.
ZeroHedge comments, “Did you already read about how subprime auto is imploding behind the scenes of the market, while “investors” chase gamma squeezes higher in an ongoing distortion feedback loop that is making things look far better than they are under the surface?
Good. Now let me offer up a reminder of another sector of the market that’s also still imploding behind the surface.”
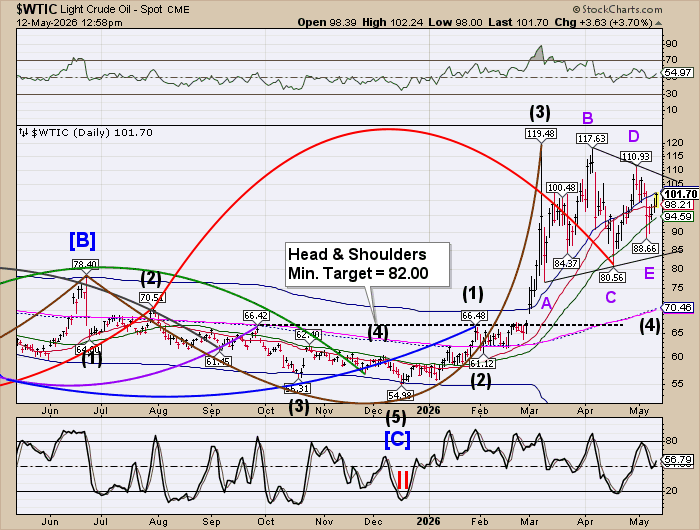
Crude oil is testing the Cycle Too at 102.57 today. There may be only two more weeks in the current Master Cycle, so crude is at a crossroads. The Triangle formation implies a quick decline to the lower trendline near 85.00, giving consumers a possible break in gasoline prices over Memorial Week. An upside breakout may nullify the Triangle formation and speed crude higher.