
1:56pm

NDX bounced just above its 50-day Moving Average and shows no intention of taking back its losses. Based on the Chart Model, NDX is likely to retest the mid-Cycle resistance at 13531.05 before going lower. A decline beneath the 50-day opens the possibility of testing the March low. In addition, the volume of selling in the NDX may bleed over to the blue chips, as well.
ZeroHedge observes, “Two weeks ago, Bank of America warned that it had observed a sharp reversal to “increasingly euphoric sentiment” among its institutional, hedge fund and HNW clients, all of whom sold in the previous week even as stocks continued their grind higher. This happened around the time that Goldman’s Prime Brokerage had observed a startling streak as hedge funds sold stocks for 7 days out of 8, which prompted us to warn that a short squeeze was coming… we were right, because just a few days later the S&P was back at all time highs on – you guessed it – another whopping short squeeze.
Then, last week, when looking at its latest client flow data, BofA found that bearish sentiment accelerated and for the second week in a row the bank’s clients were net sellers (-$2.0B) of US equities with net sales in both single stocks and ETFs (only the third time this year clients sold ETFs), while retail clients were the “least dumb money”, and according to BofA were once again the only client group to buy stocks, albeit at the weakest level since mid Feb.
So after two consecutive weeks of sheer “smart money” revulsion did buyers finally emerge?
Well, according to the latest BofA Client Flow Trends report published overnight, not only did buyers not return – as the bank’s clients were net sellers (-$2.2B) of US equities for the third week in a row…”
10:12 am

SPX has declined beneath its “negative gamma” line at 4150.00. This could lead to more declines as dealers and hedge funds shed their longs. The decline is further reinforced beneath the Wave [iv] low at 4118.38.
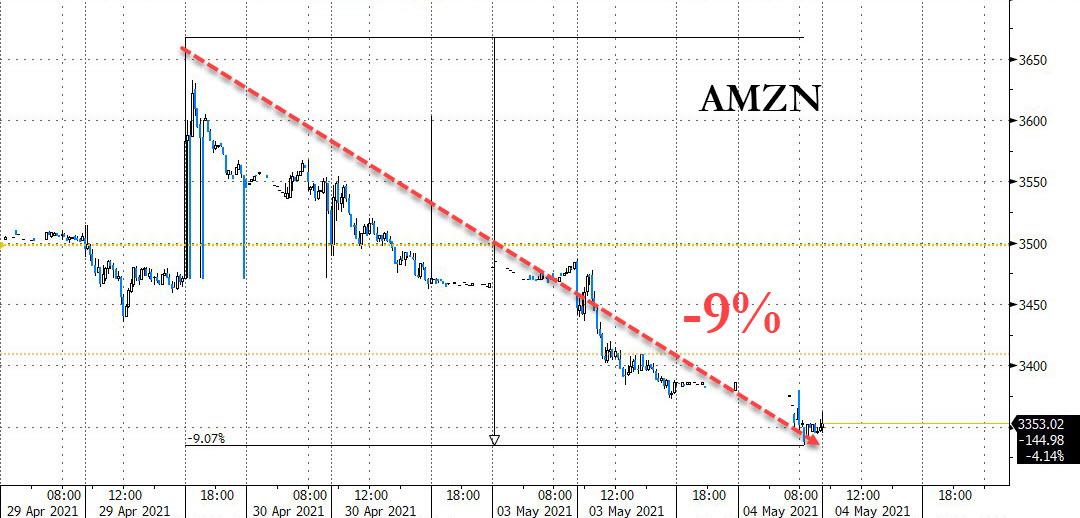
ZeroHedge remarks, “Just like late February, when we had 2021’s first inflation scare-cum-Treasury tantrum, Tech is breaking down and look no further than Amazon for the evidence. In just the three days since reporting blowout Q1 earnings which sent its stock to a new all time high, AMZN stock is down over 9% and is on the verge of a correction. Other FAAMGs, most notably Apple which had a just as impressive quarter, are not faring any better.
However, unlike late February when tech was monkeyhammered largely due to sharply higher yields, this time there is the double whammy of dealers caught in a self-reinforcing negative gamma trap. As SpotGamma wrote overnight, “both SPY & QQQ remain in negative gamma territory which implies higher relative volatility.”
10:05 am

VIX has rallied above the 50-day Moving Average at 20.26. It may retest the area and go back beneath it. However, it has now broken out which gives us a buy signal (SPX sell). Time to take appropriate action.
9:52 am

NDX is well on its way toward the mid-Cycle (2-hour) at 13526.70 and the 50-day Moving Average at 13352.96. The signal changes from aggressive to confirmed beneath the mid-Cycle.
My daughter took her 4-month old baby girl to the doctor’s office for her evaluation. She was given an MMR shot and the nurse started pushing hard to administer a series of vaccines, including the covid shot! My daughter wisely refused, but she was shaken by this experience. My daughter is an RN and knows her medicine. How many others just “trust the science?” Consider this website that monitors the VAERS site. People are catching on that something is not quite as it seems. See for yourself.
7:37 am

NDX futures made a new low at 13652.62 thus far this morning. It appears to be heading for mid-Cycle support at 13525.60 for a bounce. Having made a new low beneath the April 22 low adds confirmation to the aggressive sell signal. However, should it bounce, it may retest Short-term resistance at 13902.76 before resuming its decline. The Cycles Model tells us a low may be expected during the week of May 17.

SPX futures declined to a low of 4162.12 thus far, adding confirmation to the aggressive sell signal. The decline is still shallow, so a decline beneath the April 20 low at 4118.38 may also trigger the VIX over its 50-day Moving Average.
ZeroHedge reports, “For the second day, US equity futures traded in a narrow range, dipping during the muted Asian session where markets in Japan, China and Thailand remained closed on Tuesday, but then rebounding as Europe came online to trade mostly unchanged as investors continued to move out of megacap growth stocks amid fears of rising inflation and into companies that are expected to benefit more from the reopening of economies. At 715 a.m. ET, Dow e-minis were up 17 points, or 0.06%, S&P 500 e-minis were down 4.00 points, or 0.1%, and Nasdaq 100 e-minis were down 42 points, or 0.30%. The dollar jumped, while Treasuries dropped along with most European bonds. Ethereum extended its surge to set another record as larger rival Bitcoin slipped.

Nasdaq 100 Index traded down 0.4% a day after tech giants such as Tesla and Amazon.com dragged the underlying index lower on signs of quickening inflation. Tech shares were also the biggest laggards in the Stoxx Europe 600 Index, with semiconductor firm Infineon Technologies AG slumping as much as 5%. In contrast, cyclical shares such as miners and travel stocks helped power the European benchmark as a gauge of commodity prices hovered at the highest level since 2012.”

US 30 futures were positive until 7:15, when they plummeted. There is no explanation yet, but a decline beneath 33800.00 may give a sell signal, leaving a truncated Wave [v].
ZeroHedge reports, “Three months ago, the Treasury surprised markets when in its quarterly borrowing forecast, it revealed that in the first calendar quarter of 2021, it wouldn’t need to borrow as much debt as it had recently because the Treasury’s cash balance (held in the Treasury General Account, or TGA, which is simply the Treasury’s cash balance held at the Fed) would plunge to just $800 billion, down a record $929BN from $1.729 trillion at Dec 31, 2020.

This forecast for a flood of liquidity emanating from the Treasury prompted us (and subsequently others) to predict that as a result of the “mind-boggling liquidity” of just under $1 trillion in cash set to be unleashed by the Biden admin, stocks would soar as the Treasury’s monetary injection would be far bigger than the $120BN in liquidity injected by the Fed every month.
And while stocks indeed surged to new all time highs, the Treasury’s cash flood plan stumbled as the latest, just released Treasury Marketable Borrowing Estimates have revealed.”

VIX futures reached a high of 19.79 this morning, threatening a potential breakout and nearing the 50-day Moving Average at 20.30. This would bear watching today as the indices deteriorate. The Hi-Lo Index is not in retreat, yet. A close beneath 50.00 would suffice to confirm the sell signals.

USD futures rose to a high of 91.39 thus far, testing the 50-day Moving Average at 91.59. USD appears to be poised to go as high as the Broadening Wedge trendline at 96.00 by options expiration. The flow of liquidity into the USD may come from investors selling stocks and bonds, looking for a safe haven.

TNX is hovering above the 50-day Moving Average at 15.89 this morning. It appears to have made a 70% retracement of its bounce out of the Master Cycle low, so little, if any, further decline is expected. The Cycles Model suggests growing strength into mid-May. Two potential targets offer themselves. the first is the November 2019 high at 19.71. Should it exceed that, the weekly Cycle Top at 25.78 is in reserve.