
The Lord’s Prayer
Our Father, who art in heaven, hallowed be thy name. Thy Kingdom come, Thy Will be done, on earth as it is in heaven. Give us this day our daily bread and forgive us our trespasses, as we forgive those who trespass against us. And lead us not into temptation, but deliver us from evil. Amen
7:45 am
Good Morning!
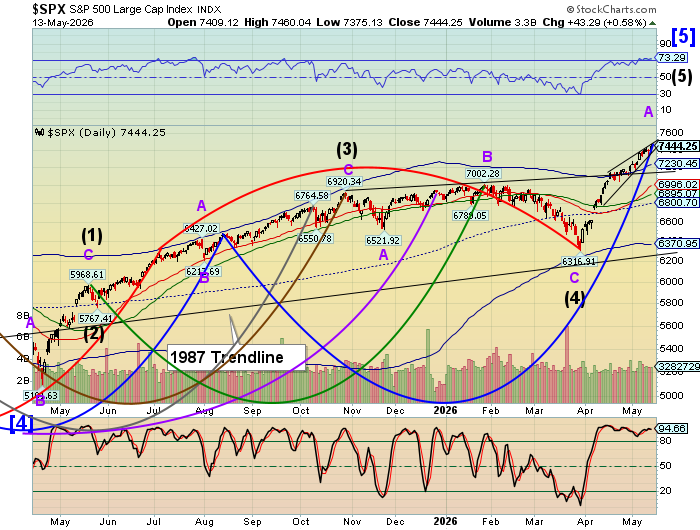
SPX futures rose up to 7472.90, only ticks away from the estimated trendline resistance near 7475.00. Retail dip-buyers are now driving 20% of the trading activity with increased leverage and options. However, the melt-up has narrowed, increasing fragility. While the market appears calm, retail investors are the most incapable of handling a spike in volatility. Tuesday’s volatility spike offered a warning, but did not break beneath the lower Diagonal trendline. The next break may propel the SPX as far as the Cycle Bottom at 6370.95.
Today’s options chain shows Max Pain at 7440.00. Long gamma resides above 7470.00 while short gamma dominates beneath 7400.00.
ZeroHedge reports, “US futures are higher as we await color on the Trump-Xi summit and US- Iran negotiations, which are said to be ongoing, and as the tech meltup continues. What is known so far is that Trump / Xi agree that Iran cannot have a nuclear weapon, Hormuz should reopen without a toll or militarization; the countries will look to increase investment in each other as NVDA H20 chips are approved for a set of Chinese companies.”
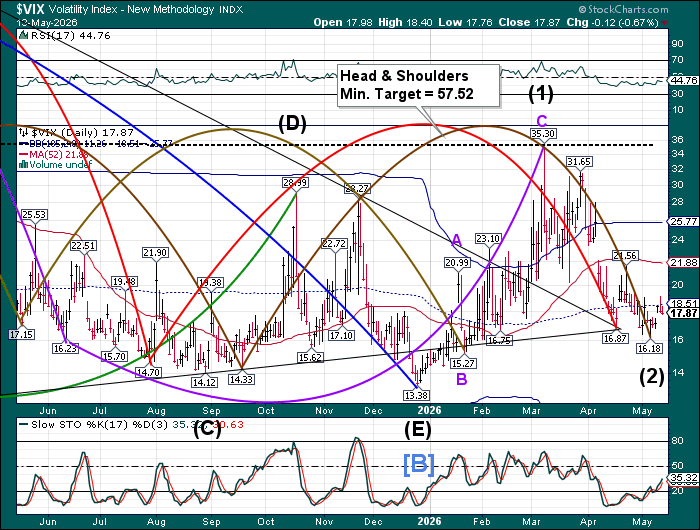
The premarket VIX is consolidating beneath the mid-Cycle resistance at 18.51. The VIX has been released from Wednesday’s expiration, allowing it to rise out of its compressed state. A buy signal has been made above the mid-Cycle resistance and may be confirmed above the 52-day Moving Average at 21.88.
The May 19 options chain show Max pain at 21.00. Short gamma resides beneath 20.00 while long gamma dominates above 23.00 and remains strong to 95.00 with heavy institutional participation.
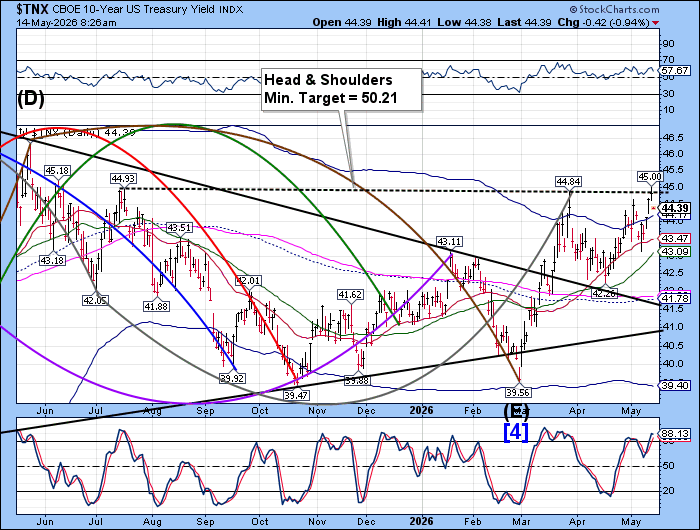
The US 10-year Bond Yield gapped down after challenging the Head & Shoulders neckline at 44.84 yesterday. It closed beneath the neckline yesterday, allowing yet another dive in yields that may reach the mid-Cycle support at 41.78 in the next 2-3 weeks. This is an early warning that all is not well, since investors saw the 4.5% yield as an opportunity for a safe haven that portends a warning of the fragility in equities.
ZeroHedge reports, “Moments ago, the last refunding auction of the week, the sale of $25BN in 30Y paper, made history: it was the first 30Y auction to print with a high yield above 5%, and a coupon of 5%, since August 2007… which as veteran traders will recall was the month of the historic quant crash which marked the S&P highs at the time and eventually culminated in the global financial crisis.
The auction priced at a high yield of 5.046%, up sharply from 4.876% in April, and tailed the 5.041% When Issued by 0.5bps, the second consecutive tail following 4 stop-throughs.”
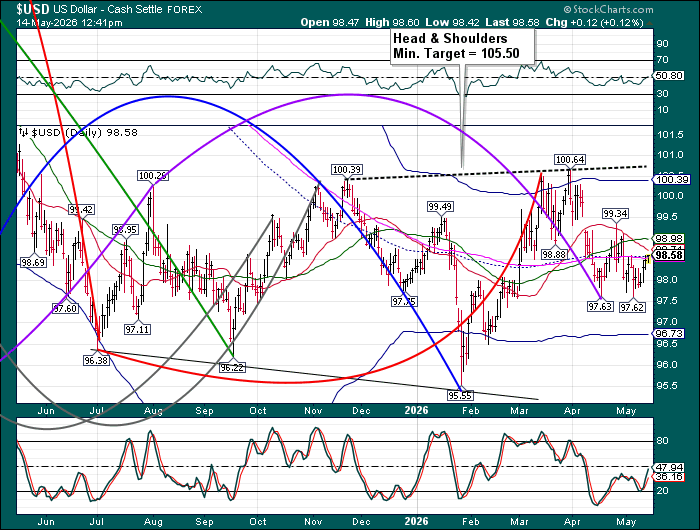
The US dollar rose above mid-Cycle resistance at 98.56 and may offer a buy signal should it close above that support. Dollar shorts may begin to feel the pain above the 52-day Moving Average at 98.98.
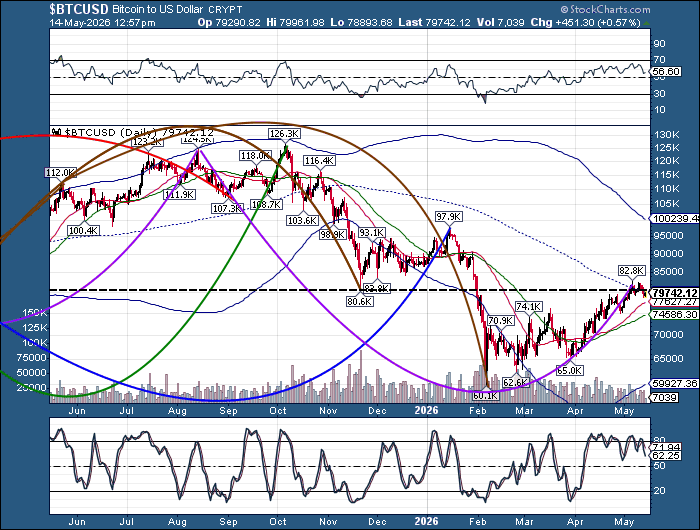
Bitcoin is making new lows as it has been repelled from the trendline at 80600.00 and mid-Cycle resistance at 80083.00. The Cycles Model infers a rather short Master Cycle, possible a week or so. The only available target is the 52-day Moving Average at 74586.30.
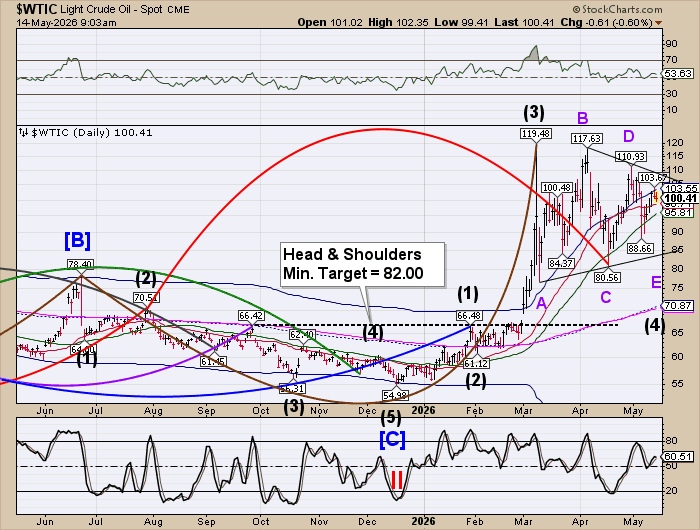
Crude oil has been repelled at the Cycle Top resistance at 103.55, but remains above Intermediate support at 98.71. Should it decline further, it may proceed sharply to the lower trendline of the Triangle formation in the next week or so.
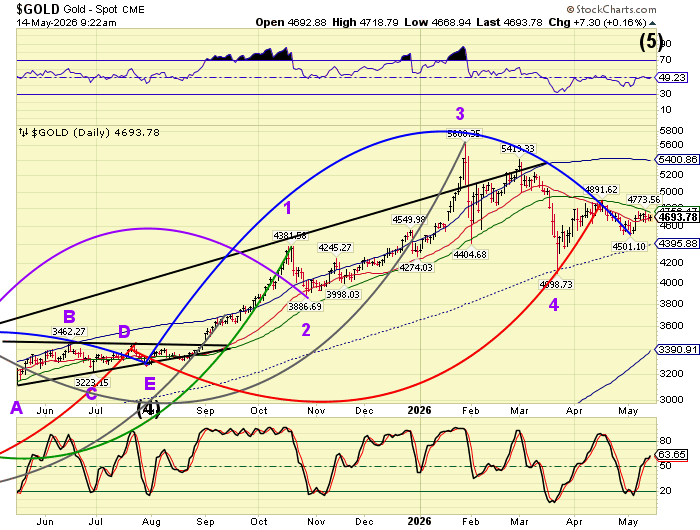
Gold has been repelled by the 52-day Moving Average at 4756.14 and is challenging Intermediate support at 4791.00 this morning. A close beneath Intermediate support implies a further decline to the mid-Cycle support currently at 4395.90. The Cycles Model allows 2-3 weeks of potential decline before resuming its uptrend. The mechanics are simple. Central banks are willing to part with their gold hoard to buy crude oil beneath $100.00.
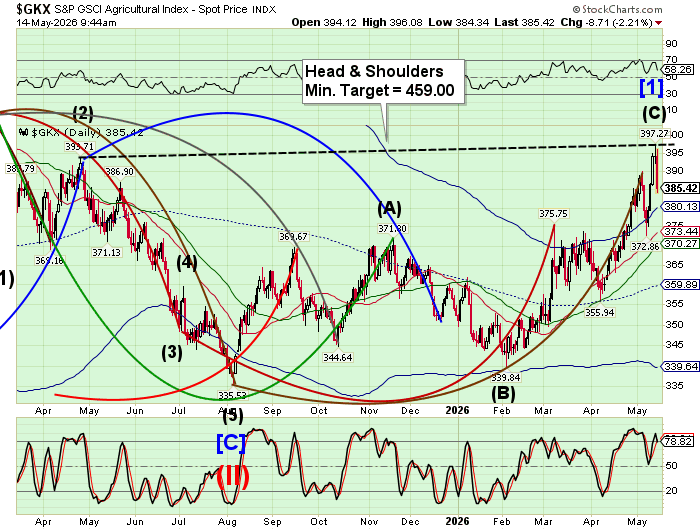
The Ag Index came down dramatically, indicating a probable reversal from the neckline of the Head & Shoulders formation. The Cycle Model suggests a possible three week correction down to the mid-Cycle support at 359.89. There is a close correlation between the price of oil and the price of food. What makes the situation worse is a megadrought plaguing farmers who are not only beset by higher fuel and fertilizer prices, but uncertainty of the water supply.
ZeroHedge observes, “Chicago wheat futures surged on Tuesday, hitting two-year highs after the USDA’s latest WASDE report signaled a much tighter U.S. supply outlook than traders had anticipated.

Production stress across America’s breadbasket is now converging with a megadrought and mounting fertilizer constraints, adding upward pressure on prices at a time when global food prices are rising.”