
The Lord’s Prayer
Our Father, who art in heaven, hallowed be thy name. Thy Kingdom come, Thy Will be done, on earth as it is in heaven. Give us this day our daily bread and forgive us our trespasses, as we forgive those who trespass against us. And lead us not into temptation, but deliver us from evil. Amen
8:00 am
Good Morning!
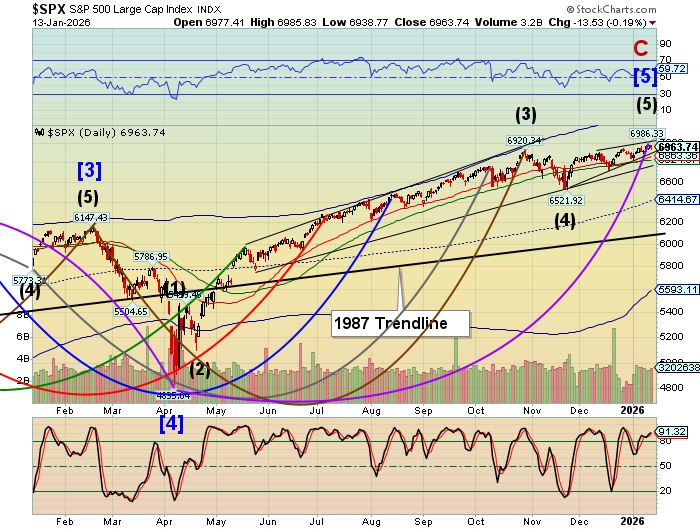
SPX futures declined to 6925.80 in the pre-market, testing the lower trendline of the 2-month long Ending Diagonal formation. An aggressive sell signal may be found beneath that level. Further confirmation may be found beneath Intermediate support at 6869.00 while the 52*day Moving Average may be found at 6824.80. The Cycles Model anticipates a potemtial decline to the week of February 2.
I have received a question about the 25-point surge in the SPX in the final half hour of the day yesterday. Could it be the Fed getting involved? Yes and no. Here are the various factors that increase the intra-day volatility;
- Daily and hourly activity within the Cycles consist of fractals. Motive fractals occur in a 5-Wave form. Corrective fractals occur in a 3-Wave form (a-b-c). C Waves are always 5-Waves of a lesser degree than the motive Waves, appearing very strong, yet failing to overcome the primary motive Wave. What we saw at yesterday’s close was a terminal Wave C.
- Seasonality comes into play in January. Businesses must make their annual bonuses and primary annual pension and profit sharing contribution by January 15. While personal bonuses may not end up in the market, qualified plan contributions generally go into mutual funds. This lends the market to what is called the January Effect.
- This leads us to how mutual funds work. During the day, mutual funds balance out the inflows to the outflows. At 3:30 pm mutual funds settle with the market by selling excess shares or buying shares with excess cash ion the market. Yesterday’s final 30-minute surge could very easily have been a result of a flood of qualified plan contributions being put to work by the mutual funds.
- The next consideration is the options market, which use has grown exponentially. On Tuesday I noted that Max Pain (the least dealer payout) was at 6970.00, whereas the SPX closed at options expiration at 6963.747, at a minimal payout. There is a saying that, “The house always wins.” A commonly held belief is that 90% of all options expire worthless. While that statistic may be contested, selling options can be very profitable for the dealers.
- It has been stated by some individuals that the Fed may be buying the market. While it is common knowledge that the Bank of Japan owns 80% of the ETFs in the Japanese stock market, the Fed does not directly own stocks as a general rule. Instead, it supplies liquidity the banking system through the REPO desk. Since most of the large banks are also dealers, an unknown percentage of REPO may be funneled into the market through dealer banks to promote “market stability.” The current overnight financing rate is 3.65%, making it an attractive source of funds in market turmoil.
11:00 am

SPX has declined through the Ending Diagonal trendline at 6925.00 to offer an aggressive sell signal. This gives investors an opportunity to lighten up on their longs and preserve profits. The next meaningful support lies at 6825.26, where the 52-day Moving Average and previous supports intersect. The 50-day Moving Average is a point of recognition that the bull market is no longer healthy, investors may use it as a sell signal.
11:43 am
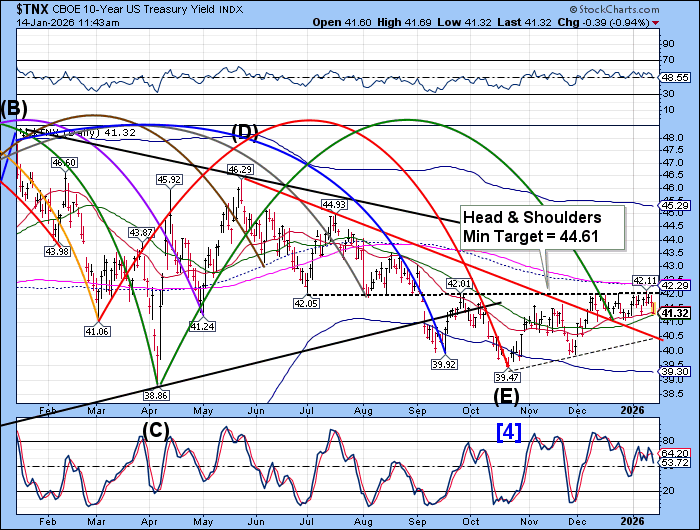
TNX appears to be closing out its Master Cycle at a low. The MC may be complete by the end of the week. It is testing its 52-day Moving Average at 41.25 and indications are that it may go as far as the trendline intersection at 40.50 this week. This may set up a “slingshot effect” where TNX may rally to the Cycle Top at 46.29 in the next 30 days.
Zerohedge reports, “The last coupon auction of the first full week of 2026 was also the strongest one.
Moments ago the Treasury sold $22BN in 30Y paper in a very solid auction: the sale priced at a high yield of 4.825%, just fractionally higher than the 4.773% in December, and also stopped through the When Issued 4.833% by 0.8bps.”

Bitcoin may be completing the final probe of its correction toward the underside of the Head & Shoulders neckline. It may be due for a 3-4 week decline to the target shown on the chart.