
The Lord’s Prayer
Our Father, who art in heaven, hallowed be thy name. Thy Kingdom come, Thy Will be done, on earth as it is in heaven. Give us this day our daily bread and forgive us our trespasses, as we forgive those who trespass against us. And lead us not into temptation, but deliver us from evil. Amen.
9:15 am
Good Morning!
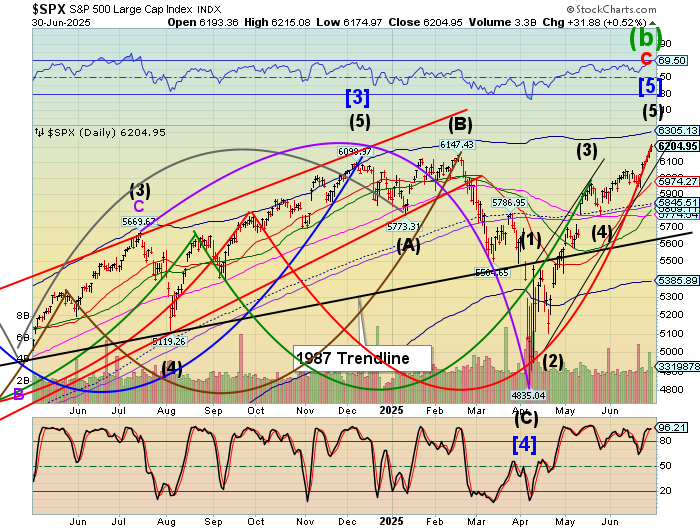
SPX futures rose as high as 6220.00, but settled down to a projected flat open. However, the Cycles Model suggests the decline may begin with strength today. Should that be the case, the 2.5-month trendline lies near 6100.00, giving a clear sell signal beneath it. The reversal has happened roughly two weeks later than the average length of a Master Cycle. That, plus the completion of the fractal beneath 6239.00 gives fair warning that the decline may have begun.
Today’s options chain shows Max Pain at 6190.00. Long gamma may begin above 6200.00 while short gamma gains traction beneath 6175.00.
ZeroHedge reports, “US equity futures are flat, after trading in a narrow overnight range, with small caps outperforming as we see more signs of a Value rotation as H2 kicks off and after yesterday’s dramatic momentum plunge. As of 8:00am ET, S&P futures are fractionally in the red, reversing an earlier 0.3% gain as President Donald Trump’s July 9 tariff deadline gets ever closer — Trump said on Tuesday he won’t delay the date for imposing higher levies on trading partners; Nasdaq futures drop 0.1% with Mag7 names mixed in premarket trading. Futures for the small-cap Russell 2000 rose 0.9% to outperform as Tuesday’s rotation out of high-momentum stocks extended, which helped Cyclicals led by Financials continue to outperform. European equities advanced 0.4%. Bond yields are higher as the curve bear steepens and USD catches a bid which accelerates as US traders walk in. Commodities are rallying across all 3 complexes, with Brent trading back over $68. Yesterday, stocks fell into the bell on Trump comments about not extending the July 9 deadline and possibly not reaching a deal with Japan but recovered their initial losses. Today’s macro data focus is on ADP though it has not been a reliable predictor of NFP.”

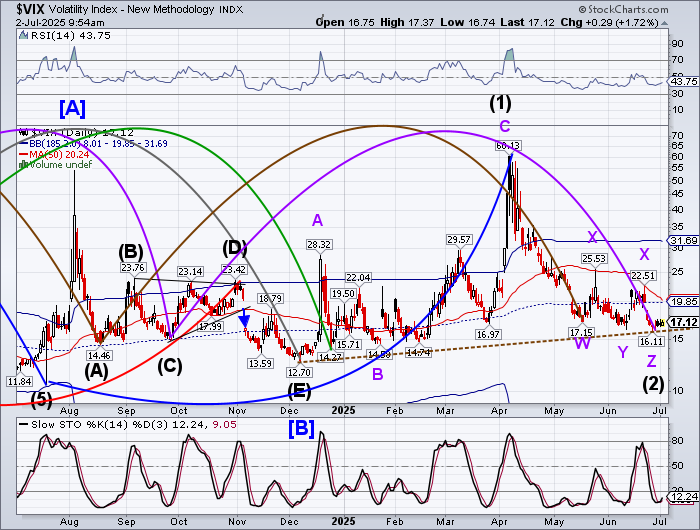
VIX opened higher this morning as it consolidates its gain from the Master Cycle low made last Thursday. Today may be a day of strength, suggesting the VIX may rise toward its mid-Cycle and 50-Day Moving Average at 20.00.
Today we move to the July 9 options chain. Max Pain is at 18.00. Short gamma has virtually disappeared while long gamma may start at 20.00 but fizzles out above 30.00 as investors don’t feel the need to hedge.
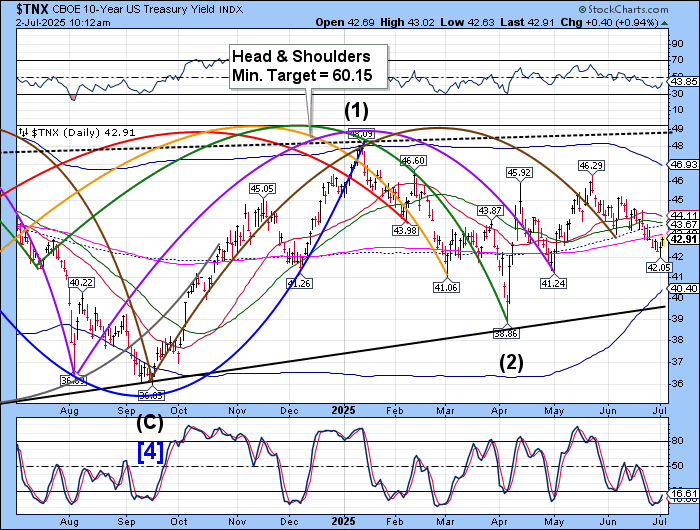
TNX has risen in a probable corrective bounce from its low thus far. Both the Cycles Model and Fractal Model suggest another probe lower, probably on Friday or over the weekend. The Cycles Model actually projects the bottom to occur next Wednesday, just in time for the FOMC to lower rates again. I have made a study of rates and the FOMC reactions. The FOMC reactions have always been after-the-fact since 1949. The Cycles Model anticipates rates to start rising next week.
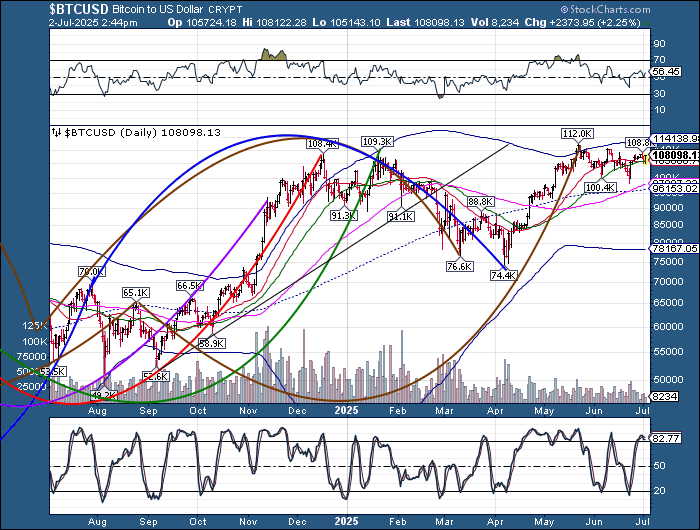
Bitcoin has risen above the 50-day Moving Average at 105100.00 after testing it twice in the past two days. Should it rise above 108750.00, a potential breakout may occur, giving the green light for a new rally to a possible range of 115000.00. Bitcoin is traded internationally 24/7. It has been used as a vehicle for money laundering and moving assets. For example, the Chinese have been using “Bitcoin in 2024 to move assets from the mainland to the US or another safe haven. This year the potential for war in the Ukraine and the Middle East may give rise to persons in Europe and the Middle East using Bitcoin as a means of transferring assets out of their countries before international money transfers are outlawed.
ZeroHedge asks, “Will it?
BTC back to big resistance area again, gaining some momentum lately. Let’s see how this develops from here, but BTC has basically been consolidating for a long time. A close above recent highs, and we risk seeing vacuum to the upside again.”

The USD index continues its decline. While there is a chanced of a reversal here, both the Cycles Model and Fractal analysis indicate a further decline. In fact, the Cycles Model anticipates a decline to early August. The next level of support appears to be 93.50.