8 :15 am

Good Morning!
NDX futures have been consolidating inside Friday’s trading range over the weekend thus far. There appears to be an attempt to hold the trendline at 18100.00 with a backup support at the intermediate level at 18053.00. The Cycles Model shows today as a day of strength. Should NDX remain above its Intermediate support, we may see an attempt to bounce above Friday’s high at 18202.96. However, a reversal beneath Intermediate support may produce a waterfall event.
Today’s options chain shows Maximum Investor Pain at 18100.00. Long gamma may begin immediately above that level, while short gamma emerges beneath 18050.00.
ZeroHedge observes, “Best of times
Buybacks + inflows have stepped up and created a very supportive flow dynamic. It has been the best of times and extreme from a historical standpoint (if you disregard the post-COVID bump).

Source: Deutsche
We are running out of equities
Global equity supply the most negative it has been since 1999. Year to date, global public equity supply has declined by $120 billion. This is three times higher than the $40 billion decline that occurred in 2023. We are also on track for a third straight year of declines for the first time in history.”

SPX futures are consolidating around 5200.00 this morning. The Diagonal trendline provides overhead resistance near 5225.00. In the meantime, Intermediate support comes in at 5143.43, where the sell signal is confirmed. The Cycles Model indicates a show of strength may be at hand. That indicates the trendline (5225.00-5235.00)may be tested again. A breakdown at the trendline may produce a waterfall event.
Today’s op-ex shows Max Pain at 5205.00. Long gamma starts at 5220.00 while short gamma begins abruptly beneath 5200.00.
ZeroHedge reports, “US equity futures are flat, trading around 5,252, having rebounded from session lows even as 10Y yields extend their ascent and the USD strengthens as traders further pare expectations for interest-rate cuts in the face of resilient readings on the US economy. As of 8:00am, S&P and Nasdaq fuitures are both unchnaged while major European markets are mostly higher with only Spain/UK in the red. Treasury yields rose to their highest levels of the year across the curve, with the 10-year climbing above 4.45%. Interest-rate swaps imply around 60 basis points of US monetary easing this year, making two cuts the most likely outcome. On Friday, the chance of a third cut was still above 50%. European bond yields are also higher, but yield curves are not moving in tandem. Commodities are mixed with Energy lower, Metals higher, and Ags mixed. Crude oil turned lower after last week’s strong gains after Israel said it will pull some troops from Gaza. Brent futures briefly dropped below $90-handle before reversing losses. Gold also reversed early losses and printed a fresh record above $2,350 before paring gains. Looking at the calendar, Mon/Tues are light macro days ahead of Wednesday’s CPI print, Thurs’ ECB mtg, and Fri’s Bank earnings which launch Q1 earnings season; we algo get at least 7x Fedspeakers where investors will see if a hawkish pivot is building if CPI prints hotter than expected. While the market is trimming rate hike estimates both Goldman and JPM still see at least 3x rate cuts.”

VIX futures rose to 16.49 as tensions arise. The elevated VIX over the weekend shows that trending strength has been in play and may make a greater showing in the cash market this week.
Wednesday’s op-ex shows Max pain at 15.00. There is a small contingent of short gamma at 14.00. Long gamma starts at 17.00 and builds to 25.00.

TNX futures have risen to 44.67 this morning before moderating a bit. The data feed to Stock Charts does not appear to be working, so I will replace the current chart with a new one as it becomes available. The Cycles Model suggests another two weeks of rising yields, indicating a possible rally to the Cycle Top resistance at 48.28.
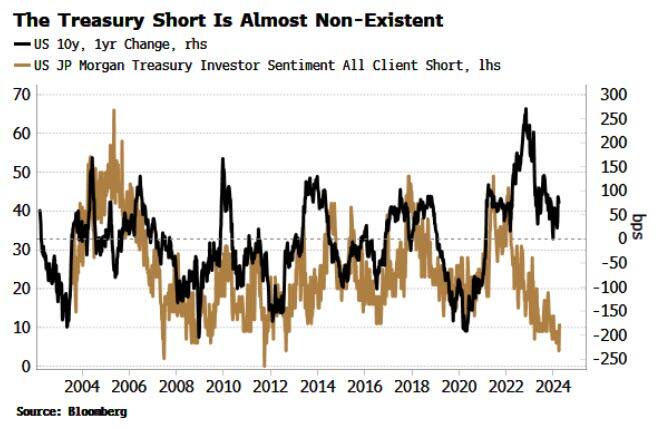
ZeroHedge remarks, “Survey data shows that outright shorts in US Treasuries are near lows. But investors are missing a trick as inflation risks point to higher bond volatility and yields.
JP Morgan’s Treasury Survey tracks their clients’ positioning in Treasuries, asking them whether they are long, neutral or short. The net of the positions is close to flat, but outright shorts are unusually low, with the number of clients saying they are positioned that way near the nadir for the 20-year history of the survey.