The Long View

It’s times like these, when the markets are near all-time highs, that Wall Street loves to trot out the idea that “You Can’t Time the Market.”  In addition, we have seen that bull markets may run for seriously long periods of time while bear markets are rather short in comparison.  But you won’t see articles or books touting “Buy for the long haul.”  at market bottoms.  Sentiment “goes with the flow.”  That is why it takes so much time and study to master the market.  This chart is not attempting to predict anything.  However, if you believe Mark Twain, “History doesn’t repeat, but it rhymes.”  Then you may understand that everything runs in Cycles.


Posted in Published | 13 Comments

Janaury 30, 2026

The Lord’s Prayer

Our Father, who art in heaven, hallowed be thy name.  Thy Kingdom come, Thy Will be done, on earth as it is in heaven.  Give us this day our daily bread and forgive us our trespasses, as we forgive those who trespass against us.  And lead us not into temptation, but deliver us from evil.  Amen

7:30 am

Good Morning!

SPX futures declined to 6890.90 in the overnight session, a retest of the Intermediate support at 6897.17.    You may recall the mention of that same support being taken out by the SPX yesterday before its bounce back to Max Pain at the close.  In my options discussion, yesterday, I mentioned that the dealers would be highly motivated to claw back their losses before the close, above 6930.00.  In fact, the took the SPX back to 6969.01, within 6 points of Max Pain (the smallest dealer payout) at 6975.00.  Studies show that over 90% of all options either expire worthless or are sold at a loss.  Yesterday’s action possibly shows the machinations of Wall Street to make that happen.  After careful study of yesterday’s action, I have concluded that my closing comments may have been understated.  Today’s target may be the support levels constituted by  the 52-day Moving Average at 6847.84 and straight line support at 6825.00.  An afternoon bounce may ensue, setting up a possible panic decline on Monday.

Today’s options chain shows Max Pain has been lowered to 6930.00.  Long gamma rises above 6950.00 while short gamma begins beneath 6920.00.  Dealers are expecting a loss, but may be underestimating the amount.

ZeroHedge reports, “US futures slumped, the dollar rallied sharply, the Treasury curve steepened with 10Y yield rising as high as 4.28% and gold and bitcoin tumbled on what was at first speculation and then confirmation, that President Trump is nominating Kevin Warsh – widely viewed as the most hawkish of the handful of candidates – as the next Fed chair.”


The premarket VIX rose to 19.27 this morning before pulling back to 17.71 thus far.  It regained the ground above above the 52-day Moving Average at 16.90.  The Cycles Model suggests wild swings may occur in the VIX until a breakout above the Cycle Top and trendline at 21.93 occurs.

The February 4 options chain shows short gamma between 14.50 and 16.00.  Long gamma becomes firmly established above 17.00.  Calls are heavily concentrated between 17.00 and 22.00.  However, there are growing commitments as high as 60.00.


The 10-year US Treasury yield has moved above the mid-Cycle support at 42.26 this morning.  The Cycles Model suggests a burst of trending energy today followed by a continued rally to the week of February 16. The Head & Shoulders  formation  targets a minimum target at 44.61, while the Cycle Top at 45.23 remains the possible ending price for the current Master Cycle.  Meanwhile, hedge funds exposure to Treasuries has been rising over the last two weeks.

ZeroHedge reports, “After a solid 2Y, and a dismal 5Y auction, moments ago the Treasury completed the sale of the week’s final coupon, and today’s sale of $44BN in 7Y paper was appropriately enough, mediocre at best, not terrible, not great, in the parlance of our times.”


USD has reversed out of its Master Cycle low on January 27 and is building up strength for a breakout above the Cycle Bottom resistance at 96.75.  The Cycles Model suggests the breakout may occur over the weekend.  Rising above the Cycle Bottom offers an early buy signal.  Most traders won’t recognize the change in trend until it surpasses the 52-day resistance at 98.50 or a breakout above its last high at 99.49.  The Cycles Model calls for a rising USD until the week of March 16.  A breakout above the November 21 high may spark a huge short-covering rally, possibly starting in mid-February.


Bitcoin may be testing its November low at 80562.00 this morning.  The Cycles Model suggests a week may be left to complete its decline  to (or possibly beneath) the Head & Shoulders target.  However, the following week also appears to be chaotic.


Silver broke beneath 100.00, making a low at 95.20 this morning.  Its wide-ranging move yesterday spoke of rising volatility and thinning liquidity.  The Cycles Model suggests  a possible 2-month unwind that may go to the mid-Cycle support, currently at 49.33.

Zerohedge remarks, “Always

Parabolic moves don’t fade, they always break. We warned in Silvergeddon earlier this week that silver was morphing into a GameStop-style momentum squeeze, built on leverage and late chasing. That setup is now unraveling, with the ongoing crash inflicting huge P/L pain.”


Gold is in full retreat after making a high at 5595.61 (futures show 5645.60 due to backwardation)  yesterday, with a possible bounce  at the trendline near 5000.00.  A sell signal awaits the decline beneath 5000.00.


Posted in Published | Comments Off on Janaury 30, 2026

January 29, 2026

The Lord’s Prayer

Our Father, who art in heaven, hallowed be thy name.  Thy Kingdom come, Thy Will be done, on earth as it is in heaven.  Give us this day our daily bread and forgive us our trespasses, as we forgive those who trespass against us.  And lead us not into temptation, but deliver us from evil.  Amen

3:20 pm

SPX may have completed its second bounce. The  bounce may have been motivated by dealers attempting to get the SPX out of short gamma beneath 6930.00.  It may be followed by a decline to the 52-day Moving average and trendline in a support zone between 6825.00 and 6852.00.   Since there may be $40-$5 billion of possible CTA redemptions beneath that level, there may be another bounce back above 6930.00 over the weekend to avert a crisis.  The deferred panic may arrive next week as volatility ramps higher.


10:32 am

SPX is approaching Intermediate support 6895.00.  A decline beneath it produces a possible sell signal.  This is starting to look serious.

ZeroHedge comments, “…aaaand it’s gone!”


8:15 am

Good Morning!

SPX futures rose to 7002.00 this morning, beneath the futures high at 7014.80 made yesterday.  The Cycles Model may allow a marginal new high today.   There is a trading band resistance at 7017.19, giving a possible limitation above 7000.00, round number resistance.  There appears to be a psychological magnet at round numbers that attract, but also repel, once accomplished, so SPX may be at an important turning point.

Today’s options chain shows Max Pain at 6975.00.  Long gamma may emerge above 6990.00 with call strength above 7030.00.  Short gamma rises beneath 6930.00 and strengthens beneath 6900.00.

ZeroHedge reports, “Futures are higher, led by tech, after the first batch of Mag7 earnings with gold breaking new record highs again, rising as high as $5600. As of 8:00am ET, S&P futures are up 0.2% while the Nasdaq if barely in the green…”


The premarket VIX is consolidating just beneath the 52-day Moving Average at 46.91 this morning.  The VIX tends to give advance notice of possible trend changes in the SPX.  A cross above the 52-day Moving Average in the VIX may precede a possible decline beneath the 52-day Moving Average in the SPX by just a few days.    The Cycles Model suggests the VIX may begin to rise in earnest today.

The February 4 options chain show Max Pain at 16.00.  Short gamma shows up in 14.50 to 15.00.  while long gamma rises above 17.00 with some conviction up to 30.00.  Thee appears to be very little fear.


TNX appears to be resting in place, but that may soon change, as the week may end in yet another surge of trending strength.  $200 billion of short term treasury bills are scheduled for auction today, along with $44 billion of 7-year notes.  The rally may extend for three more weeks with a potential target at the Cycle Top resistance at 45.24.


USD is consolidating above its Master Cycle low , but beneath the Cycle Bottom resistance at 96.25, above which a buy signal may be made.  A burst of energy may propel the USD above resistance this weekend, sending it on a rally that may last to mid-March.  USD shorts may panic as it rises above the multiple resistance at 98.52.


The Japanese Yen is consolidating today, with a potential resumption of its rise from its Master Cycle low.   The Cycles Model indicates another week of possible rally prior to a correction back down to the trendline. at 64.75.  Japan’s snap election on February 8 may change the trajectory of the Yen temporarily in a possible double directional change in February.   In the meantime, the BOJ decided not to raise interest rates again from .75% to 1.00% for the time being.


Bitcoin has reversed away from its Intermediate resistance at 90705.00 as it resumes its decline toward the Head & Shoulders target.  While the current Master Cycle may only have a week left in its proposed tour, panic may set in to drive BTC down toward its target.  Should the decline last more than a week, a double panic decline may  ensue the following week.  Keep alert.


Silver futures rose to 121.75 this morning, in a super-extended Cycle.  While this Maser Cycle is beyond its normal boundaries, the Cycles Model shows a potential pivot due tomorrow.  When it occurs, the Cycles Model anticipates a correction lasting to early April.  There are powers that may be interested in driving the price of silver down by 50%.  The Cycles may accommodate them.


Posted in Published | Comments Off on January 29, 2026

January 28, 2026

The Lord’s Prayer

Our Father, who art in heaven, hallowed be thy name.  Thy Kingdom come, Thy Will be done, on earth as it is in heaven.  Give us this day our daily bread and forgive us our trespasses, as we forgive those who trespass against us.  And lead us not into temptation, but deliver us from evil.  Amen

8:45 am

Good Morning!

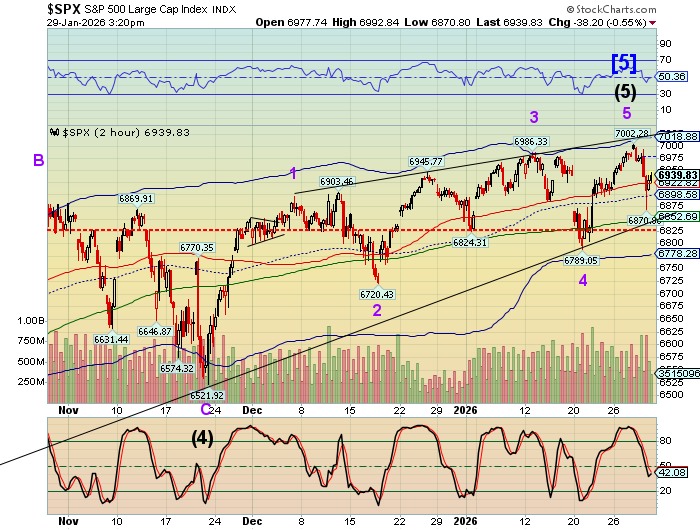
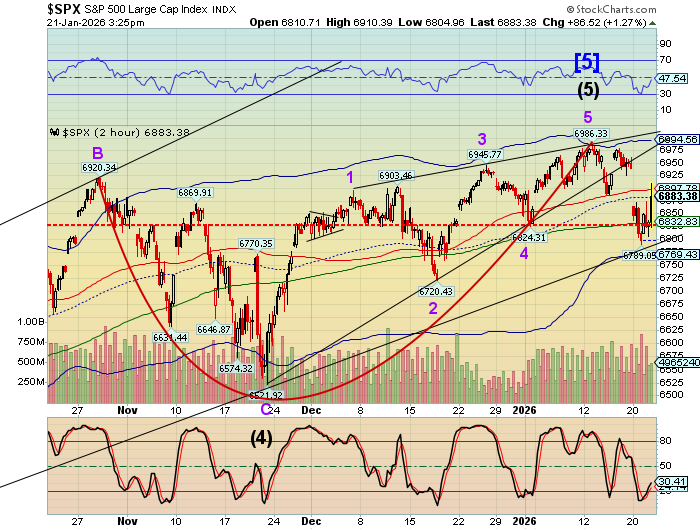
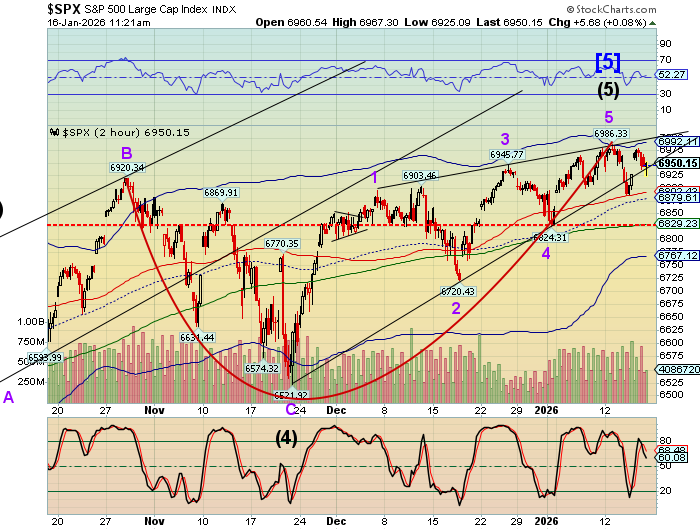
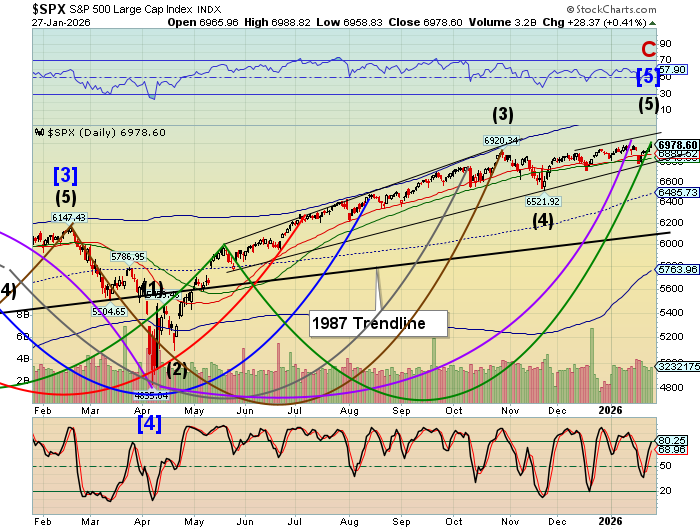
SPX futures probed Cyclical resistance at 7010.00 this morning, rising to a high at 7014.80.  Whether it rises above 7000.00 in the regular session remains to be seen.  There is a fractal limitation for this rally near 7050.00, but that does not seem to be a target today.  Trump celebrated the SPX topping 7000.00 this morning, but a gamma wall lurks above 7030.00.  The probability of a Key Reversal is high in the next few days.

Everyone is max long, with leverage, expecting the Mag 7 to post blow-out earnings.  NDX futures have reached  26225.00 this morning, exceeding the October 29 high at 26182.00.

Today’s options chain shows Max Pain at 6855.00.  Long gamma prevails above 7000.00 while short gamma dominates beneath 6925.00.

ZeroHedge reports, “US equity futures are rallying into record territory, led by Tech as overnight earnings (ASML, SK Hynix, STX, TXN) boost the group and help fuel the AI trade, perhaps pausing the broadening theme. As of 8:00am ET S&P futures are up 0.2% pointing to a sixth-straight advance that would mark the longest winning run in almost seven months and will push the S&P 500 cash index above the 7,000 mark for the first time when US markets open…”


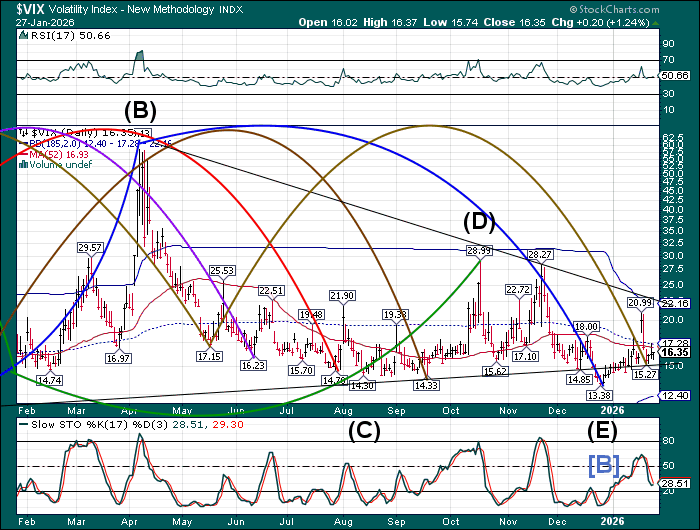
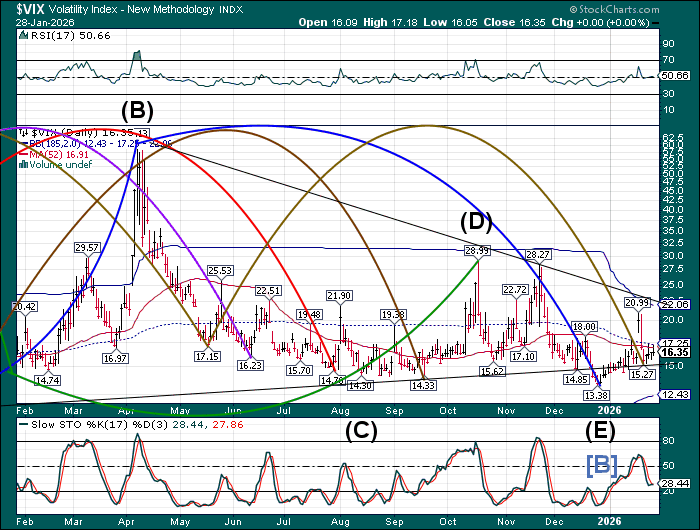
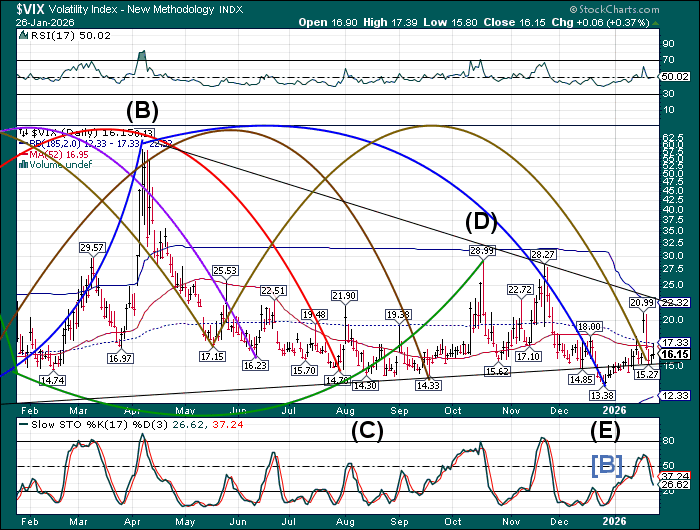
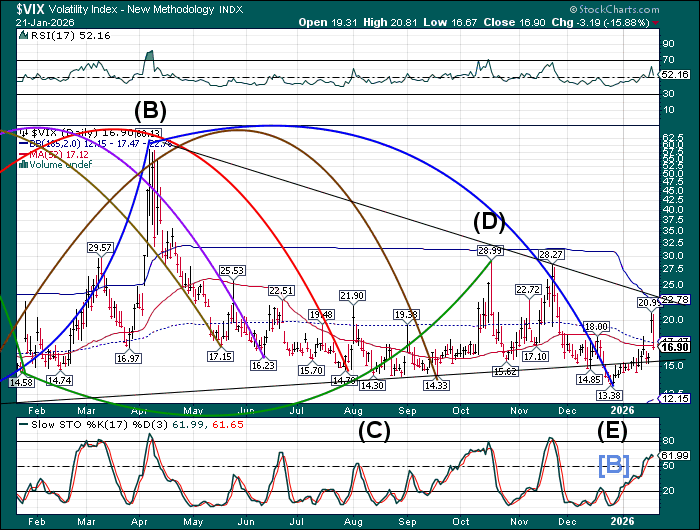
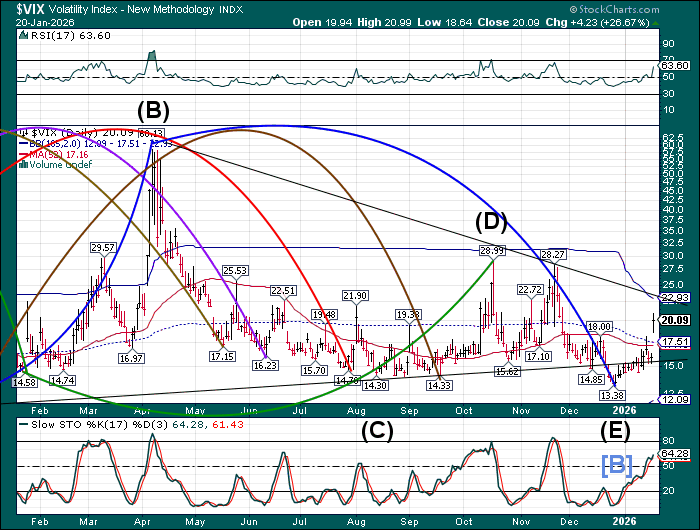
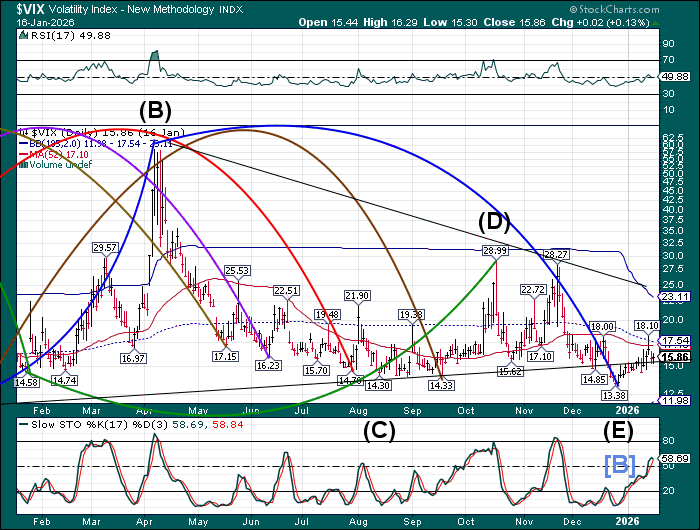
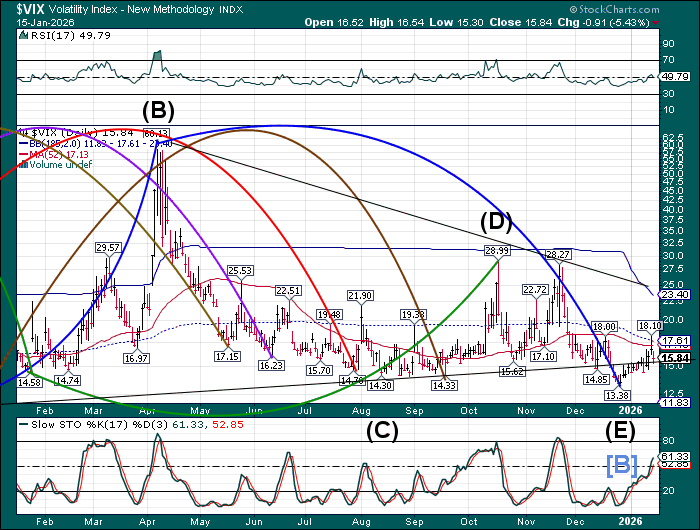
The premarket VIX rose to 16.52 this morning, remaining beneath the 52-day Moving Average at 16.93.  The VIX may be poised to rally significantly starting this week, according to the Cycles Model.  The December 24 low at 13.38 marks the beginning of the next phase of the uptrend established from a low of 10.62 in July 2024.

The February 4 options chain shows Max Pain at 16.00.  Short gamma is waning, while long gamma is concentrated above 17.00, with a long call wall at 60.00.


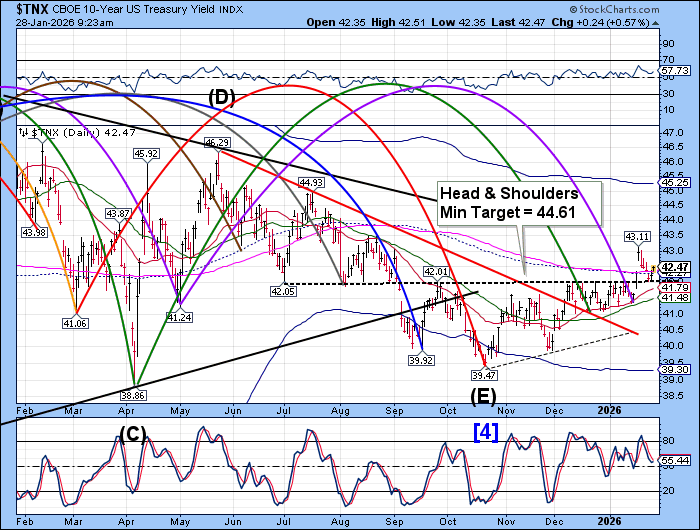
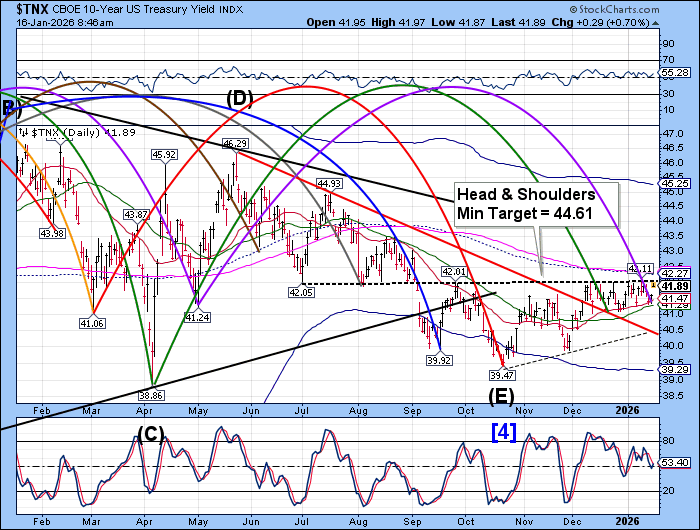
The US 10-year bond yield futures rose to 42.53 this morning, above the 200-day Moving Average at 42.34.  This reiterates the buy signal.  Trending strength picks up by the weekend while the Cycles Model indicates a rising yield to the week of February 16.  The nearby target may be the Cycle Top resistance at 45.25.  However, it may rise considerably more, once above that resistance.

ZeroHedge reports, “If yesterday’s 2Y auction was stellar, today’s 5Y sale was the opposite.

Just after 1pm, the US completed the sale of $70BN in 5Y paper at a high yield of 3.823%, up from 3.747% one month ago and the highest since July. It also tailed the When Issued 3.820% by 0.3bps, the 7th tail in the last 8 auctions.”


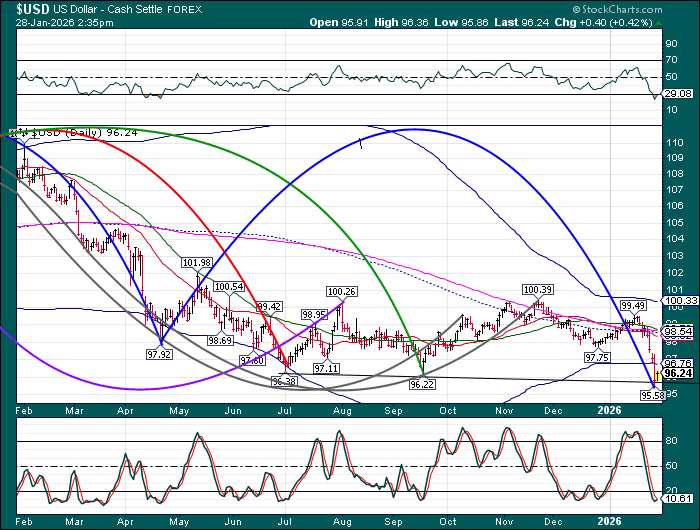
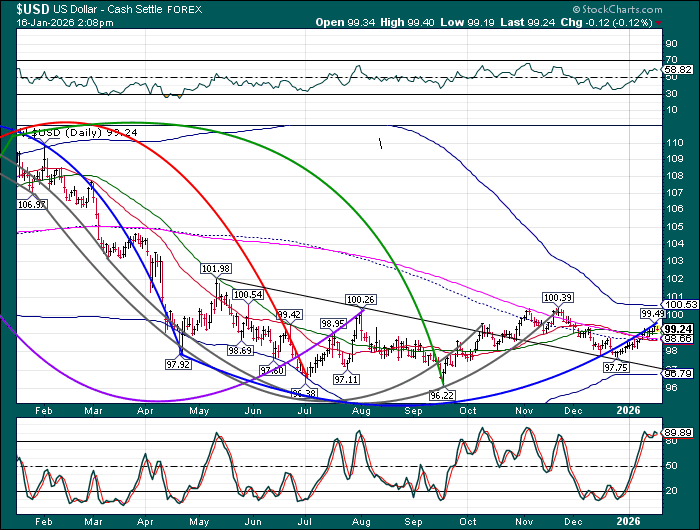
The USD index made a rebound from its Master Cycle low this morning, rising above the trendline at 95.80.  This may be considered an aggressive buy signal, with confirmation above the lower trading band at 96.75.  The expectation of dollar weakness may persist until it rises above its multiple resistance cluster around 98.54.  Trump’s comments imply a tacit endorsement of a weaker USD.  The primary reason may be that a weaker USD strengthens our  balance of trade.  However, that may not last as the Euro simultaneously made its Master Cycle high.


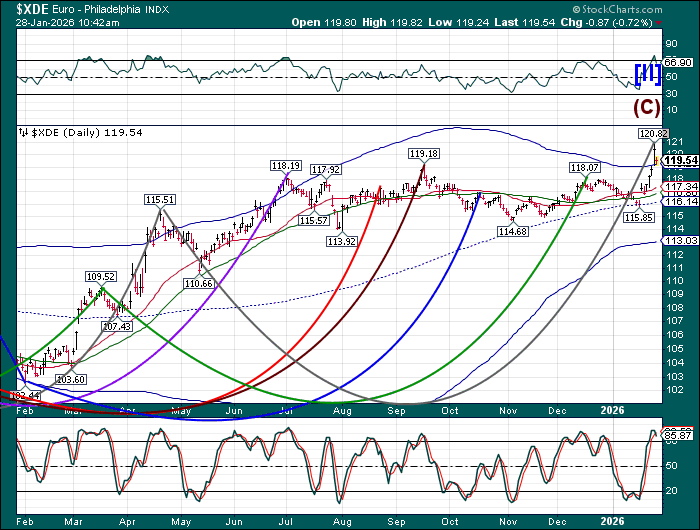
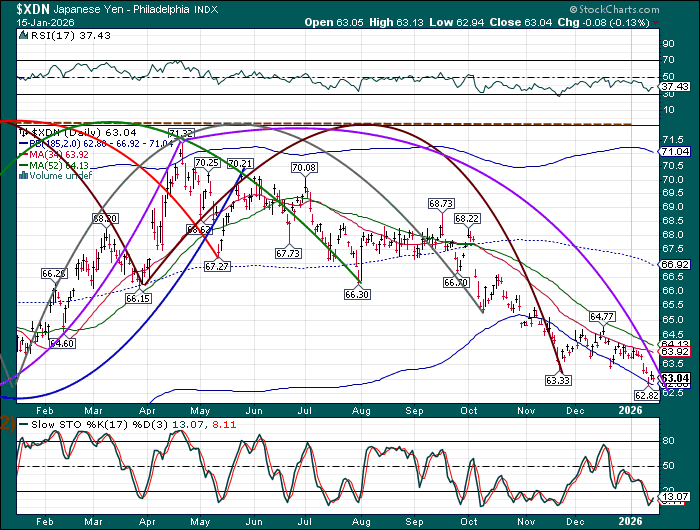
The Euro Index made its Master Cycle high yesterday, ending a year-long rally.  It has been trending inversely to the USD during that time.  The strength of the Euro belies the economic rot underneath.  The politicians have run out of options, other than to blame the US for its woes.  Many European companies have migrated to the US due to its economic advantages over the European economy.  The Cycles Model indicates the plunge in the Euro starts today and strengthens over the weekend.


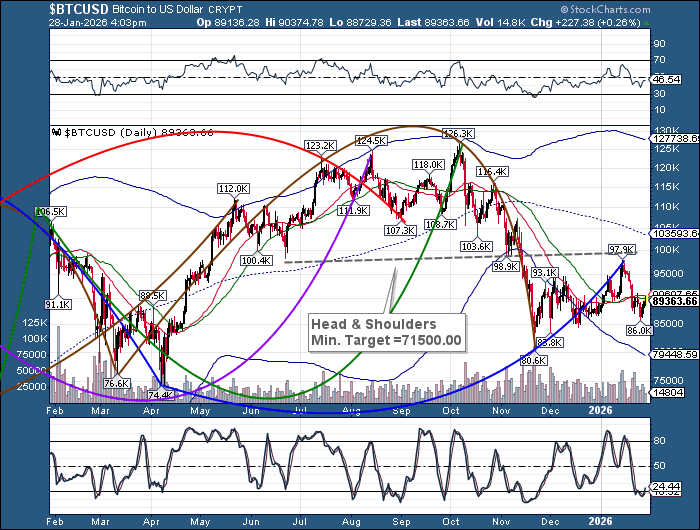
Bitcoin tested its 52-day Moving Average this morning at 90042.00 before pulling back.  The Cycles Model suggests there may still be some life in the retracement.  A possible extension to 92000.00 may be in order over the next few days.


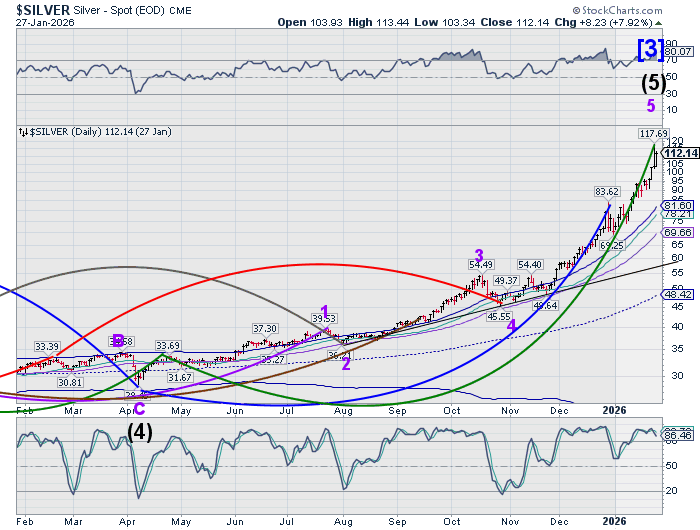
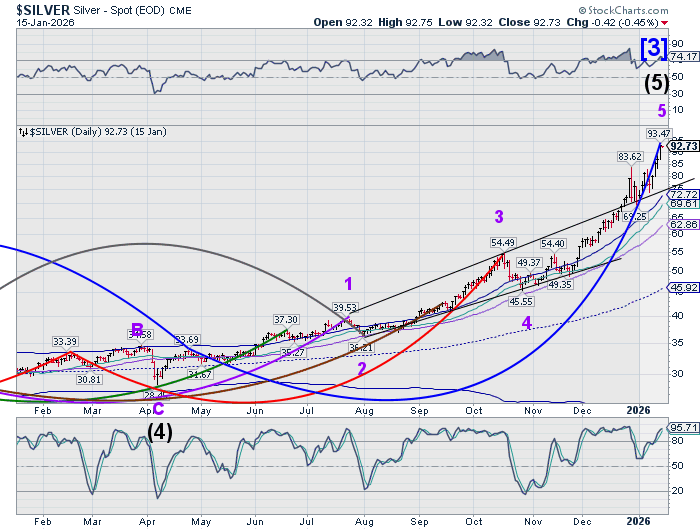
Silver futures rose to 116.11 this morning, short of its al-time high at 117.69.  Traders remain convinced that silver may go higher, predicting a “failure to deliver” in March. However, the Cycles Model anticipates a substantial decline through early April.  Things may not work out as the experts all agree.

ZeroHedge observes, “The rally in precious metals continues unabated. And, in particular, silver’s implied volatility has exploded since the beginning of November and is currently trading at 77.1%, a full 46 percentage points higher. Are we in a silver bubble? Brett looks at four critical factors, using options data from OptionMetrics and other data sources, that may hold the answer.”


Posted in Published | Comments Off on January 28, 2026

January 27, 2026

The Lord’s Prayer

Our Father, who art in heaven, hallowed be thy name.  Thy Kingdom come, Thy Will be done, on earth as it is in heaven.  Give us this day our daily bread and forgive us our trespasses, as we forgive those who trespass against us.  And lead us not into temptation, but deliver us from evil.  Amen

7:45 am

Good Morning!

SPX futures rose to 6977.70 this morning, before backing down.  There is an even chance of rising to a new ATH, but with limitations, due to the rather flat trading channel.  The Current Cycle Top resistance is at 7003.00 with the possibility of a breakout high toward 7024.00.  The current Master Cycle may end this week, so the prospects for an  imminent reversal are rising.  Whether the rebound rises above 6986.33 or not, this final move may be considered a fifth (and final)Wave.  While the NDX futures are up to a high of 25916.00 this morning, the DJIA futures are down 270.00 points this morning.  Neither appear in a  position to make a new ATH at this time.

Today’s options chain shows Max Pain at 6955.00.  Long gamma rules above 6980.00 while short gamma dominates beneath 6950.00.  A call wall is in place at 7030.00.

ZeroHedge reports, “US futures are higher, led by Tech, and approaching record levels from earlier this month as geopolitical and headline risk subsides while the market focuses on looming Mag 7 earnings and Wednesday’s Fed decision is expected to be a non-event. Equities are poised for another attempt at 7k.”


The premarket VIX is consolidating above 15.98 as it rises from its Master Cycle low made on January 22.  Net short positions in the VIX are the highest in a decade among asset managers.  Conditions are such that, should VIX rise above its 52-day Moving Average at 16.95, short covering may add fuel to a rally later this week and into next.

Tomorrow’s VIX options expiration shows Max Pain at 17.00.  Massive short gamma positions reside from 15.00 to 16.00.  Long gamma strengthens above 18.00 and rises to 40.00.


TNX rose above mid-Cycle support at 42.28 this morning, confirming the buy signal made by the breakout above the neckline of the Head & Shoulders formation at 42.05.  A resumption of trending strength may reappear by the end of the week.  The Cycles Model suggests the uptrend may continue to the week of February 16.  A likely target may be the Cycle Top at 45.25 by then.  The upcoming auction of $70 billion of 5-year Treasury notes is scheduled for today in a light auction week.

ZeroHedge reports, “The first coupon auction of the week just took place, and it could not have gone any better.

According to the US Treasury, $69BN of 2 Year paper was just sold at a high yield of 3.580%, up from the 3.499% in December, and stopped through the When Issued 3.594% by 1.4bps, the biggest stop through since August.”


USD made a new extended Master Cycle low at 96.40 this morning.  It is testing a massive trendline that existed since 2011, currently just above 96.00.  Despite the naysayers, the USD is merely making an intermediate low in a series of lows rising from 70.70 made in 2008.  Dollar shorts have ruled the roost since January 2025 and now are in need of a change in direction.  The Cycles Model anticipates a surge out of the low by this weekend.


The Japanese Yen continues its rally from its Master Cycle low made on January 13.  The Cycles Model suggests up to two more weeks of rally off the low.  It suggests that the month of February may be a very busy month.


Bitcoin is easing back from its retracement high at 88015.00 this morning.  It may continue by retesting the 52-day Moving Average at 90035.00 over the next few days, completing a Master Cycle high.


Silver futures rose to 113.44 in the overnight session, but is trading at a premium to the cash market.  It appears that the high of 117.39 was made yesterday.  It is uncertain on how it may show up in the cash market today, which doesn’t get reported until the end of the day.  However, it appears that a high may have been established.


Posted in Published | Comments Off on January 27, 2026

January 26, 2026

The Lord’s Prayer

Our Father, who art in heaven, hallowed be thy name.  Thy Kingdom come, Thy Will be done, on earth as it is in heaven.  Give us this day our daily bread and forgive us our trespasses, as we forgive those who trespass against us.  And lead us not into temptation, but deliver us from evil.  Amen

8:00 am

Good Morning!

SPX futures declined to 6850.90, edging toward the 52-day Moving Average at 6835.98 and a trendline support level at 6825.00.  SPX has been bouncing back and forth around the 6825.00 trendline since early December, essentially going nowhere.  More importantly, the Ending Diagonal  trendline has risen to 6815.00-6820.00. The Cycles Model recognizes the January 12 high at 6986.33 as, not only the all-time high, but the end of a Major 25.8-year Cycle, dating from the March 23, 2000 high.  This information tells us that, despite the upward slant of the price movement thus far, a breakdown may be imminent.  It has been a good run, but time to take profits.

Today’s options chain shows Max Pain at 6830.00.  Long gamma doesn’t begin until 6950.00, while short gamma becomes strong beneath 6925.00.  Little wonder the price action this morning brought the futures back to 6920.00.

ZeroHedge reports, “US equity futures are weaker but have retraced much of their overnight lows as geopolitics and USD/JPY roil markets ahead of a significant earnings week, as Mag7 earnings reports kick off this week.”


Pre-market VIX rose rom its trendline to 17.39 over the weekend, rising above the 52-day Moving Average at 17.01 and giving a buy signal.  Although the VIX has since declined back beneath 17.00 this morning, we look for the rally to resume above that level.  Asset managers have the highest net short position in VIX in a decade while hedge funds have their highest net short position in the past 2 years.  While the Master Cycle projects being completed by the end of the week, the possibility of a 1-week extension is rising.  A spike rally may bring about massive short covering.  A possible target at 60.00 persists.

The Cycles Model shows Max Pain at 17.00.  While there is a significant overhang of short gamma at 15.00-16.00, long gamma begins strongly above 18.00 and is well populated up to 40.00.


US 10-year Bond Yield futures dropped to 41.98 over the weekend, but the cash market shows a low of 42.13, above the Head & Shoulders neckline at 42.05.   The retracement may be complete, allowing yields to regain their upward mission.  The way is clear above the mid-Cycle at 42.28 with the 200-day Moving Average at 42.35.  The Cycles Model suggests a burst of energy may propel the TNX higher today, with the uptrend resuming through the end of the month.

ZeroHedge observes, “I think coordination and cooperation between the Fed, Treasury, and the admin is good. It doesn’t defeat “independence” and has happened in the past – typically, in times of stress, with COVID being the most recent example. I continue to believe the announcement that the Fed would buy fixed income ETFs changed the trajectory of the corporate bond market overnight.”


USD futures made a weekend low of 96.95 while the cash market opened with a low at 97.00 this morning.  Either way, the Master Cycle may have completed its downside mission this morning.  The Cycles Model calls for a new Master Cycle that may last until mid-March.  The dollar haters (mostly European)may not like the rising USD and the Model suggests that, once the USD crosses back above 100.00,possibly tis weekend, short covering may be akin to adding gasoline to the flames.


The Japanese Yen gapped higher over the weekend, breaking out above a critical support/resistance area at 64.75.  This breakout may put a serious crimp on global liquidity, as many banks and hedge funds are leveraged through the Yen carry trade.  This move has added 3.5% to the loan principal that must be repaid  over the past two weeks.


Bitcoin is bouncing from a new 2026 low at 86008.00 this morning.    The Cycles Model allows another two weeks or so of decline, so the Head & Shoulders target is still in play.  The most likely path may be a further decline with the Cycle Bottom being the next possible target, despite the oversold condition.  The first week of February shows bitcoin may be vulnerable to a panic sell-off.


Silver futures are making a new high at 113.620 thus far.  The new highs are stretching the Master Cycle, heightening the risk of an impending sell-off.  The main driver of this rally is China, one of the largest producers of silver, putting export controls as of January 1, 2026 on silver, along with rare earth materials.  Reduced supply is coupled with increased demand, creating what seems to be a never-ending rally.  In addition, perpetual deficits are heightening awareness that the endgame is imminent for multiple governments, enhancing demand for precious metals.  Capital controls may put a temporary chokepoint on the rally in silver and gold.  Silver, especially has industrial and defense uses, moving the US to create a strategic silver reserve.  Confiscation may not be far away.


Posted in Published | Comments Off on January 26, 2026

January 23, 2026

The Lord’s Prayer

Our Father, who art in heaven, hallowed be thy name.  Thy Kingdom come, Thy Will be done, on earth as it is in heaven.  Give us this day our daily bread and forgive us our trespasses, as we forgive those who trespass against us.  And lead us not into temptation, but deliver us from evil.  Amen

3:40 pm

Note my earlier comments on the USD.  This move has expanded the correction and the Master Cycle.  It may be over, or nearly so.  This makes more sense from the Cycles perspective.  This morning I noticed something odd about the USD Cycle.  This afternoon explains it all.

3:05 pm

The Japanese Yen has suddenly forged higher, above the 52-day Moving Average at 63.92.  It may be on a buy signal.  This may alter the liquidity picture worldwide, as the Yen carry trade may be threatened.  The Fed has called for a rate check, which may be a warning that a large move such as this may be problematic at many levels.  The Cycles Model suggests this move may last 2-3 weeks.


2:05 pm

BKX has declined beneath its Intermediate support at 166.05.  This confirms the sell signal.  Note the chart above.  The demise of the Yen carry trade may put a big dent in bank earnings.


7:45 am

Good Morning!

SPX futures declined to 6893.40 thus far this morning, falling beneath Short-term support at 6903.00.  Retail investors dropped $12.9 billion into stocks on Tuesday alone, bringing up the Y-T-D total to $45 billion.  Commentators credit that surge to Trump’s “backing down” (TACO) on tariffs.  The real cause of this surge may be more complex, as pension and profit sharing plans were required to make their annual contributions by January 15, most of which went to index mutual funds.  That money may have finally been “put to work” on Tuesday. The mutual fund managers simply took advantage of the dip. The press took the easy way out, citing a possible coincidence, not the real probable causation.  It made a good headline.  The Cycles Model offers short-term support at 6905.00.  Intemediate support lies at 6883.00.  Prepare for an active day where a decline beneath 6900 may bring a surge of selling.

Today’s options chain shows Max Pain at 6910.00.  Long gamma may begin above 6925.00 while short gamma strengthens beneath 6900.00.

ZeroHedge reports, “US stock futures are lower with tech stocks lagging as Intel plunged 14% after the chipmaker warned it was struggling with manufacturing problems leading to poor Q1 guidance.”


The premarket VIX rose to 16.21 this morning.  Despite the pullback, VIX is on a buy signal.  Confirmation comes above the 52-day Moving Average at 17.07.  The Cycles Model shows another week of rally in the current Master Cycle.  However, that may extend into the first week of February.  A very strong Wave 3 is due to arrive imminently.

The January 28 options chain shows a heavy concentration of puts (short gamma) beneath 17.00.  Long gamma starts at 18.00, but not heavily entrenched as of this morning.


TNX may have bounced off the mid-Cycle support at 42.28, or the 200-day Moving Average at 42.35 this morning. Commentators consider the price action in TNX  to be mean-reverting.   However, the Cycles Model suggests the 10-year yield is due to a double boost of strength due this weekend that may propel it toward the Cycle Top resistance at 45.25.


This morning I woke up to the outside temperature at 0 degrees with a wind chill of -17 degrees.  The weekend temperatures are expected to be downright brutal in the Midwest with an expected low tonight in my location of -15 degrees.    Wind chill may be considerably worse.

Spot prices for natural gas shot up nearly 34% in the past month as   consumers in many states may pay considerably more, as preparation for a massive storm event was sorely lacking.

ZeroHedge observes, “US natural gas futures surged as much as 75% over the past week, well above $5/mmBtu, driven by sharply colder weather forecasts (comparable to the 2021 Uri storm that paralyzed Texas’ power grid), ongoing production freeze-offs, and a vicious market trap for bears that unleashed epic short covering.”


USD futures may be i their final corrective phase today.  The Cycles Model suggests a strong surge of trending strength may be imminent.  The Cycles Model shows something odd…The next four weekends show powerful surges, with the current Master Cycle continuing to mid-March.  The inference may be that news events affecting the market may be postponed to the weekends to stifle a negative market reaction.  In the meantime, we may expect one of the longest and strongest trending moves over the next month or more.  Shorts will not be welcome.


Bitcoin may have completed the back-testing of the 52-day Moving Average at 90587.00 this morning, leaving it to resume its decline to the Head & Shoulders target.  The Cycles Model suggests bitcoin may reach its target in the next 2-3 weeks.


Silver has exceeded its price target of 100.00, rising to 101.68 thus far.  While it may go nominally higher, it has achieved it mission on an extended Master Cycle.  Prepare for an imminent reversal..


Posted in Published | Comments Off on January 23, 2026

January 22, 2026

The Lord’s Prayer

Our Father, who art in heaven, hallowed be thy name.  Thy Kingdom come, Thy Will be done, on earth as it is in heaven.  Give us this day our daily bread and forgive us our trespasses, as we forgive those who trespass against us.  And lead us not into temptation, but deliver us from evil.  Amen

8:30 am

Good Morning!

SPX futures rose to a morning high at 6923.40, then eased down, remaining above yesterday’s intraday high.  The Cycles Model allows this, although this morning’s probe may be the last gasp at recovering the ATH.  The prior six days were preparation for the next fractal, the largest of the series.  At a minimum, the SPX may decline to its November low at 6521.92.  Additional possible targets for this declining fractal may be the mid-Cycle support at 6456.03 or the 1987 trendline at 6030.00-6050.00.  Nothing can be ruled out at this time, although most analysts consider this decline a minor pullback to be bought.  A decline beneath 6800.00 sets this decline in motion.  There is no room for error.  Investor and hedge fund risk taking are at their upper limits.

Today’s options chain shows Max Pain at 6870.00, where the smallest options payout occurs.  Long gamma resides above 6900.00 while short gamma strengthens beneath 6850.00.

ZeroHedge reports, “US equity futures and global stocks are sharply higher as the S&P again marches toward a new ATH while the latest vol spike subsides, after Trump’s tariff pivot eased geopolitical fears, though Greenland and other flashpoints mean the optimistic mood is laced with some caution.”


The pre-market VIX declined further, to 15.88, near the trendline.  This has been an unusual formation, in that the impulse took only one-third of the rise from the bottom, while the correction overpowered it, rising to 20.99.  It did the job, but it was ugly.  The Cycles Model suggests the correction may be complete, or nearly so, allowing the rally to reassert itself.

The January 28 options chain shows Max Pain at 18.00.  Short gamma occupies the chain between 15.00 and 17.00.  Long gamma begins at 19.00 and may stretch to 40.00.  Options sentiment is changing.


The US 10-year bond yield futures declined to the mid-Cycle support at 42.24 this morning, suggesting a short decline to support before resuming its rally.  Trending strength may resume today or tomorrow, propelling TNX significantly higher.  The current Master Cycle runs to mid-February, so a probe to the Cycle Top at 45.25 may be the next target.


Posted in Published | Comments Off on January 22, 2026

January 21, 2026

The Lord’s Prayer

Our Father, who art in heaven, hallowed be thy name.  Thy Kingdom come, Thy Will be done, on earth as it is in heaven.  Give us this day our daily bread and forgive us our trespasses, as we forgive those who trespass against us.  And lead us not into temptation, but deliver us from evil.  Amen

3:25 pm

SPX has begun its decline and is beneath Intermediate support at 6881.00 as I write.  This reinstates the sell signal for those who went long or cash.  By Friday, the SPX may be beneath the 8-month trendline currently at 6785.00-6790.00.


8:10 am

Good Morning!

SPX futures bounced overnight, but gave it all back this morning.  It is currently searching for a new low,, having declined to 6881.70 thus far.  The 8-month trendline lies at 6775.00, where the next possible bounce may occur.  Should SPX decline substantially through that level, the next possible support may lie at 6700.00.  A recent survey found investors not only the most bullish since July 2021, but the least hedged.  The Cycles Model suggests another wave of panic selling may arrive by Friday followed may another two weeks of decline.  This is not a good combination.

Today’s options chain shows Max Pain at 6845.00.  Long gamma resides above 6860.00 while sort gamma becomes strong beneath 6825.00.  SPX is deep in short gamma presently.  Dealers are likely under instructions to claw back to 6845.00 by the end of the day.

ZeroHedge reports, “Futures have reversed modest overnight gains and are trading near session lows while small caps continue to outperform (for a record 12th day in a row) even as Japanese and global bond yields stabilize and the market awaits today’s major catalysts including Trump’s speech in Davos…”


The premarket VIX has declined  this morning to 19.11, signaling a possible bounce in the SPX later today.  A correction may bring the VIX back down to the 52-day Moving average at 17.16 in the next day or so.  The VIX has not yet shown extreme panic.  However, the Cycles Model shows the VIX going higher to the end of the month, with a possible extension in to early February.  Triangle formations, when complete, often retrace to their upper limit at 60.13.


The US 10-year bond yield is consolidating after yesterday’s gap higher.  It has been on a buy signal since last Friday and may be ready to go much higher after a brief pullback.  The trend strengthens again on Friday and through the weekend, with another surge at the end of the month.  The minimal high may be the Cycle Top resistance at 46.25.  However, Treingles are often retraced to their top, which is 49.97.


USD may have completed a short pullback yesterday and the probability of a resumption of the rally may be increasing.  The mid-Cycle resistance is at 98.65 while the 52-day Moving Average is at 98.92.  Aove either level may reinstate the buy signal.  The Cycles Model infers that the uptrend may continue to mid-April.  It may be fueled by dollar short covering, especially when the USD rises above the November high.


Bitcoin rose to 90987.00 this morning, above the 52-day Moving Average at 90270.00.  However, it has come back down to re-cross the 52-day as the decline may resume today.   Fractal analysis suggests a possible decline to 70600.00 while the Head & Shoulders formation infers a minimum decline to 71500.00.  These possible targets may be seen in the next two weeks.


Silver futures have declined to a morning low at 92.14.  The January 15 high at 93.57 remains the top of that Cycle.  Silver futures traded for as much at 95.77 on that date as dealers charged more than $2.00 premium over the spot price.  Today the futures showed a high at 95.43, which may break the January 15 high.  Investors “feel” as if silver is heading higher, but it may not be so.  The Cycles Model suggests that silver may start a decline to early April as investors take profits and those who are margined may have to cover.


Gold futures rose overnight to a high at 4890.00, hitting trendline resistance.  It may have maxed out its current Master Cycle at 280 days.  Should that be so, a decline may develop that could last to early April.


Crude oil bounced from its 52-day Moving Average at 58.63, rising this morning to 60.87 and completing a retracement.  Today we may see the decline resume with strength in its downtrend coming back this weekend.  This time the Head & Shoulders neckline may not lend its support as the Cycles Model calls for a decline to early March.


Posted in Published | Comments Off on January 21, 2026

January 20. 2025

The Lord’s Prayer

Our Father, who art in heaven, hallowed be thy name.  Thy Kingdom come, Thy Will be done, on earth as it is in heaven.  Give us this day our daily bread and forgive us our trespasses, as we forgive those who trespass against us.  And lead us not into temptation, but deliver us from evil.  Amen

2:45 pm

SPX is beneath the 52-day Moving Average at 6831.41.  A confirmed sell.


12:50 pm

BKX is testing its Intermediate support at 165.05 and may break through shortly.  It is currently on an aggressive sell signal, which usually means “Lower your exposure.”  A decline beneath 165.00 gives a confirmed sell signal.  The next two weeks may give a foretaste of what may follow in the next month.


7:45 am

Good Morning!

SPX futures declined to 6813.20 over the MLK weekend, beneath the 52-day Moving Average at 6829.03, bouncing off the 8-month trendline near 6800.00.  The bounce may rise to, or above, 6900.00, but the sell signal may have been confirmed.  These high amplitude swings are what is needed to break the uptrend.  Once beneath 6800.00, few will believe that the uptrend is intact.  The Cycles Model implies a decline that may last into early February, followed by a 2-3 week bounce.  Friday may see a resurgence of a panic Cycle, as few are expecting a breakdown in stocks within a week of an all-time high.

Today’s options chain shows Max Pain at 6950.00, while the SPX futures are currently near 6845.00.  It is likely that the dealers may be approaching the REPO window for enough liquidity to retrieve those losses by the end of the day.

ZeroHedge reports, “US equity futures are sharply lower, on pace for their biggest drop of the year, with Beta underperforming. And while geopolitics are the catalyst – as attention remains glued to see what Trump will say next on his Truth Social feed ahead of this week’s Davos meetings…”


The premarket VIX has vaulted to 20.69 over the MLK weekend.    It may retreat back to the 52-day Moving Average at 17.10 later today.  The Cycles Model anticipates a “spike” high near the end of January followed by a brief correction.   Traders are starting to brace for downside volatility this morning. The minimum target may be the April 7 high at 60.13.

Tomorrow’s monthly options chain shows Max Pain at 19.00.  Short gamma resided between 15.50 and 19.00.  Long gamma rests above 20.00 and extends to 100.00 with large institutional positions in the higher echelons.


The US 10-year bond yield futures rose to 43.15 this morning, as inferred by last week’s buy signal.  Volatility may be increasing this week with a possible panic surge by the weekend.  The formation we see in the charts is called a “slingshot.”  It comes at the end of a 2-year Triangle formation whose top is at 49.97.  While the 1-year chart shows the Cycle Top near 45.25, the ultimate target may be 50.00.


USD futures suddenly declined in excess of its 61.8% Fibonacci retracement level, then bounced to Intermediate resistance at 98.60.  The retracement may be over, allowing the USD to break out above resistance at 98.60 to 98.94 (the 52-day Moving Average).  Should it do so, the USD may resume its rally to mid-March.

.

The Japanese Yen had bounced from its Cycle Bottom at 62.82 on January 13.  The bounce does not have the qualities of a reversal, giving permission to decline further.  The Cycles Model suggests a lower bottom near the end of the month.  Traders were sellers of Japanese bonds after a tepid 20-year auction earlier today.  The spillover from rising Japanese rates are starting to be felt worldwide.


Bitcoin’s decline may have been temporarily stopped by the 52-day Moving Average at 90311.00.  A bounce may ensue, taking BTC near 95000.00 in the next couple of days.  However, the decline isn’t finished, as it may aim for the Hewad & Shoulders target in the first week of February.


The Silver Index rose to 95.77 this morning, completing its final probe toward 100.00.  The Master Cycle is stretched to its limit, so we may expect to see a reversal imminently.  The Cycles Model suggests a possible surge to 100.00 in the next couple of days, followed by a possible 2-month decline.  The Cycles Model indicates a minimum decline to 60.00 with a possible decline to 30.00.


Posted in Published | Comments Off on January 20. 2025

January 16, 2026

The Lord’s Prayer

Our Father, who art in heaven, hallowed be thy name.  Thy Kingdom come, Thy Will be done, on earth as it is in heaven.  Give us this day our daily bread and forgive us our trespasses, as we forgive those who trespass against us.  And lead us not into temptation, but deliver us from evil.  Amen

11:20 am

SPX declined beneath the trendline at 6935.00, testing short gamma beneath 6940.00…and didn’t like it.  It has swung back to 6950.00 where long gamma rules.  It needs to stay above the trendline to maintain its uptrend.  A breakdown beneath it brings short gamma into play, setting the stage for a panic decline going into next week.


10:06 am

BKX has ;reversed down from its 61.8% Fibonacci retracement bounce this morning.   A sell signal may be generated with a move beneath Intermediate support at 164.70.  Additionally, the 52-day Moving Average lies at 159.54, beneath which another sell signal may be made.  Finally, a decline beneath the trendline at 151.00 breaks the uptrend.


7:45 am

Good Morning!

SPX futures bounced off the Ending Diagonal trendline at 6935.00 in the overnight session, consolidating beneath yesterday’s high.  The decline is likely to resume today, with an aggressive sell signal beneath the trendline.  The sharp bounce yesterday may have been a result of pension (dumb) money,  combined with buy-the-dip retail investors and dealers attempting to keep the index out of short gamma. Liquidity it thinning while the Mag 7 have been whittled down to 1…Google.  How long can that last?  Upward momentum has been lost.  There are any number of catalysts that may weigh down on equities.  Today we may expect some large moves…going nowhere.

This morning’s monthly options expiration is in.  SPX may open beneath long gamma, which starts above 6950.00.  Today’s closing expiration shows Max Pain at 6945.00.  Long gamma begins above 6950.00 while short gamma may begin beneath 6940.00.  This may be a battle royal to the close.

ZeroHedge reports, “Futures are higher, and trading near record territory, led by tech as this year’s great rotation shows no sign of slowing, broadening the base of names driving Wall Street’s push back towards all time highs. As of 8:00am, S&P 500 futures were 0.3% higher with Nasdaq 100 contracts up 0.4% as the latest wave of enthusiasm for technology stocks carried into Friday.”


The premarket VIX has consolidated above the trendline near 15.35.  The Cycles Model anticipates rising volatility with a possible panic move beginning this weekend.  The next two weeks may be violent in the VIX.  Low volatility does not mean low risk.  The loss of momentum in the Mag 7 leaves the market more sensitive to shocks.

The January 21 options chain shows the VIX may be loaded for bear beneath 17.50 with over 850,000 put contracts.  However, there are 1,580,000 call contracts between 18.00 and 30.00.   Furthermore, there is a buildup of large institutional holdings of calls every 5 points up to 100. This is the first monthly options chain with a preponderance of long gamma in the VIX.


TNX leaped up to 41.97 from its Master Cycle low that bounced from the 52-day Moving Average at 41.29 on Wednesday.  Signs of inflation are mounting.  Trending strength is reappearing today, with a possible breakout above the neckline at 42.05.  The next four weeks show multiple days of strength, suggesting a breakout may lead to a rally to the Cycle Top at 46.25.


The US Dollar Index pulled back to 99.19 after making its Master Cycle high yesterday.  Intermediate support and the mid-Cycle support lie at 98.66, proposing a shallow correction lasting only a few days before the trend reasserts itself.  Next week may bring two panic upside days bringing possible pain to the dollar shorts.  The breakout above the November high may be profound, as short covering dominates the USD.


The Japanese Yen may have a final probe toward 62.00 to complete its Master Cycle.  A reversal may be imminent, as the Bank of japan is conducting its monetary Policy meeting this weekend.  An announcement of higher key interest rates may result, as the BOJ attempts to stem the declining Yen.   A reversal of this declining 10-month trend in the Yen may result, putting pressure on the Yen carry trade, both in rising interest  and rising loan principal.


Silver futures declined to 87.38 in the overnight market, leaving the January 14 ATH intact.  The down candle is the largest since 1980.  The Cycles Model implies a possible two-month correction.  While the word “correction” sounds mild, silver may decline to its mid-Cycle support at 46.92 – a 50% decline from the top.  There is no sell signal yet.  Only caution is advised.


Posted in Published | Comments Off on January 16, 2026