
2:20 pm
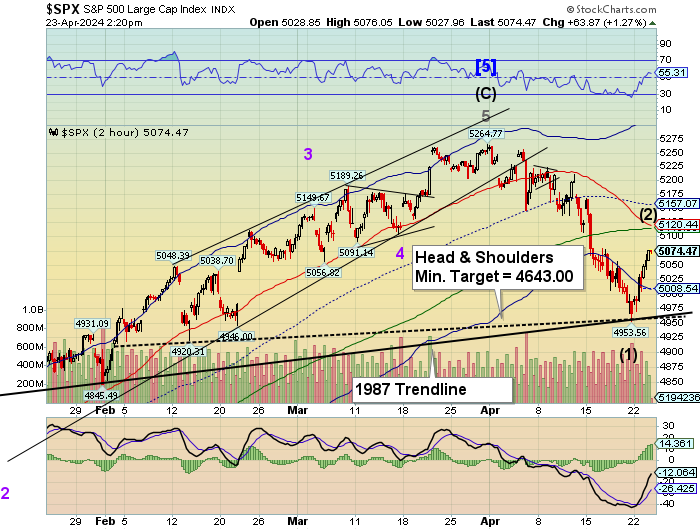
SPX has exceeded the 38.2% retracement level at 5070.16 and appears to have completed its bounce or nearly so. I wish yo point out a possible bearish formation that indicates a minimum target that may be reached in a very short time. A broken double trendline foretells a probable panic decline.
RealInvestmentAdvice muses, “Is this just a correction after a strong bullish advance from November, or is the bull market ending? If you read some of the headlines, you would suspect the latter. As noted by MarketWatch last week:
“For the first time since early November 2023, less than 30% of S&P 500 stocks are trading above their 50-day moving average — a clear indicator of the current poor market’s breadth. This significant drop from the 85% observed in late March and 92% at the beginning of January highlights a dramatic reversal in market dynamics.”
8:00 am

Good Morning!
NDX futures are consolidating this morning, on their way to retest the 100-day Moving Average at 17372.81. The Cycles Model indicates another day of correction. Should the NDX break through the 100-day, the next level of resistance stands near 17400.00, with the 38.2% retracement near 17500.00. The Cycles Model does not indicate any strength, but Long gamma may play a part in boosting this correction.
Today’s options chain shows Maximum Investor Pain at 17260.00. Long gamma starts at 17270.00 but only has a mediocre run to 17400 (the level to watch). Short gamma may begin at 17250.00, but the sentiment isn’t short anymore.
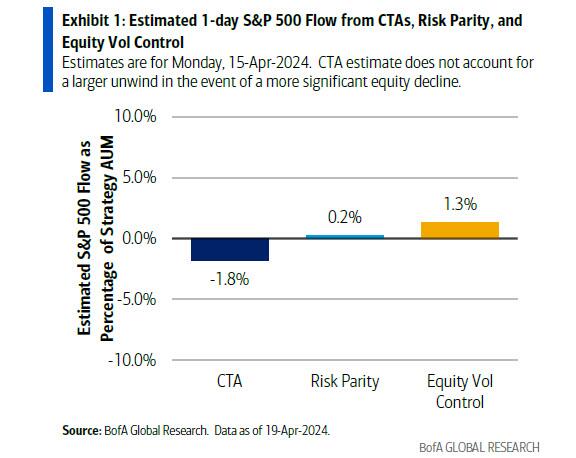
ZeroHedge remarks, “On one hand, the technical storm appears to have subsided: as we predicted last night, just days after the biggest CTA shake-out in over a year (thanks to the fake Iran-Israel war, which on Thursday shook out all the sell stops thanks to the latest brutal bear trap, and thus paradoxically removed any residual selling pressure), other systematic funds finally stepped in to buy the dip, with vol control and Risk-Parity strategies both starting to add leverage back after a sharper unwind last week.
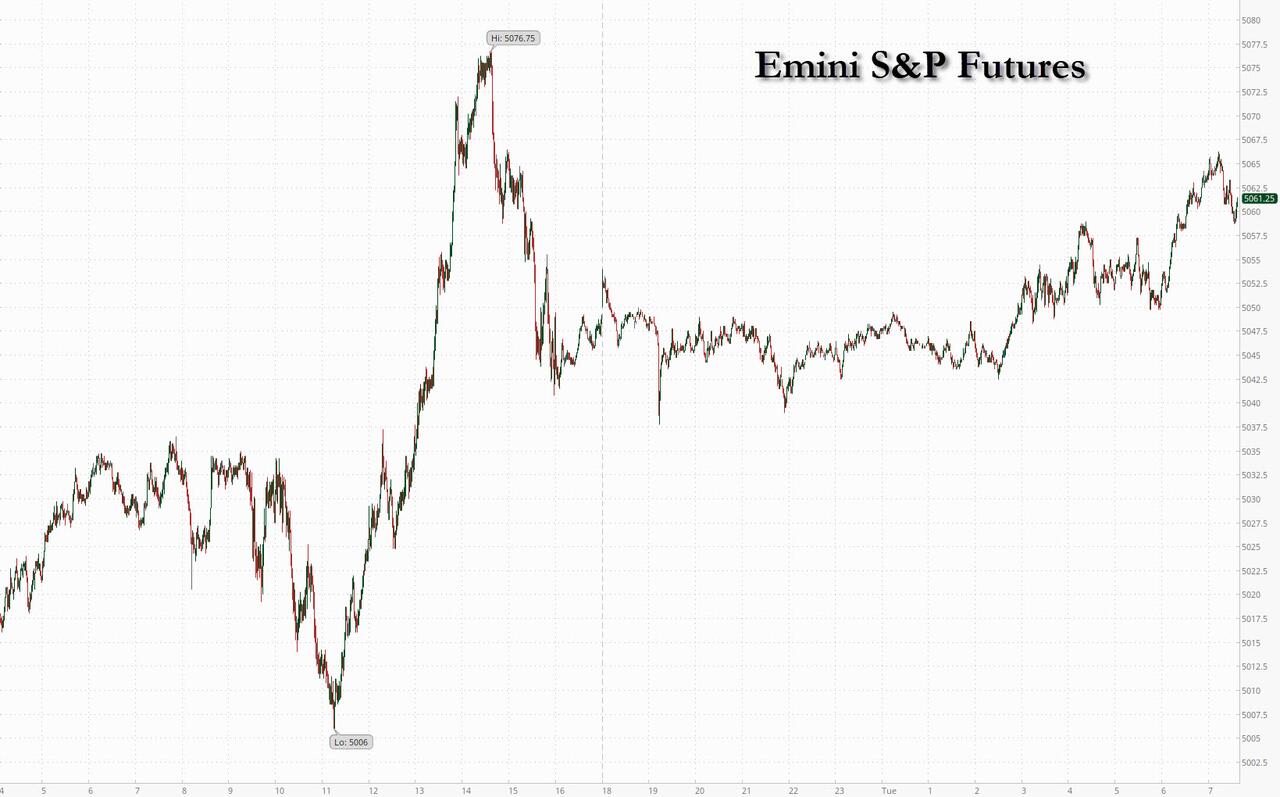
SPX futures are also consolidating inside yesterday’s trading range. The correction appears incomplete. Another probe higher may be warranted. The initial resistance lies at 5056.00. while stronger resistance may be found at 5082.00. There is no indications of strength in the Cycles Model. However, the final resistance for this correction may be found near 5100.00.
Today’s options chain shows Max Pain at 5025.00. Long gamma begins at 5040.00 and runs strongly to 5100.00. Short gamma may start at 5000.00.
ZeroHedge reports, “US equity futures are higher for the second day, even as small-caps underperform after bond yields rise about +4bps and trade near session highs. As of 7:40am S&P and Nasdaq futures were 0.3% higher after Wall Street’s rebound from a $2 trillion selloff; European stocks also rose on broad-based strength, with only commodity-related sectors in the red; the UK’s FTSE 100 index hit a record high as a rebound that took hold on Monday gathered momentum. Ahead of Tesla’s earnings today, the Mag7 are mixed with semis higher pre-mkt after the recent rout. Commodities are stronger led by Ags and Energy with a flat USD. The macro data focus is on Flash PMIs, Home Sales, Regional Mfg Activity indicators; earnings are skewed towards the Industrials sector with TSLA the first Mag7 stock set to report. We will see if the last few trading sessions sufficiently squared positions and if realized stock moves can match the implied moves, expected to be the largest in 1.5 years.”

VIX futures dipped to 16.05 this morning as the correction nears completion at a 50% retracement of the rally since March 21. The correction may decline to the mid-Cycle support at 14.92 yet today. However, once complete, the VIX may rise to a minimum of 30.00.
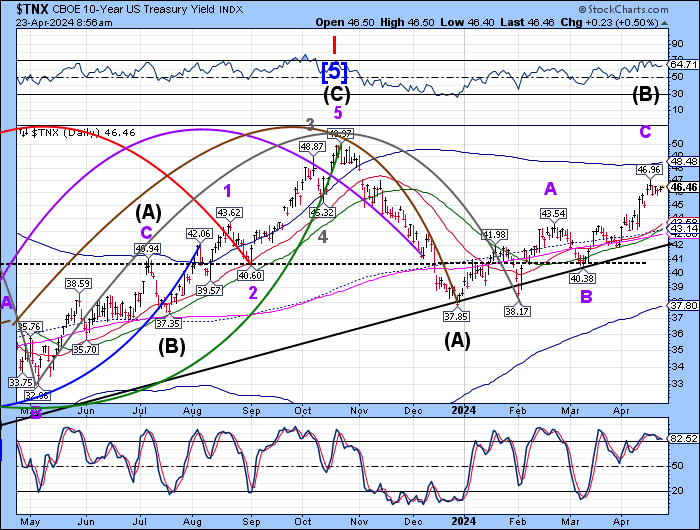
TNX has risen to 46.50 this morning. The Cycles combined price and time as two of their elements. The TNX Cycle may have satisfied the time requirement, but not the price. The current target for this rally may be the Cycle Top at 48.48. Should that be the case, the 10-year may continue to rise through the end of the week. A spike high above 48.00 may shake up stock investors.

Gold futures have declined through the aggressive sell signal at 2340.00 yesterday. Today it continues the decline, making a low of 2305.00. The next level of support may be Intermediate support at 2259.00, nearly an 8% decline from the top. Unfortunately for the longs, this decline may continue until for the next 5-6 weeks.