
10:02 am

The Ag Index is testing its Cycle Bottom at 383.83 on day 265 of its current Master Cycle. Today’s low is between the proposed potential lows at 380.54 and 387.76 mentioned this summer. While it may linger another day or two, the new Master Cycle is overdue and ready to begin.
ZeroHedge remarks, “Russia’s second consecutive bumper wheat harvest has cemented it as the top producer of the grain, with the surplus leading to a three-year low in prices, overshadowing any concerns about tensions in the Black Sea between Ukraine and Russia. As the quarter ends on Friday, wheat prices are on track to record the longest quarterly slump in 14 years. While this development is favorable for consumers, traders must closely watch prices.
Bloomberg reports wheat futures in Chicago have tumbled about 11% in the past three months and are set for the fourth quarterly decline. Even though Russia terminated a safe-passage deal in July that allowed bulk carriers to export Ukraine’s grain via the Black Sea to the rest of the world, prices have remained under pressure – mainly because Russia has had a record bumper harvest. ”
9:53 am

BKX, our liquidity proxy, may be about to cut loose to the downside. The ice becomes thinner and cracks are appearing…
ZeroHedge comments, “Retail money-market fund inflows continued last week and usage of The Fed’s emergency funding facility for banks remains at record highs, as shrinkage of The Fed’s balance sheet continues.
Tonight, all eyes are on the bank deposits for more worries, and on a seasonally-adjusted basis, total deposits jumped $49BN last week (the biggest inflow since May)…
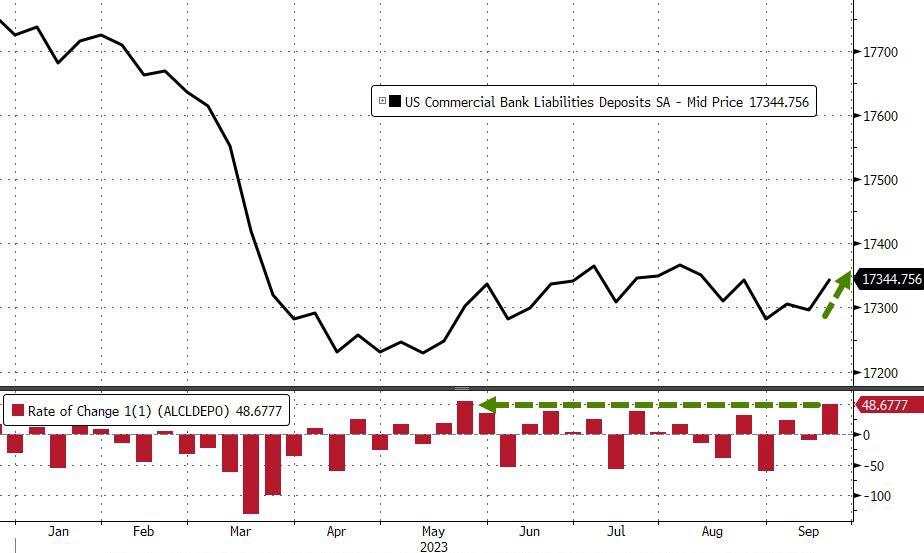
Source: Bloomberg
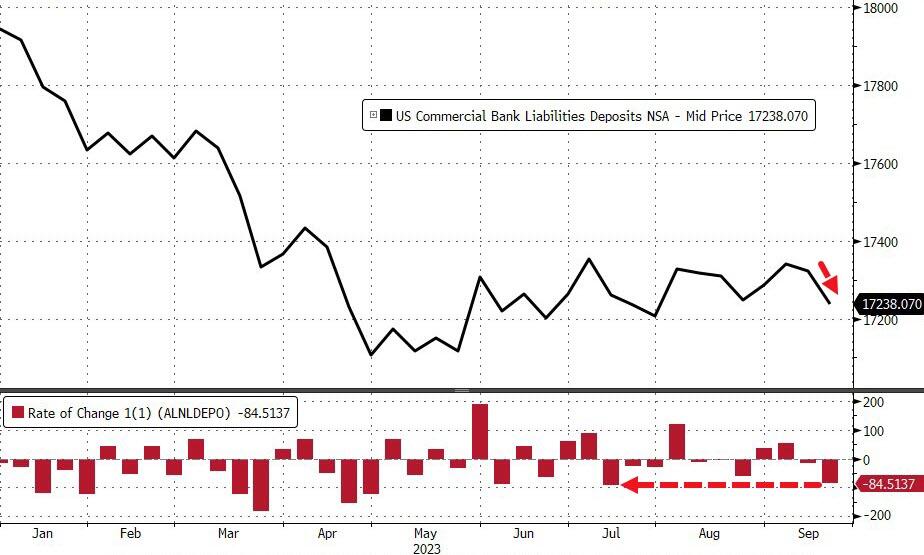
But, on a non-seasonally-adjusted basis, total deposits plunged $85BN last week (the biggest drop since July)…”
7:30 am

Good Morning!
NDX futures tested Friday’s high by rising to 14864.60 before falling back near the close of the week. It is currently consolidating between the 100-day Moving Average at 14893.89 and the Head & Shoulders neckline at 14435.00. Crossing the neckline may activate that formation leading to a multiple week decline.
Today’s options expiration shows NDX options deep in short gamma with long gamma starting at 14880.00 and short gamma beneath 14850.00. Options sentiment has turned to the dark side.
Meanwhile, ZeroHedge informs, “Goldman sees 2nd chance opportunity in Magnificent 7
Goldman says that the divergence between falling valuations and improving fundamentals represents an opportunity for investors to buy.”

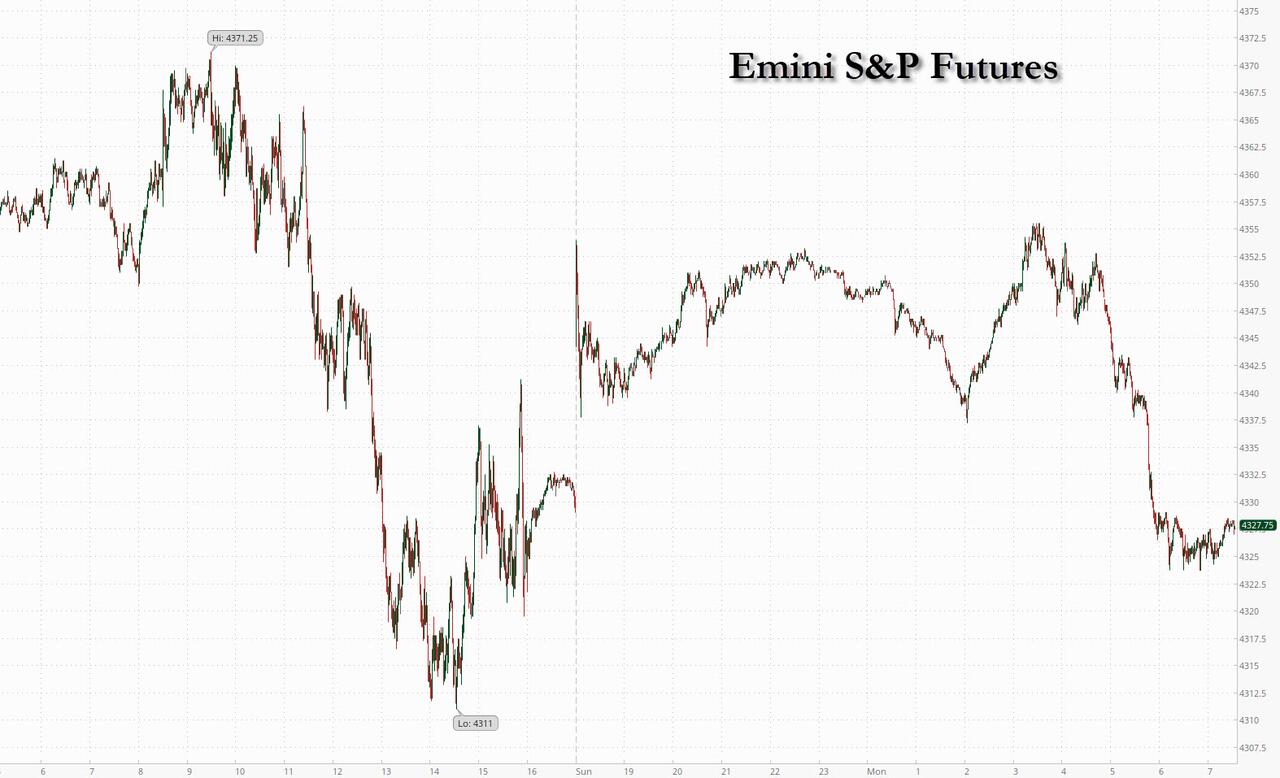
SPX futures rose to 4320.10 over the weekend before declining back to its closing value. SPX has met its retracement target and is primed to fall beneath its 200-day Moving Average at 4226.85. It is on a sell signal with the Head & Shoulders target in view.
Today’s op-ex shows Max Pain at 4315.00. Long gamma begins at 4350.00, while short gamma is strong beneath 4300.00. Short strength remains down to 4000.00.
ZeroHedge reports, “Stocks tried to stage a modest rally overnight after the US government shutdown was postponed by 45 days, but failed after the global bond selloff resumed on Monday, with 10-year Treasury yields back to the highest since 2007, as investors waited for another speech by Fed chair Jerome Powell to provide clues on the direction of interest rates. As of 7:30am ET, S&P futures traded unchanged from Friday’s close after earlier gaining as much as 0.6% and following a September to forget in which they lost 4.7%; Nasdaq futures were 0.2% higher and continue to be disconnected with tighter financial conditions in rates as Treasury 10-year yields rose five basis points to 4.62% and back to the 16-year highs seen on Friday. The US dollar rose against most Group-of-10 currencies. Brent edged higher and traded around $92 buoyed by widespread bets that global demand will continue to run ahead of supply. Gold fell and Bitcoin gained for a third-straight day, surging above $28K. This week, we will have a busy calendar for macro data with ISMs and NFP being the focus; we will hear from 10 Fed speakers.”

VIX futures rose to test the trendline at 18.20 this morning. While the former cup with Handle formation no longer applies, there is no apparent formation that may take its place. That’s not a bad thing, since the next resistance appears to be the March high at 30.81.
In Wednesday’s op-ex, Max Pain resides at 16.00. There is no short gamma to speak of. Long gamma starts at 17.00 and intermittently runs to 40.00.
In the monthly op-ex (October 18, 2023), Max pain is at 18.00. Short gamma runs strong between 12.00 and 17.00. However, long gamma begins at 19.00 and is populated in six figure layers to 50.00.

TNX has vaulted higher this morning, giving credence to my warning on Friday that the correction might only be a one-day affair. The Cycles Model may not show trending strength again until the coming weekend, so TNX may venture more sideways than up to relieve the overbought condition. We will know more later today as news events may affect the outcome.
ZeroHedge opines, “Milton Friedman made the term “long and variable lag” famous. Everyone involved in markets and the economy has been struggling with the question of “what is the amount of lag” that we currently face on monetary policy. “Conventional” wisdom, as I understand it, is that it takes 3 to 6 months for economic policy to be truly felt. I think that is far too short of a “lag” effect.
I’m going to ignore the fact that there was ongoing stimulus when the Fed started to hike. For example, things like the so-called “Inflation Reduction Act” came out during the hiking cycle. In addition, the Fed was still expanding its balance sheet almost until the time of the first hike. Finally, student loans were in moratorium and there were promises (and attempts, with limited success) of debt forgiveness.
Basically, I will ignore all the reasons why the lag effect was impacted early on. I will instead focus on the reason why it is still taking so long to kick in.”

USD futures are consolidating this morning, awaiting critical economic data. Whatever it is may send USD higher, as trending strength may get a boost. The next overhead resistance lies at 112.00-115.00.

Crude oil futures are consolidating beneath its trendline at 92.50 and are on a sell signal. It made its Master Cycle high on Thursday, day 266 and had an approximate two month declining Cycle ahead of it. Declining oil prices in the face of tightening supplies tells us that there is something else going on that may be having a greater effect.
ZeroHedge maintains, “Buyers of physical oil across the planet are experiencing an acute supply shortage and are facing some of the highest premiums for supplies they’ve seen in months as plunging stocks at the largest US crude storage hub send shockwaves cross markets from Asia to Europe and the Middle East.
As Bloomberg reports, US crude cargoes on offer in Asia are being offered at the costliest premium this year. The spread between Brent and Middle East oil has jumped to the highest since February while the premium for near-term US supply is close to the highest since July 2022.
Behind the soaring premiums is Cushing, Oklahoma, the delivery point for benchmark US crude futures, which helps to set the price of oil across the Americas and beyond. As we have noted in recent weeks, inventories at the hub are now sitting just above seasonal lows last seen in 2014, and are effectively at the level known as “tank bottoms” below which inventories are for the most part unusable.

Gold futures reached a low of 1846.50 this morning, testing the Cycle Bottom support at 1839.66. Today gold is experiencing trending strength, suggesting that support may not hold. More trending strength is due over the next two weeks, suggesting the Cup with Handle target may be met in that time.