
7:40 am

NDX futures rose to a weekend high of 13388.40, not able to exceed Friday’s high inside the Ending Diagonal formation on day 269 of the Master Cycle. Today is day 272. NDX may be at the point where the Cycles may not allow further gains. However, should the NDX throw over its formation, the Cycle Top resistance at 13513.22 may act as the final resistance. The bottom of the Ending Diagonal is at 13200.00, giving a potential sell signal, which is confirmed beneath Intermediate-terms support at 13057.50.
Today’s Max Pain is at 13350.00, also hotly contested by both calls and puts. Long gamma begins at 13400.00, while short gamma may starts at 13240.00. Friday’s monthly op-ex shows long gamma beginning at 13100.00 in NDX.
ZeroHedge remarks, “Flat&Flat 4ever
1. Less than 1% weekly closing range in SPX for the past 5 weeks.
2. Large cap EPS now expected to be totally flat for 2 quarters.
3. Very little factor volatility in the US since start of Q2.
4. Financial Conditions also displays very little delta lately.
Equity moves on Ozempic
Friday closes for the past 5 weeks:
4137
4133
4169
4136
4124
From a mathematical volatility stand-point, this is very “flat & flat”.”
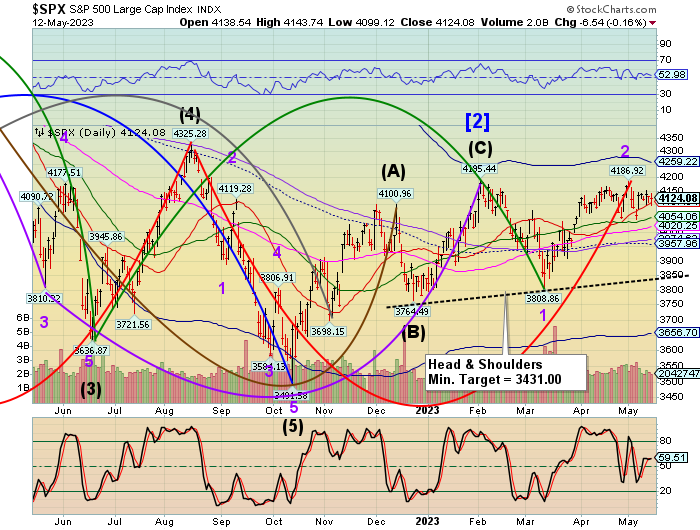
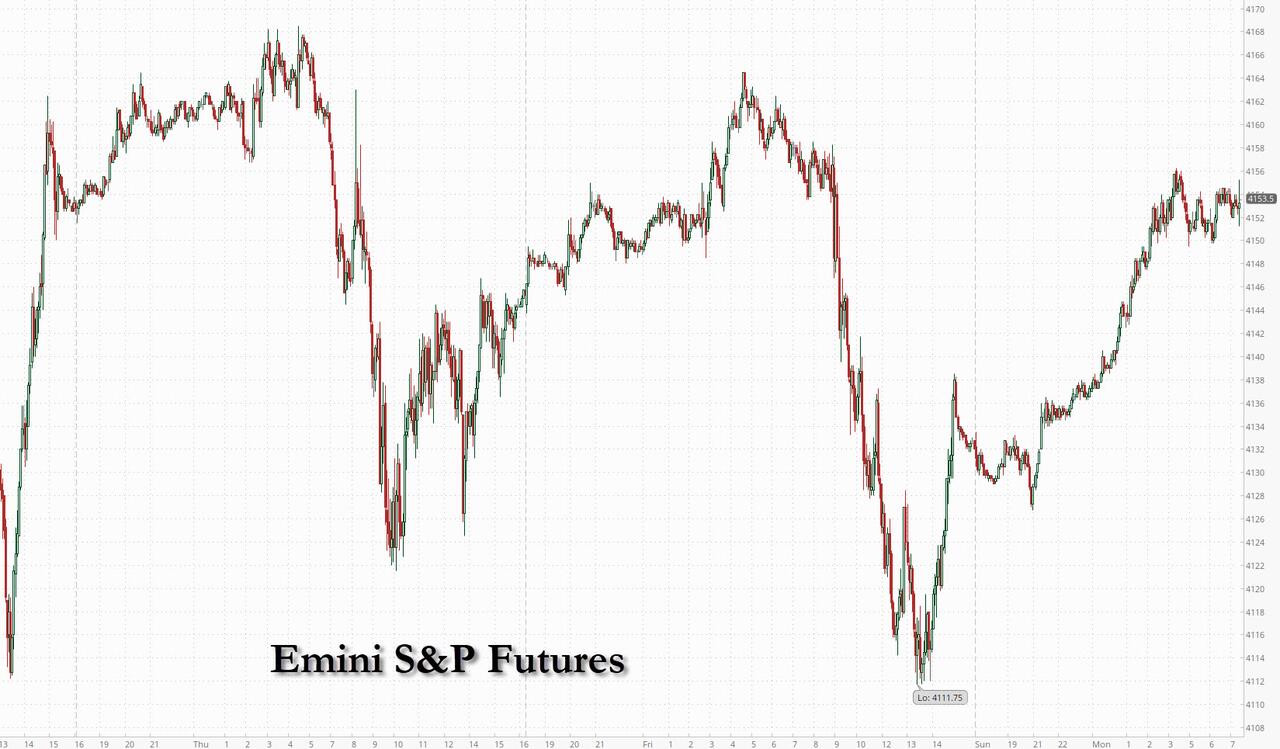
SPX futures rose to 4142.80, less than 100 basis points beneath Friday’s high. Friday’s low challenged the SPX is Intermediate-terms support at 4107.94, suggesting it may no longer hold upon further testing. Volatility/weakness appears imminent, accompanied by a potential panic Cycle.
In today’s op-ex, the 4125.00 strike is at Max Pain and is also hotly contested. Long gamma may begin at 4150.00, while short gamma starts at 4100.00. There’s no a lot of room to move before gamma takes over the options market. Friday’s monthly op-ex shows much the same dynamics, but in much larger volume.
ZeroHedge reports, “US equity futures rose to start the week as investors monitored a subtle optimistic shift in debt-ceiling talks. Both S&P 500 and Nasdaq 100 contracts added 0.4% at 7:30 a.m. ET, following similar increases in the Estoxx50 over the early London session. A subdued market reaction to the US fiscal standoff suggests that investors expect politicians to negotiate a solution after President Joe Biden voiced optimism over the weekend that a deal could be reached. Still, Treasury Secretary Janet Yellen has warned that the the world’s biggest economy risks a catastrophic default as soon as June 1 if the debt limit isn’t suspended or raised. Treasury yields ticked higher while the Bloomberg dollar index dropped to session lows; oil prices are flat, doing little to rebound from the past four weeks of losses. Gold is edging higher this morning, while iron ore and copper also gain.

VIX futures are testing the long-term trendline at 17.50, but remain beneath it. Today VIX may get its first shot of adrenaline as tending strength returns. Should that be the cse, the trendline and the 50-day Moving Average may be exceeded. An aggressive buy signal is already in place. Crossing the trendline, and especially the 50-day may confirm the signal.

TNX has risen above Intermediate-term resistance at 34.71 , confirming the buy signal. Most analysts won’t recognize this until TNX crosses above the50-day Moving Average at 35.41 or the 200-day Moving Average at 35.71.
ZeroHedge remarks, “Higher bond yields are an increasingly likely prospect as rising inflation expectations push bond holders to demand an extra premium to lend money.
It’s been a testament to the Fed’s inflation-fighting credibility that – despite almost double-digit CPI – bond yields have not risen even more. The central bank’s own two-year forecast for PCE inflation never got above 3%, and based on the behavior of term premium – the extra yield bond holders demand above what is implied by long-run rate expectations – the market has taken the Fed at its word.
Since bond yields bottomed in August 2020, virtually the entire rise has been accounted for by expectations of Fed rate increases.”
ZeroHedge further advises, “As if the worst banking crisis since Lehman (and in terms of notional assets, even worse) wasn’t bad enough – and it will get much worse because a quick and dirty overlay of commercial bank deposits currently vs where they should be assuming the Fed completes its normalization paradigm shows another $1.5 trillion in outflows…
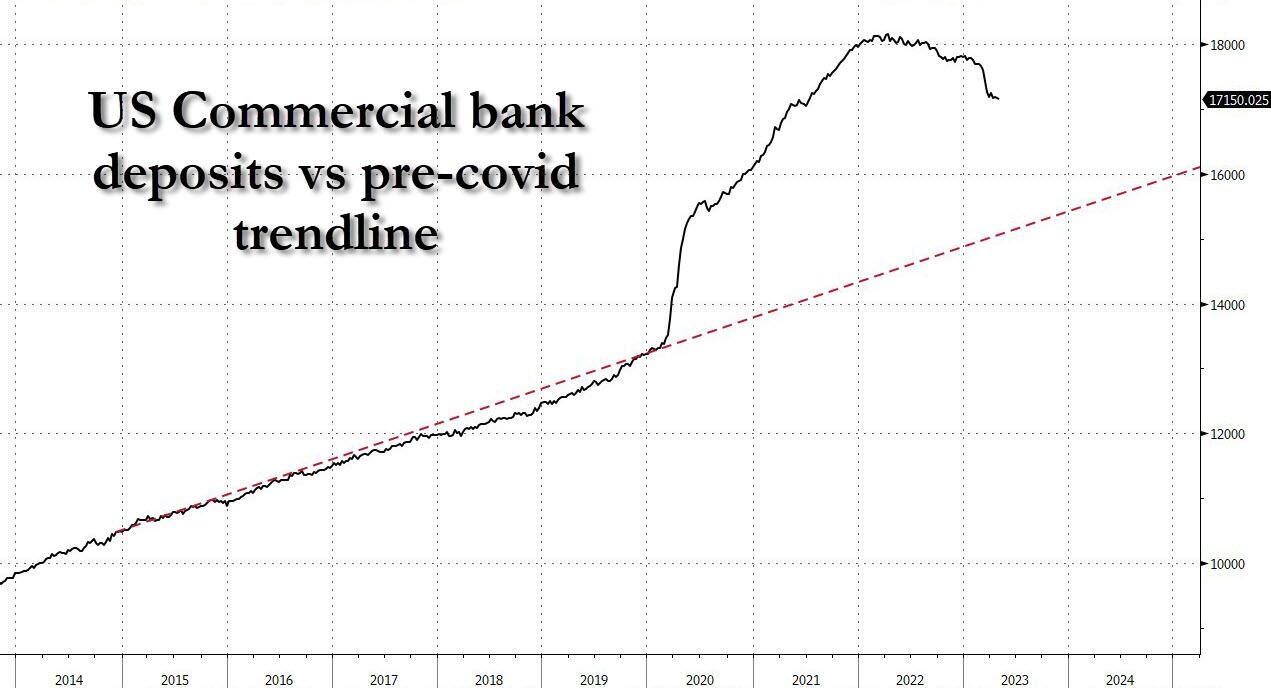
… a familiar systemic crisis ghost has made a surprise re-appearance: the trade that led to the repo crisis in Sept 2019 and also brutally exacerbated the crisis of March 2020 when for several days the Treasury market had zero liquidity, is back and is looking to blow up a whole new generation of clueless rates traders.”
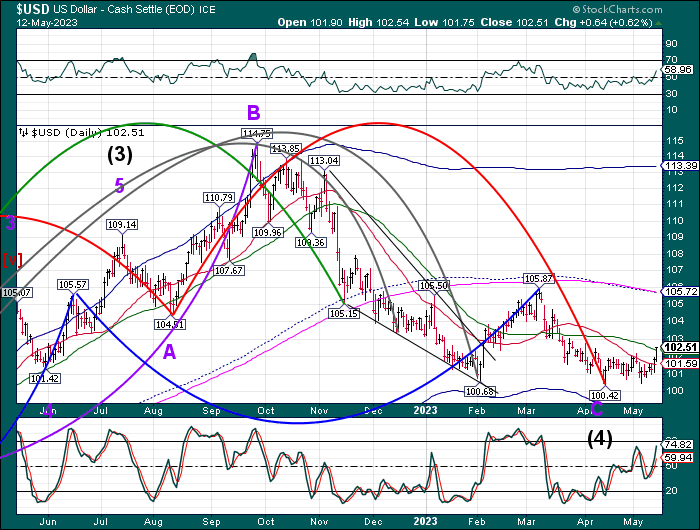
USD futures have retreated to 102.20, just beneath the 50-day Moving Average at 102.38. The buy signal was made at Intermediate-term support/resistance at 101.59, so USD is in an accumulation phase. The Cycles Model suggests the rally un USD may continue for the next month.