
8:00 am

Good Morning!
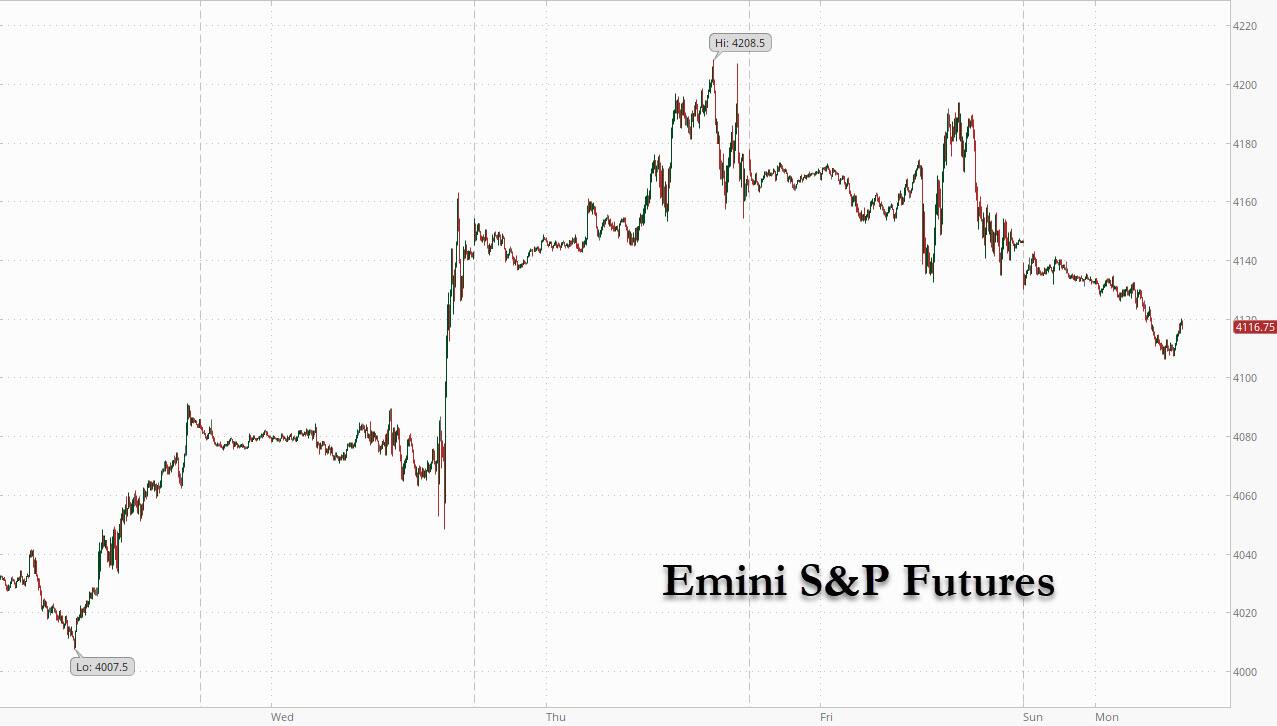
SPX futures declined to 4094.50, then bounced this morning. On Friday it closed beneath the 2-hour Cycle Top, giving an aggressive sell signal. This may appear to be tenuous, since the next nearest support is the descending trendline at 3996.00, followed by the 50-day Moving Average at 3958.00. However, SPX made a reversal on day 258 of its Master Cycle, 3 days after its 12.9-month Primary Cycle was completed. A double Cycle Top indicates nothing but downside from here. The Cycles Model suggests a decline through early March.
Today’s options chain shows Maximum Pain at 4125 with long gamma starting at 4150.00 and short gamma at 4100.00. The range between long and short gamma is tightening, increasing the probability of a breakout (breakdown).
ZeroHedge reports, “The post-payrolls slump in US stocks and global markets was set to deepen on Monday amid jitters around the Fed’s policy outlook and an escalation of tensions between Washington and Beijing. Nasdaq 100 futures were down 1.2% as of 745 a.m. ET while S&P 500 futures fell 0.6%, both well off session lows, as investors watched developments between the US and China over a suspected spy balloon, with pressure mounting on President Joe Biden to retaliate with new export controls on sensitive technology, setting back a recent improvement in US-China relations.”

VIX futures broke higher to 19.81 this morning. The Master Cycle low was made on Thursday on a belated day 276. The Cycles Model suggests a probable rally to the end of the month. Unfortunately, many analysts consider the VIX as a now worthless indicator, since it performed so poorly for the last year.
Wednesday’s options chain shows Max Pain in VIX at 18.00. There is a shrinking population favoring puts at 17.00. Long gamma begins at 19.00. Calls show a declining conviction above 25.00. However, the February monthly op-ex (February 15) shows a fierce conviction for calls all the way to 80.00 (189,243 call contracts). Unfortunately, these contracts have less than 30 days to maturity, so they will not show on the chart until they mature.
ZeroHedge comments, “Forget VIX
The VIX calculations use S&P 500 option contracts with more than 23 days and less than 37 days left to maturity. So, none of the 0DTE options trading impacts VIX.
You can stare at VIX all you want, but you are unlikely to get much useful information. Speculators, vol sellers, covered call sellers, and hedges have all moved their money from the more expensive options (included in the VIX options) to less expensive options. Some option purists will scream bloody murder that the daily option implied volatility is way more expensive than it is in the longer-dated options, but they are being too smart for their own good as this is about leveraged dollars, not trading implied versus realized volatility.”

NDX futures have declined through short-term support at 12473.35 (not shown) to 12408.20, tripping an aggressive sell signal. The next support is the 200-day Moving Average at 11860.28, where a sell signal may be confirmed. This is a difficult signal due to the spike in the last two days of the rally which forced a great unwind of shorts. Virtually everyone is naked as the tide goes out…
ZeroHedge remarks, “On Friday, we first reported that according to Goldman’s Prime Brokerage team, following the sharp post-FOMC/ECB/BOE market rally Thursday led by High Retail Sentiment (GSCBHRSB), High Beta 12M Losers (GSCBLMOM), and Most Short (GSCBMSAL) stocks, the bank’s Prime book – a proxy for broader hedge fund exposure – saw a sharp increase in de-grossing activity, driven by short covers and long sales (1.6 to 1 ratio).
What does that mean in notional terms? As Goldman’s Vincent Lin explains, Thursday’s de-risking, or de-grossing – short covers and long sales combined – was the largest since Jan ’21 and ranked in the 99.9th percentile vs. the past 10 years. US and European equities made up ~64% and 35% of the notional de-grossing, respectively. That’s right: hedge funds were so beared up going into the FOMC, the result was bloodbath as margin calls collided with stop losses and everything was sold with the bathwater.”

TNX rallied past the 50-day Moving Average at 35.93, confirming its buy signal (UST sell signal). The Cycles Model shows a significant amount of trending strength building up this week. This move is catching many traders off guard, as it seemed that the decline would never end.
ZeroHedge observes, “Chatter: “The good cyclical investors think we have more to run,” said the strategist. “The biggest difference between ’22 and ’23 is that most now believe there is a bull market in bonds,” he added. 10yr treasury yields have been trending lower since October, falling from 4.33% to 3.53%. 30yr yields peaked at 4.43% and now trade 3.62%. “In a bond bull market, you need a hard landing for the economy or a credit event for stocks to not go up. Bears say it’s impossible for the Fed to cut without a hard landing. And bulls say you don’t have to have either.”

USD futures broke above Intermediate-term resistance at 102.91 and the declining Wedge formation, forging higher to 103.29. This gives the USD a confirmed buy signal, to be further reinforced above the 50-day Moving Average and trendline at 103.83. The low was made last Wednesday on day 279 of its belated Master Cycle. The Cycles Model affirms a continued rise through the end of February, taking back what was lost in the 3-month decline.