
9:57 am

SPX declined through the 200-day Moving Average at 3961.00 (not shown), giving a sell signal. The next level of support is the 50-day Moving Average at 3935.00. Mid-Cycle support lies at 3920.00. Intermediate-term support at 3910.00. SPX has crossed a huge put wall at 3975.00, which may accelerate the decline much further. Today is a trending strength day and it has appeared in spades. The NYSE is blaming the decline on “manual error.”
ZeroHedge reports, “In a brief two line explanation, the New York Stock Exchange said a “manual error” caused wild price swings and trading halts for hundreds of company stocks when the market opened on Tuesday. It wasn’t clear just how easy it is to trigger such an error or who was responsible for the rollercoaster trades which sparked shock and outrage across Wall Street.
According to an updated statement on its website, the New Jersey-based exchange which doubles as a TV studio in New York said that the root cause of the issue, which the exchange operator says has been resolved, was tied to the company’s so-called “disaster recovery configuration” at the start of the day. Over 1,300 trades and some 84 stocks were impacted and marked as “aberrant.”
8:10 am

Good Morning!
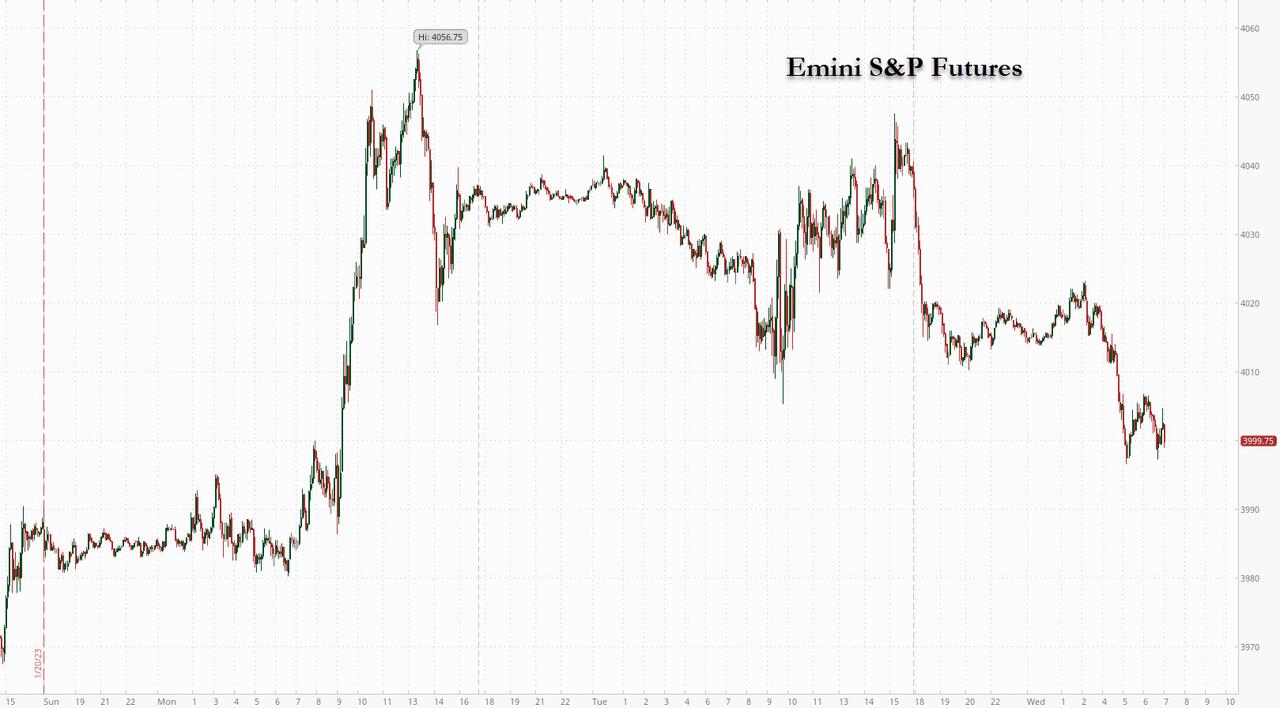
SPX futures declined to a morning low of 3980.90, testing short gamma. Today is day 250 in the current Master Cycle. With a little more than a week to go, SPX is still caught in the downtrend. Today the trending strength ramps up. We may finally have an insight about the true trend by the end of the day. Cyclically, the 200-day Moving Average at 3964.03 and the mid-Cycle support at 3931.06 defines the trend. The trendline at 4018.00 defines resistance, but not trend.
Today’s op-ex shows Maximum Pain for options investors appears at 3995.00. Long gamma starts at 4020.00 while short gamma goes into high gear at 3975.00. This is the nexus of an epic battle for control of the markets.
ZeroHedge reports, “US equity futures slumped on Wednesday after Microsoft started off the tech giants’ earnings parade by pulling off the old pump and dump, first jumping on Azure/Cloud results which beat estimates, but then erasing all gains and slumping during the company’s conference call after the company’s guidance disappointed, forecasting slower earnings and weaker demand (separately, hours later customers reported difficulties across multiple regions in accessing Microsoft 365 services, which the company attributed to networking issues). Earnings reports from companies such 3M, Boeing and chipmaker Texas Instruments also reinforced concerns about the health of corporate America and added to investors’ jitters as they await updates from the likes of Tesla and IBM. Fears also grew that a decision to send German and US tanks to Ukraine would provoke an escalation in the war.
As a result, contracts on the tech-heavy Nasdaq fell 1.3% at 7:15 a.m. ET while S&P 500 futures dropped 0.8%, and traded right around 4,000. The Bloomberg Dollar Spot Index was little changed, leading to mixed trading in Group-of-10 currencies. Treasuries edged higher, mirroring gains in most UK and German government bonds. Brent crude was little changed, while gold and Bitcoin fell.

VIX futures rose to a morning high of 20.15 thus far, still within yesterday’s trading range. A rally above 20.50 snaps it out of its short-term downtrend while the trendline and 50-day Moving Average lie at 21.61 gives us a buy signal.
In today’s options chain, Max Pain is at 21.00. Short gamma is weakening but prevails beneath 19.00. Long gamma begins at 22.00 with weakening conviction at 35.00.

TNX has been losing ground beneath Intermediate-term resistance at 35.89 and may be due to retest the 200-day Moving Average at 33.23. Alternatively, there are potentially two more weeks in the current Master Cycle which may allow TNX to reverse course. The reason is that the uptrend defined by the mid-Cycle support and 200-day Moving Average as not broken. This allows the rally to continue, preferably above the trendline. Note the dealer takedown in the following article. Rising interest rates may increase the dealer takedown beyond their capability to absorb the excess after the Directs and Indirects take their share.
ZeroHedge reports, “Back in November, when the 2Y auction hit a cycle high of 4.513%, markets knowingly nodded muttering that the bond market was agreeing with the hawkish Fed. Since then however, things haven’t gone according to plan with each auction printing at an lower and lower yield, culminating with today’s sale of 2Y paper which priced at just 4.139%, down from 4.390% in December, and the lowest since August. It also stopped through the When Issued 4.152% by 1.3bps, the third consecutive stop through which prior to December had tailed 3 of the past 5 times.
The Bid to Cover confirmed the stellar demand, jumping from 2.713 to 2.944, the highest going back all the way to the flight to safety bond market chaos of April 2020.
Finally, the internals were also phenomenal, with Indirects – or foreign buyers – awarded a whopping 65.0%, the third highest on record, and well above the recent average of 57.4%. And with Directs taking down 18.7%, it meant that Dealers were left holding on to just 16.3% which was also one of the lowest on record.”

USD futures continue to consolidate in a narrow trading range. That may not last, as the USD trending strength may be about to explode higher. The emergence of trending strength, especially on the weekends, suggest a non-economic event, such as war, is about to be revealed.

Gold futures fell from their Master Cycle high at 1943.80 yesterday precisely to its Cycle Top support at 1920.75 this morning. A sell signal lies beneath that level. The Cycles Model also shows some disturbance starting this weekend.