
10:56 am

Last week I had warned that crude oil may give a false signal to the upside. Yesterday it did just that, exceeding its prior high and completing its Wave 4 formation and Master Cycle (day 266). This is a setup for a potential panic decline with trending strength beginning later this week. The Cup with Handle formation provides the minimum target and Broadening Wedge giving the more bearish outlook. The next Master Cycle is due in the first week of December. Keep this in mind as crude oil may be a leading indicator for the direction of the stock market.
10:34 am

The SPX Wave structure is becoming even more complex with a Broadening Wedge inside another Broadening formation. This may end up as an inversion (Master Cycle high) as today is already day 257. This has been totally unforeseen as it indicates a very high emotional pitch that is likely to leave most investors long at the end of the Cycle…just in time for a 5-week crash.
8:00 am

NDX futures rose during the night but remained beneath the Lip of the Cup with Handle formation at 11100.00, which leaves the sell signal intact. To complete Wave (C), NDX must decline beneath 8000.00 at a minimum, as the Cup with Handle formation indicates. The anticipated panic decline expected this week may be sufficient time to met its target. The next Master Cycle pivot occurs in mid-December.
Today’s op-ex is light with Maximum Pain for options investors at 11120.00. Long gamma may begin at 11150.0. Short gamma starts at 11100.00, right on the Lip of the bearish formation. QQQ (closing price: 267.59) offers Max Pain at 264..00. Long gamma starts at 268.00, while short gamma rules beneath 260.00.
ZeroHedge comments, “Puking puts
“They” loved puts at recent market lows…and “they” are now in put puke mode. Let’s see if put hate goes extreme…
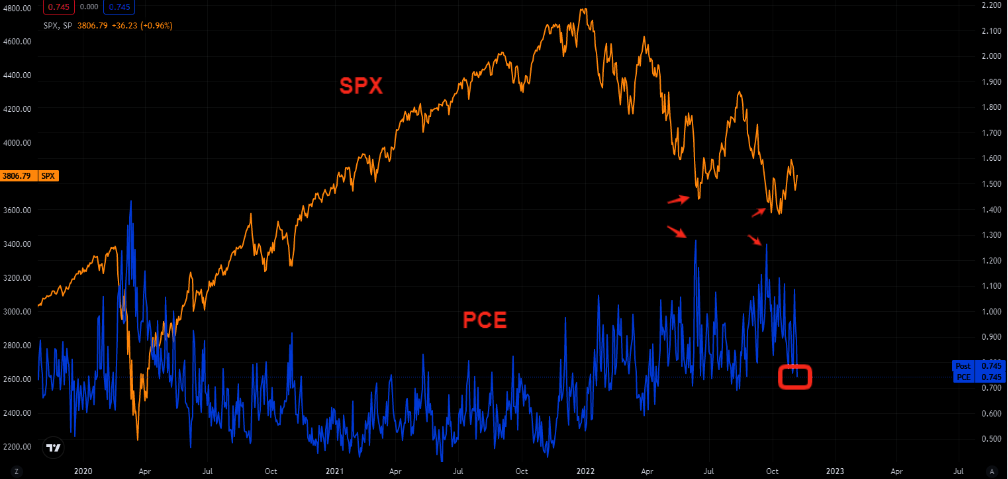
Source: Refinitiv
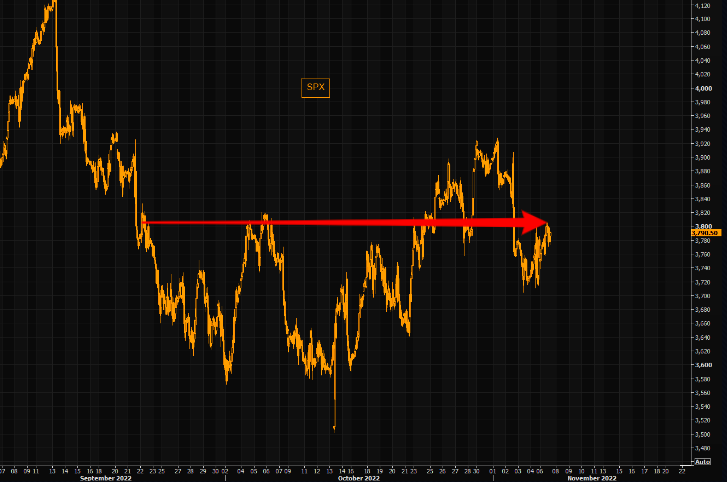
Much ado about nothing?
Gentle reminder of the fact that nobody is in control. SPX is at the same levels we traded at on Sep 21…

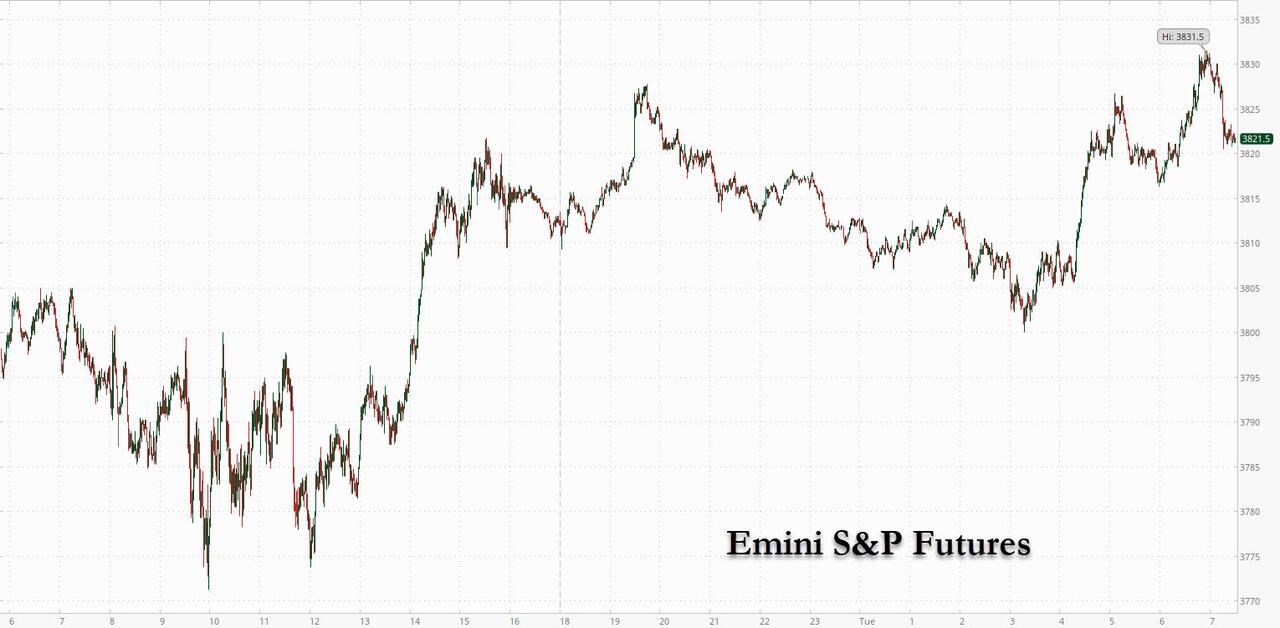
SPX futures are challenging the 50-day Moving Average at 3812.59. It remains on a confirmed sell beneath the 50-day. Futures Cycles run on a parallel track to the daytime market, but may go higher or lower from time to time. For example, the 50-day MA in futures may be at 3820.00, leaving it on a sell signal in the overnight market, which may quickly resolve itself at the open.
Today’s op-ex shows Max Pain at 3780.00. Long gamma begins at 3805.00, picking up intensity at 3815.00 while short gamma may start at 3775.00. Certainly short beneath 3750.00.
ZeroHedge reports, “US equity futures rose as bond yields dipped as Americans headed to the polls on Tuesday for midterm elections where Republicans are expected to gain as many as 75 seats in the House and 11 in the Senate, while traders were also bracing for a key CPI print later this week. Nasdaq 100 futures were up 0.5% by 7:30 a.m. in New York, while S&P 500 futures rose 0.2% to trade at 3,820 and above a key CTA threshold level (as Goldman notes overnight “CTA short term momentum flipped from negative to positive w/ the close north of 3804”). The US Dollar was little changed as was the yield on the 10-year Treasury after rising for the past four days.

VIX futures remained range-bound with no new foray higher or lower. Last Friday’s Master Cycle low at 24.00 and 284 days has been truly stretched.
In tomorrow’s op-ex, Maximum pain for options investors appears at 25.00. Short gamma also begins beneath 25.00, while long gamma starts at 26.00. Long gamma is maintained to 40.00.
ZeroHedge remarks, “But SPX has crashed – why isn’t VIX higher?
“VIX should be much higher as SPX has crashed”. Lot of people that have never traded volatility as an asset are having this view, but that remains a fallacy. Volatility is mean reverting over time. VIX has basically been stuck in a range this entire year. Yes, a wide range, but there is no trend. Currently we are in the middle of the range, hence our view of “VIX being not cheap enough to buy, nor expensive enough to short“. The SPX is down around 20%, from all time highs, but VIX is trading at the same levels as when the SPX traded at around 4650/4700. Do not confuse direction with pace…VIX prices the latter.

Source: Refinitiv
What is volatility saying here?
SPX volatility has decreased over past weeks. The 1 month implied volatility is trading below 1 month realized volatility, but what is the market pricing here? The 1 month ATM is priced around 24, implying daily moves of around 1.4% for the SPX. You buy volatility if you think we will move more and sell volatility of you think we will move less, and delta hedge if you are running a volatility book. Will we move more or less?”
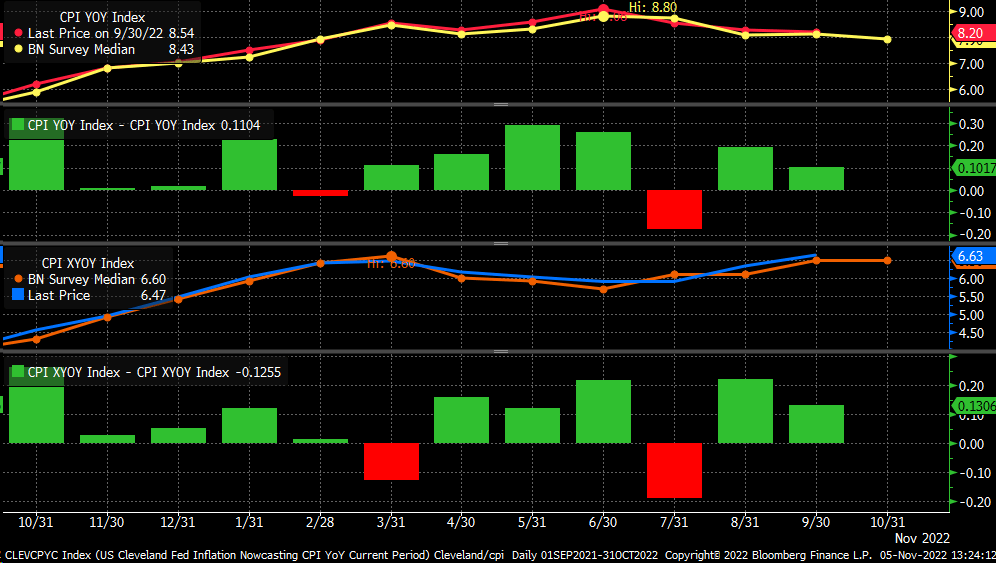
SeekingAlpha observes, “With the consumer price index on deck, it will be another big week for markets. The CPI report has been a market-moving event for the last few months, and the October report comes Thursday, November 10.
Estimates May Be Too Low
Consensus estimates may prove too low again for both headline and core CPI. For October, CPI is estimated to have risen by 7.9%, down from September’s reading of 8.2%. Meanwhile, core CPI is estimated to have increased by 6.5%, down from September’s 6.6%. The problem is that CPI and core CPI have met or beaten estimates in 10 out of the last 12 months.”

TNX has eased beneath its Cycle Top support at 42.09. This may just be the calm before the storm, since trending strength may go on a rampage for the rest of the week, if not longer.